

Oversecretion and Overexpression of Nicotinamide Phosphoribosyltransferase/Pre-B Colony-Enhancing Factor/Visfatin in Inflammatory Bowel Disease Reflects the Disease Activity, Severity of Inflammatory Response and Hypoxia
- PMID: 30621173
- PMCID: PMC6337260
- DOI: 10.3390/ijms20010166
Oversecretion and Overexpression of Nicotinamide Phosphoribosyltransferase/Pre-B Colony-Enhancing Factor/Visfatin in Inflammatory Bowel Disease Reflects the Disease Activity, Severity of Inflammatory Response and Hypoxia
Abstract
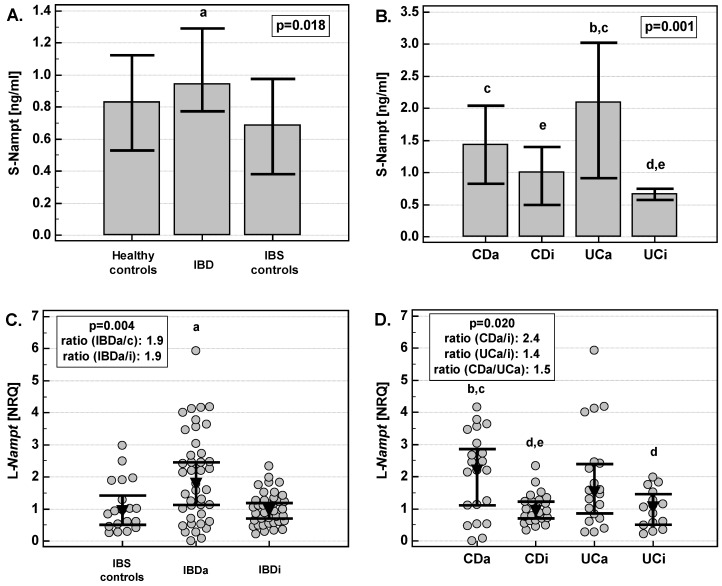
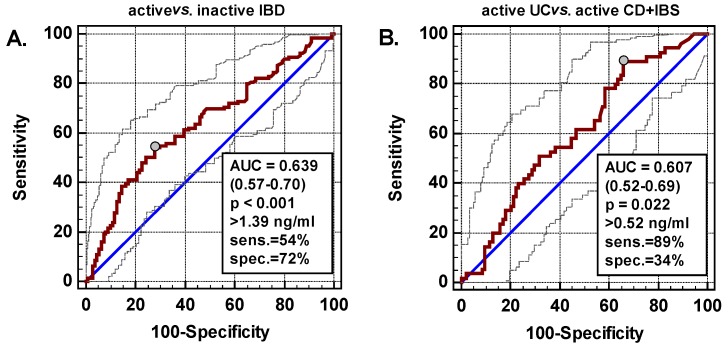
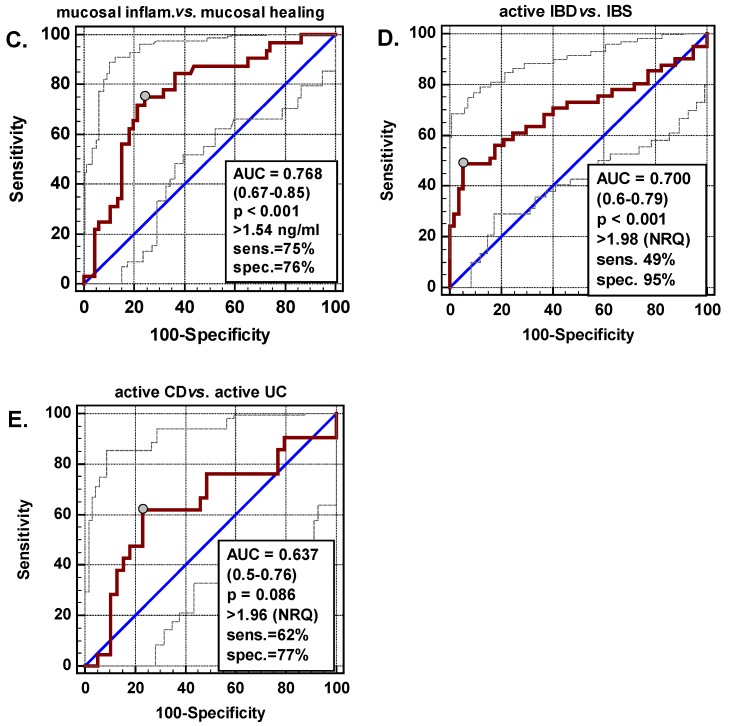
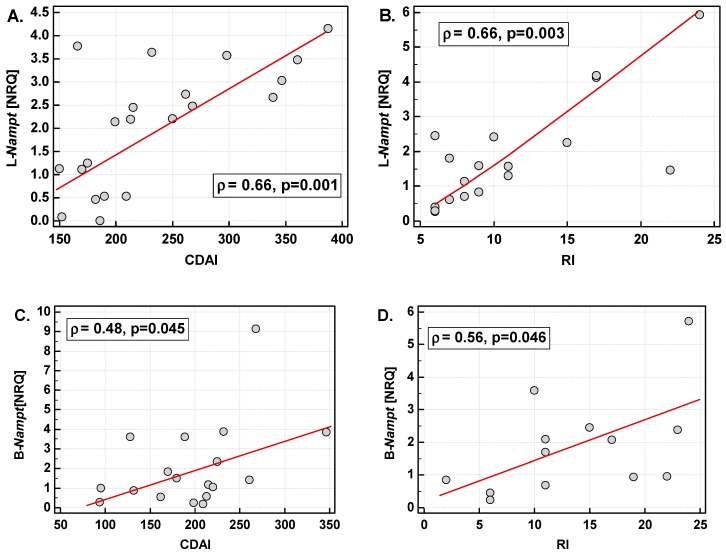
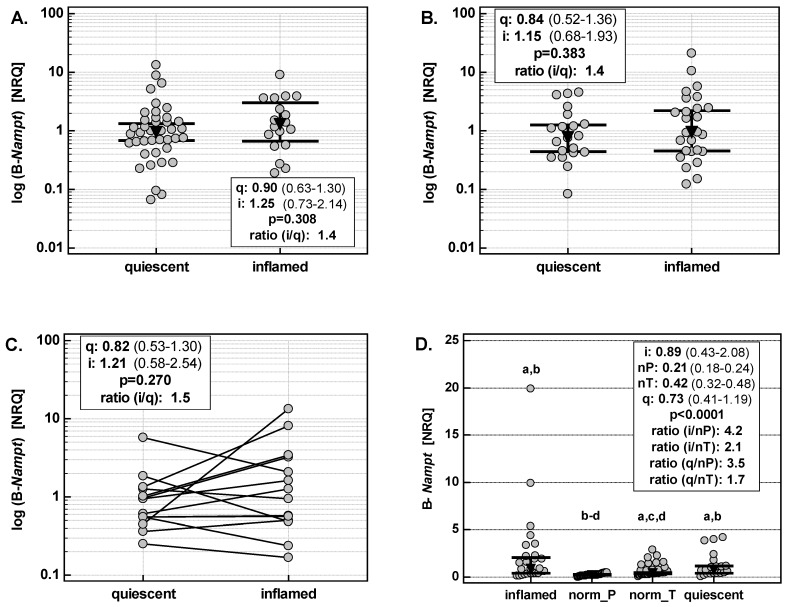
Nicotinamide phosphoribosyltransferase's (Nampt) association with inflammatory bowel disease (IBD) is unclear. The study was aimed at unraveling Nampt's clinical and diagnostic relevance. The serum concentration (Luminex-xMAP® technology) was measured in 113 patients with Crohn's disease (CD), 127 with ulcerative colitis (UC) and 60 non-IBD controls: 40 healthy individuals and 20 with irritable bowel syndrome (IBS). The leukocyte (44 CD/37 UC/19 IBS) and bowel expression (186 samples) was also evaluated (RT-qPCR). All were referred to IBD phenotype, activity, treatment, and inflammatory/nutritional/angiogenic/hypoxia indices. Serum-Nampt and leukocyte-Nampt were positively correlated and were more elevated in active-IBD than in IBS, with leukocyte-Nampt being a fair differential marker. Serum-Nampt in UC positively correlated with its clinical and endoscopic activity as well as with pro-inflammatory cytokines. Serum-Nampt ≤1.54 ng/mL was a good indicator of mucosal healing. The expression of Nampt was up-regulated both in inflamed and quiescent colon and reflected, similarly to leukocyte-Nampt, the clinical activity of IBD. Bowel-Nampt was independently associated with IL1B and hypoxia-inducible factor 1α (HIF1A) expression in inflamed bowel but with FGF2 expression in quiescent bowel. In summary, Nampt's elevation in IBD at local and systemic levels, and protein and mRNA levels, reflects IBD activity and is associated with inflammation, hypoxia (active) and tissue repair (inactive disease).
Keywords: Crohn’s disease; Nicotinamide phosphoribosyltransferase (Nampt); biomarker; epithelial-to-mesenchymal transition; hypoxia; inflammatory bowel disease (IBD); mucosal healing; pre-B factor (PBEF); ulcerative colitis; visfatin.
Conflict of interest statement
The authors declare no conflict of interest.
Figures
Similar articles
-
Serum Visfatin as a Diagnostic Marker of Active Inflammatory Bowel Disease.J Gastrointestin Liver Dis. 2021 Sep 21;30(3):339-345. doi: 10.15403/jgld-3504. J Gastrointestin Liver Dis. 2021. PMID: 34551033
-
Pre-B cell colony enhancing factor/NAMPT/visfatin and its role in inflammation-related bone disease.Mutat Res. 2010 Aug 7;690(1-2):95-101. doi: 10.1016/j.mrfmmm.2009.06.012. Epub 2009 Jul 5. Mutat Res. 2010. PMID: 19583971
-
Serum adipokines in inflammatory bowel disease.World J Gastroenterol. 2014 Jun 14;20(22):6912-7. doi: 10.3748/wjg.v20.i22.6912. World J Gastroenterol. 2014. PMID: 24944482 Free PMC article.
-
Relationship of visfatin with obesity and osteoporosis in patients with inflammatory bowel disease: a narrative review.Front Immunol. 2025 Mar 18;16:1533955. doi: 10.3389/fimmu.2025.1533955. eCollection 2025. Front Immunol. 2025. PMID: 40170859 Free PMC article. Review.
-
Are faecal markers good indicators of mucosal healing in inflammatory bowel disease?World J Gastroenterol. 2015 Oct 28;21(40):11469-80. doi: 10.3748/wjg.v21.i40.11469. World J Gastroenterol. 2015. PMID: 26523111 Free PMC article. Review.
Cited by
-
Differential miRNA-Gene Expression in M Cells in Response to Crohn's Disease-Associated AIEC.Microorganisms. 2020 Aug 7;8(8):1205. doi: 10.3390/microorganisms8081205. Microorganisms. 2020. PMID: 32784656 Free PMC article.
-
Omega Fatty Acids and Inflammatory Bowel Diseases: An Overview.Int J Mol Sci. 2019 Sep 30;20(19):4851. doi: 10.3390/ijms20194851. Int J Mol Sci. 2019. PMID: 31574900 Free PMC article. Review.
-
Epithelial NAD+ depletion drives mitochondrial dysfunction and contributes to intestinal inflammation.Front Immunol. 2023 Sep 7;14:1231700. doi: 10.3389/fimmu.2023.1231700. eCollection 2023. Front Immunol. 2023. PMID: 37744380 Free PMC article.
-
Exploration of the molecular linkage between endometriosis and Crohn disease by bioinformatics methods.Medicine (Baltimore). 2024 May 17;103(20):e38097. doi: 10.1097/MD.0000000000038097. Medicine (Baltimore). 2024. PMID: 38758892 Free PMC article.
-
Interactions between NAD+ metabolism and immune cell infiltration in ulcerative colitis: subtype identification and development of novel diagnostic models.Front Immunol. 2025 Feb 5;16:1479421. doi: 10.3389/fimmu.2025.1479421. eCollection 2025. Front Immunol. 2025. PMID: 39975557 Free PMC article.
References
MeSH terms
Substances
Grants and funding
LinkOut - more resources
Full Text Sources
Miscellaneous
