. 2019 Jan 5;11(1):96.
doi: 10.3390/nu11010096.

Maternal High-Protein Diet during Pregnancy Modifies Rat Offspring Body Weight and Insulin Signalling but Not Macronutrient Preference in Adulthood

Affiliations

Maternal High-Protein Diet during Pregnancy Modifies Rat Offspring Body Weight and Insulin Signalling but Not Macronutrient Preference in Adulthood

Gabrielle Carlin et al. Nutrients. .

Abstract

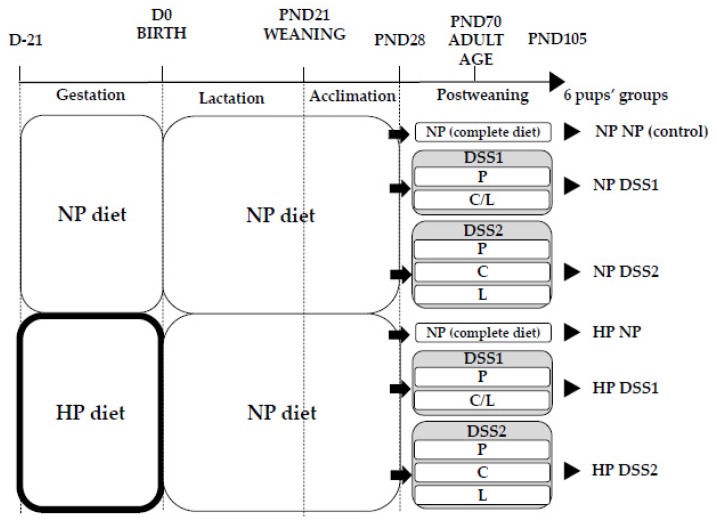
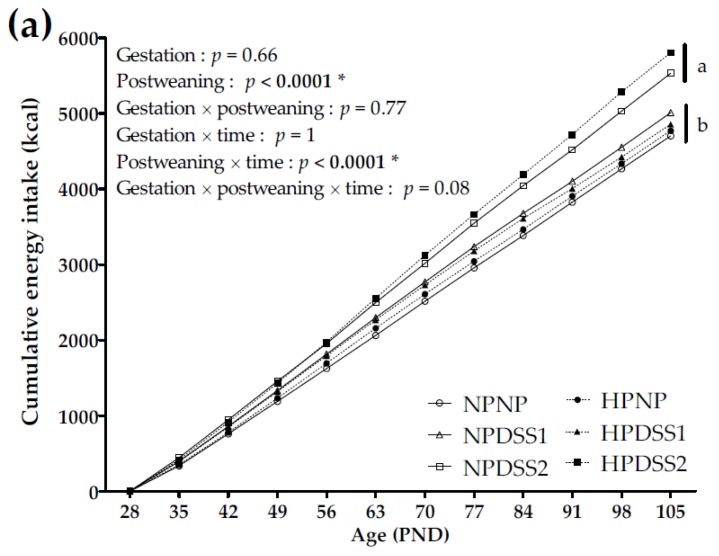
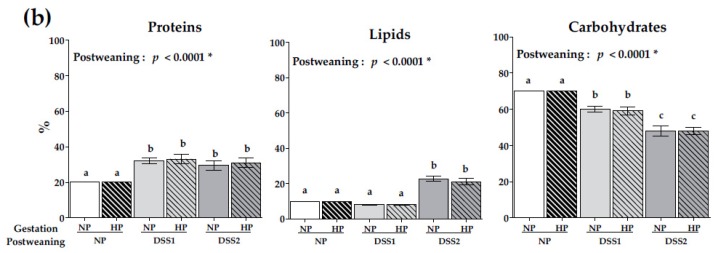
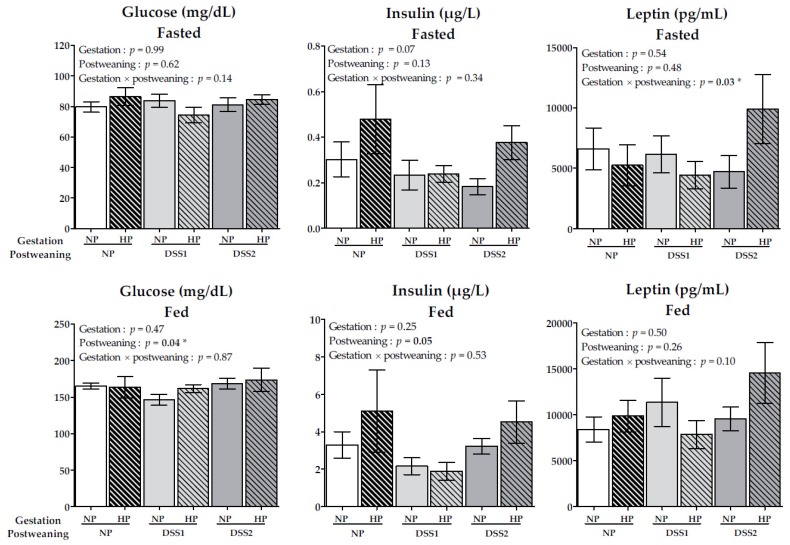
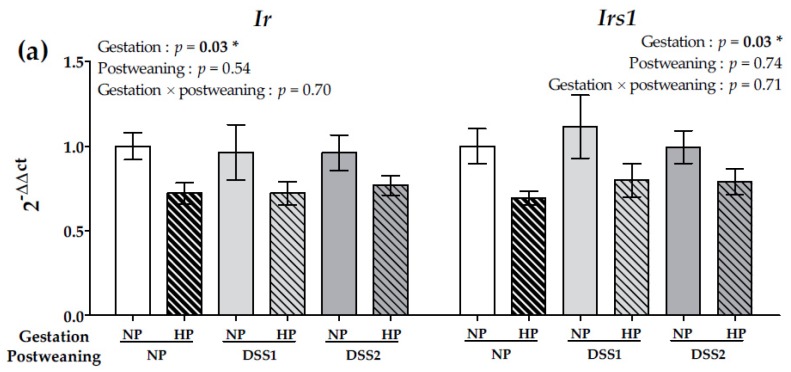
Diet of mothers during gestation may impact offspring phenotype. This study evaluated the consequences of a maternal High-Protein (HP) diet during gestation on food preferences and phenotypic characteristics in adult rat offspring. Dams were fed a HP or a Normal-Protein (NP) isocaloric diet during gestation only. Weaned female pups were divided into 3 diet groups: NP control or one of two dietary self-selection (DSS) conditions. In DSS1, offspring had a free choice between proteins (100%) or a mix of carbohydrates (88%) and lipids (12%). In DSS2, the choice was between proteins (100%), carbohydrate (100%) or lipids (100%). DSS2 groups consumed more of their energy from protein and lipids, with a decreased carbohydrate intake (p < 0.0001) compared to NP groups, regardless of the maternal diet. Offspring from HP gestation dams fed the DSS2 diet (HPDSS2) had a 41.2% increase of total adiposity compared to NPDSS2 (p < 0.03). Liver Insulin receptor and Insulin substrate receptor 1 expression was decreased in offspring from HP compared to NP gestation dams. These results showed the specific effects of DSS and maternal diet and data suggested that adult, female offspring exposed to a maternal HP diet during foetal life were more prone to adiposity development, in response to postweaning food conditions.

Keywords: adiposity; dietary self-selection; food preferences; gestation; high-protein diet; programming; rat.


Conflict of interest statement

G.C., C.C., F.B., P.B., N.D., A.B., C.D., F.M.G., S.B., D.T. and A.-M.D., no conflict of interest. E.M.v.d.B. and A.K. are employees of DNR.

Figures

Figure 1
Figure 1
Six experimental groups formed. Dams received a NP control diet or a HP diet during gestation only. From PND28 until PND105, pups were divided into 3 groups from each dam group: NP diet (control, no free choices), DSS1 with P and G/L in 2 different cups and DSS2 with P, G and L in 3 different cups. D, Day; PND, Post-Natal Day; NP, Normal-Protein (control); HP, High-Protein; DSS, Dietary Self-Selection; P, Proteins; C/L, Carbohydrates and Lipids mix; C, Carbohydrates; L, Lipids.
Figure 2
Figure 2
Cumulative energy intake during self-selection period from PND28 to PND105 (a) and macronutrient (Proteins, Lipids and Carbohydrates) consumption levels (% of total energy intake) on PND105 (b). Data are means ± SEMs. Effects of diets were tested within model W and Wt (*, p < 0.05). Means that are significantly different (p < 0.05) according to the post-hoc test have different letters (a or b or c). PND, Post-natal Day; NP, Normal-Protein (control); HP, High-Protein; DSS1, Dietary Self-Selection 1 (P and G/L in 2 different cups); DSS2, Dietary Self-Selection 2 (P, G and L in 3 different cups).
Figure 2
Figure 2
Cumulative energy intake during self-selection period from PND28 to PND105 (a) and macronutrient (Proteins, Lipids and Carbohydrates) consumption levels (% of total energy intake) on PND105 (b). Data are means ± SEMs. Effects of diets were tested within model W and Wt (*, p < 0.05). Means that are significantly different (p < 0.05) according to the post-hoc test have different letters (a or b or c). PND, Post-natal Day; NP, Normal-Protein (control); HP, High-Protein; DSS1, Dietary Self-Selection 1 (P and G/L in 2 different cups); DSS2, Dietary Self-Selection 2 (P, G and L in 3 different cups).
Figure 3
Figure 3
Body weight during the self-selection period from PND28 to PND105 and final weight gain on PND105 (a) and total adipose tissue weights on PND105 estimated by Magnetic Resonance Imaging (MRI) and by dissection (b). Data are means ± SEMs. Effects of diets were tested within model W and Wt (*, p < 0.05). PND, Post-natal Day; NP, Normal-Protein (control); HP, High-Protein; DSS1, Dietary Self-Selection 1 (P and G/L in 2 different cups); DSS2, Dietary Self-Selection 2 (P, G and L in 3 different cups); MRI: Magnetic Resonance Imaging.
Figure 4
Figure 4
Fasted and fed (90 minutes after calibrated meal) blood and plasma glucose (mg/dL), insulin (µg/L) and leptin (pg/mL) levels. Data are means ± SEMs. Effects of diets were tested within model W (*, P < 0.05). NP, Normal-Protein (control); HP, High-Protein; DSS1, Dietary Self-Selection 1 (P and G/L in 2 different cups); DSS2, Dietary Self-Selection 2 (P, G and L in 3 different cups).
Figure 5
Figure 5
Gene expression in NAcc of Drd1 and Drd2 (a) and gene expression in liver of IR and IRS1 (b) on data collected on PND105. Data are means ± SEMs. Effects of diets were tested within model W (*, p < 0.05). Means that are significantly different (p < 0.05) according to the post-hoc test have different letters (a or b). Drd1 and 2, Dopamine receptors 1 and 2; IR, Insulin receptor; IRS1, Insulin receptor substrate 1; PND, Post-natal Day; NP, Normal-Protein (control); HP, High-Protein; DSS1, Dietary Self-Selection 1 (P and G/L in 2 different cups); DSS2, Dietary Self-Selection 2 (P, G and L in 3 different cups).
Figure 5
Figure 5
Gene expression in NAcc of Drd1 and Drd2 (a) and gene expression in liver of IR and IRS1 (b) on data collected on PND105. Data are means ± SEMs. Effects of diets were tested within model W (*, p < 0.05). Means that are significantly different (p < 0.05) according to the post-hoc test have different letters (a or b). Drd1 and 2, Dopamine receptors 1 and 2; IR, Insulin receptor; IRS1, Insulin receptor substrate 1; PND, Post-natal Day; NP, Normal-Protein (control); HP, High-Protein; DSS1, Dietary Self-Selection 1 (P and G/L in 2 different cups); DSS2, Dietary Self-Selection 2 (P, G and L in 3 different cups).

References

    1. Langley-Evans S.C. Nutritional programming of disease: Unravelling the mechanism. J. Anat. 2009;215:36–51. doi: 10.1111/j.1469-7580.2008.00977.x. - DOI - PMC - PubMed
    1. Duque-Guimarães D.E., Ozanne S.E. Nutritional programming of insulin resistance: Causes and consequences. Trends Endocrinol. Metab. 2013;24:525–535. doi: 10.1016/j.tem.2013.05.006. - DOI - PubMed
    1. Ravelli A.C., van der Meulen J.H., Osmond C., Barker D.J., Bleker O.P. Obesity at the age of 50 y in men and women exposed to famine prenatally. Am. J. Clin. Nutr. 1999;70:811–816. doi: 10.1093/ajcn/70.5.811. - DOI - PubMed
    1. Gluckman P.D., Hanson M.A., Cooper C., Thornburg K.L. Effect of in utero and early-life conditions on adult health and disease. New Engl. J. Med. 2008;358:6173. doi: 10.1056/NEJMra0708473. - DOI - PMC - PubMed
    1. Godfrey K.M., Gluckman P.D., Hanson M.A. Developmental origins of metabolic disease: Life course and intergenerational perspectives. Trends Endocrinol. Metab. 2010;21:199–205. doi: 10.1016/j.tem.2009.12.008. - DOI - PubMed

MeSH terms