

The circRNA circAGFG1 acts as a sponge of miR-195-5p to promote triple-negative breast cancer progression through regulating CCNE1 expression
- PMID: 30621700
- PMCID: PMC6325825
- DOI: 10.1186/s12943-018-0933-7
The circRNA circAGFG1 acts as a sponge of miR-195-5p to promote triple-negative breast cancer progression through regulating CCNE1 expression
Retraction in
-
Retraction Note to: The circRNA circAGFG1 acts as a sponge of miR-195-5p to promote triple-negative breast cancer progression through regulating CCNE1 expression.Mol Cancer. 2022 Jul 8;21(1):142. doi: 10.1186/s12943-022-01613-w. Mol Cancer. 2022. PMID: 35804444 Free PMC article. No abstract available.
Abstract
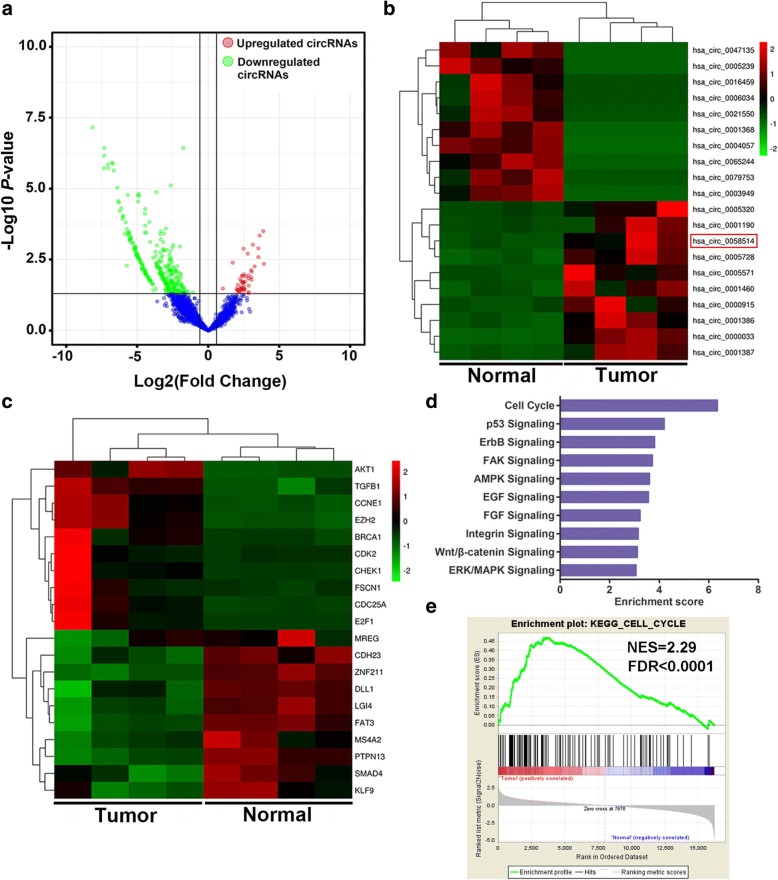
Background: In recent years, circular RNAs (circRNAs), a new star of non-coding RNA, have been emerged as vital regulators and gained much attention for involvement of initiation and progression of diverse kinds of human diseases, especially cancer. However, regulatory role, clinical significance and underlying mechanisms of circRNAs in triple-negative breast cancer (TNBC) still remain largely unknown.
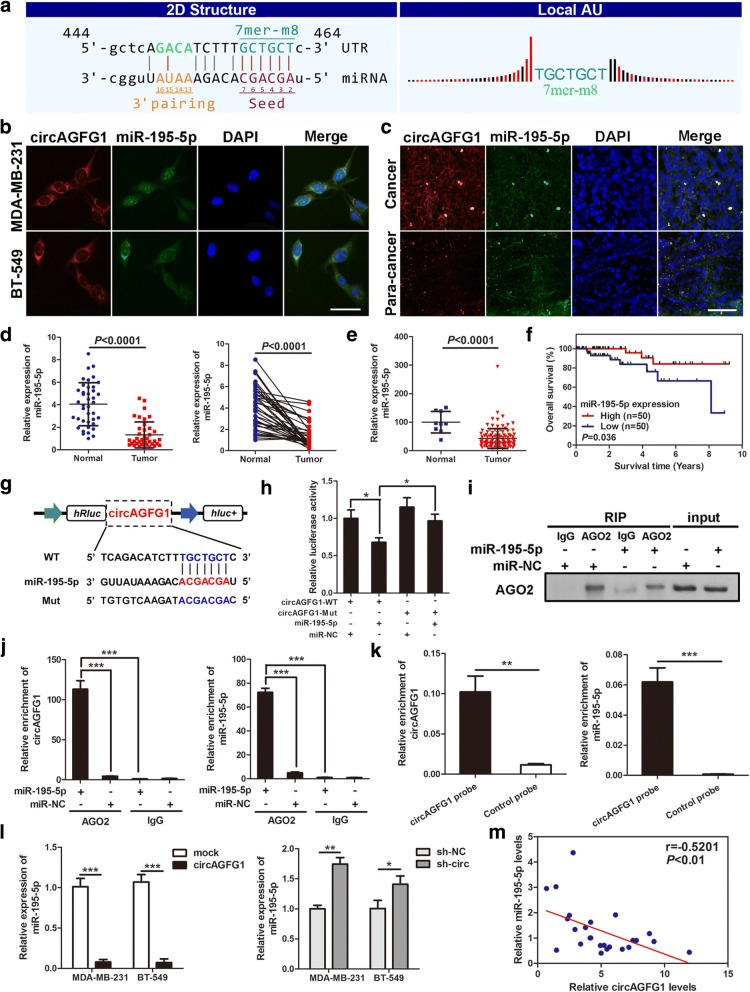
Methods: Here, the expression profile of circRNAs in 4 pairs of TNBC tissues and adjacent non-tumor tissues was analyzed by RNA-sequencing. Quantitative real-time PCR and in situ hybridization were used to determine the level and prognostic values of circAGFG1 in two TNBC cohorts. Then, functional experiments in vitro and in vivo were performed to investigate the effects of circAGFG1 on tumor growth and metastasis in TNBC. Mechanistically, fluorescent in situ hybridization, dual luciferase reporter assay, RNA pull-down and RNA immunoprecipitation experiments were performed to confirm the interaction between circAGFG1 and miR-195-5p in TNBC.
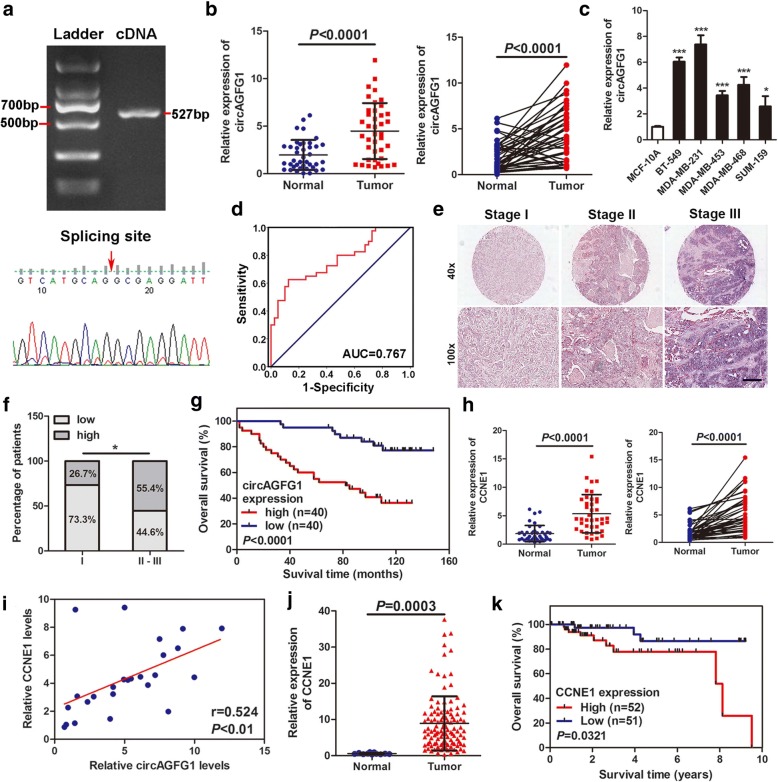
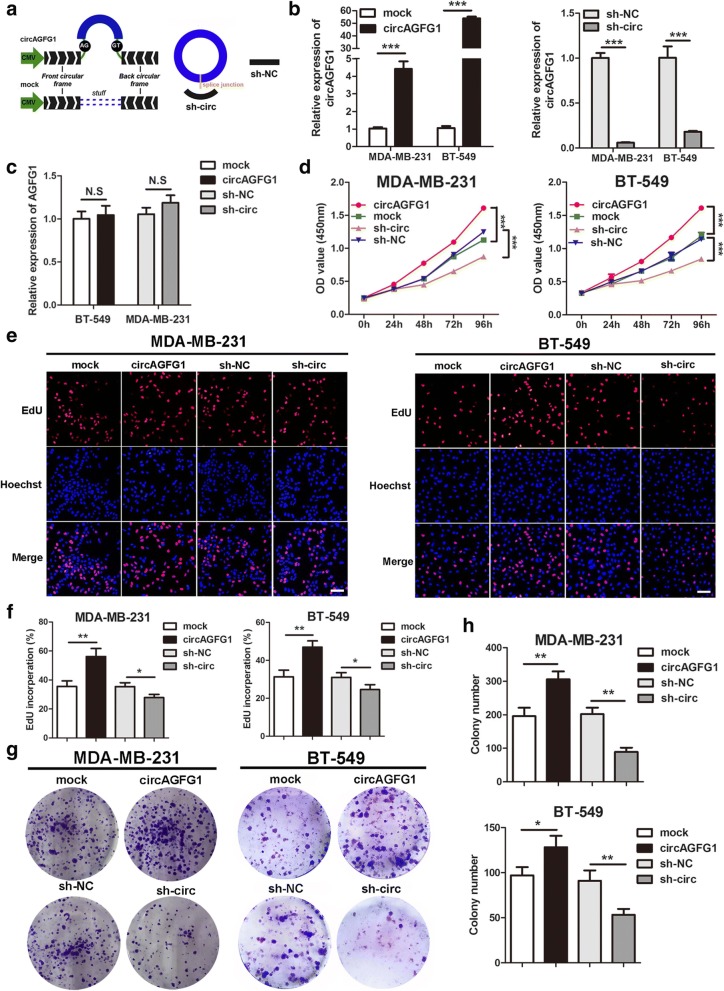
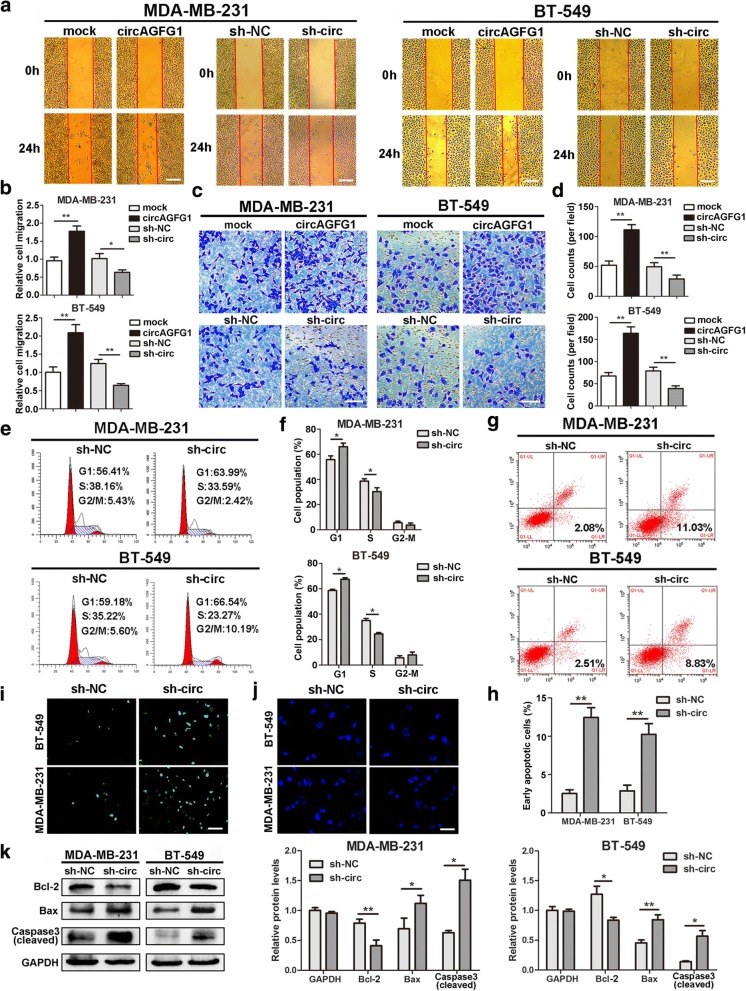
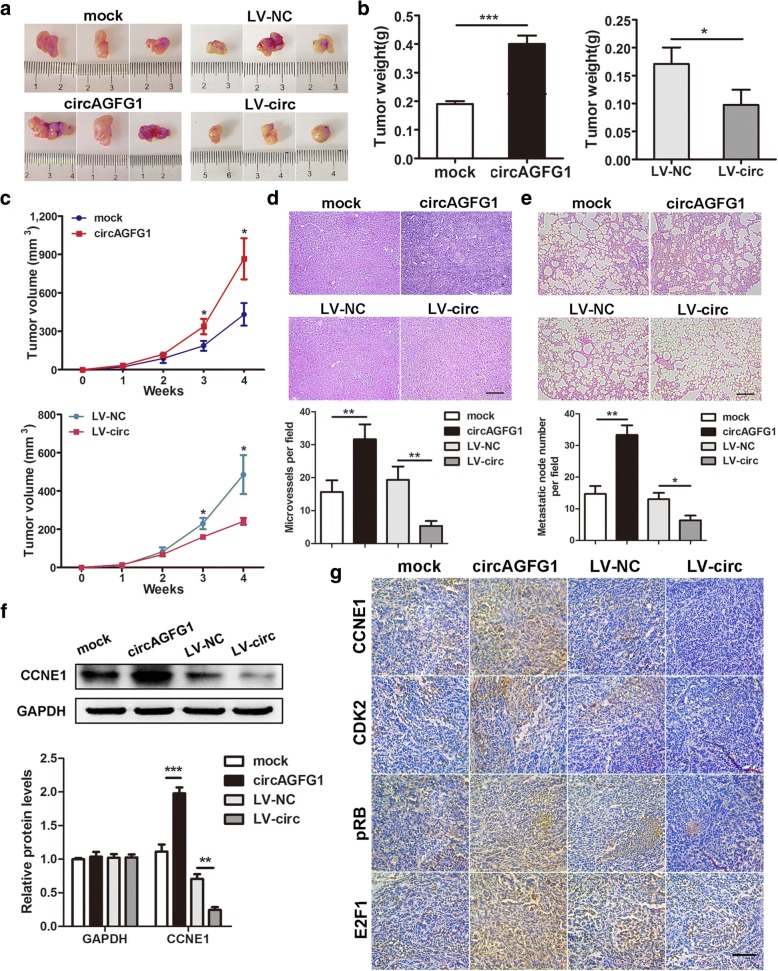
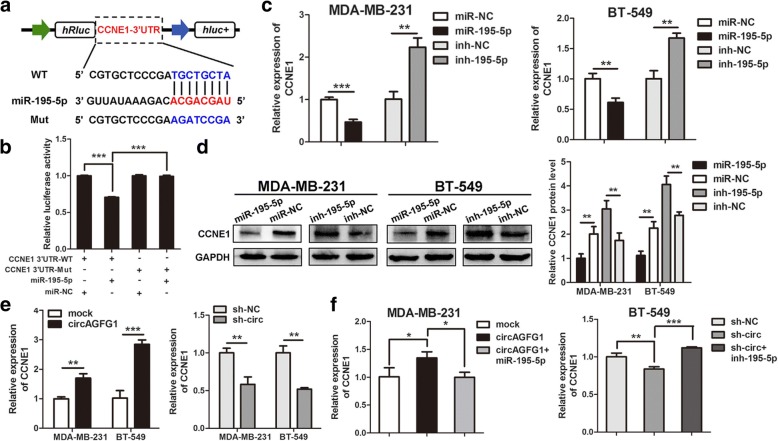
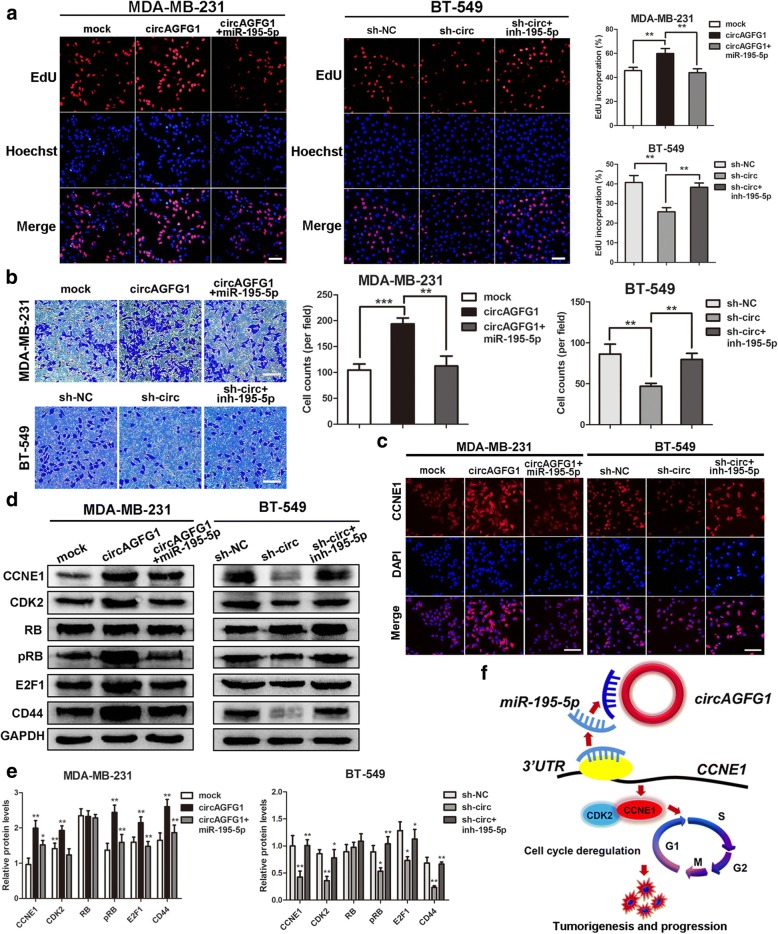
Results: We found that circAGFG1 was evidently up-regulated in TNBC, and its level was correlated with clinical stage, pathological grade and poor prognosis of patients with TNBC. The results indicated that circAGFG1 could promote TNBC cell proliferation, mobility and invasion as well as tumorigenesis and metastasis in vivo. Mechanistic analysis showed that circAGFG1 may act as a ceRNA (competing endogenous RNA) of miR-195-5p to relieve the repressive effect of miR-195-5p on its target cyclin E1 (CCNE1).
Conclusions: Our findings suggest that circAGFG1 promotes TNBC progression through circAGFG1/miR-195-5p/CCNE1 axis and it may serve as a new diagnostic marker or target for treatment of TNBC patients.
Keywords: CCNE1; Triple-nagetive breast cancer; circAGFG1; miR-195-5p.
Conflict of interest statement
Ethics approval and consent to participate
All tissue samples were in accordance with the ethical guidelines of the First Affiliated Hospital of Chongqing Medical University the Helsinki declaration. Written informed consents were obtained from all patients.
Consent for publication
All authors give consent for the publication of the manuscript in Molecular Cancer.
Competing interests
The authors declare that they have no competing interests.
Publisher’s Note
Springer Nature remains neutral with regard to jurisdictional claims in published maps and institutional affiliations.
Figures
Similar articles
-
The circRNA circIFI30 promotes progression of triple-negative breast cancer and correlates with prognosis.Aging (Albany NY). 2020 Jun 4;12(11):10983-11003. doi: 10.18632/aging.103311. Epub 2020 Jun 4. Aging (Albany NY). 2020. PMID: 32497020 Free PMC article.
-
CircWHSC1 regulates malignancy and glycolysis by the miR-212-5p/AKT3 pathway in triple-negative breast cancer.Exp Mol Pathol. 2021 Dec;123:104704. doi: 10.1016/j.yexmp.2021.104704. Epub 2021 Oct 6. Exp Mol Pathol. 2021. PMID: 34624276
-
The circRNA circSEPT9 mediated by E2F1 and EIF4A3 facilitates the carcinogenesis and development of triple-negative breast cancer.Mol Cancer. 2020 Apr 7;19(1):73. doi: 10.1186/s12943-020-01183-9. Mol Cancer. 2020. PMID: 32264877 Free PMC article.
-
MicroRNAs in regulation of triple-negative breast cancer progression.J Cancer Res Clin Oncol. 2018 Aug;144(8):1401-1411. doi: 10.1007/s00432-018-2689-2. Epub 2018 Jun 19. J Cancer Res Clin Oncol. 2018. PMID: 29923083 Free PMC article. Review.
-
CircRNAs in extracellular vesicles associated with triple-negative breast cancer.Cell Mol Biol (Noisy-le-grand). 2025 Jan 12;70(12):99-109. doi: 10.14715/cmb/2024.70.12.14. Cell Mol Biol (Noisy-le-grand). 2025. PMID: 39799490 Review.
Cited by
-
The Biogenesis and Functions of circRNAs and Their Roles in Breast Cancer.Front Oncol. 2021 Feb 25;11:605988. doi: 10.3389/fonc.2021.605988. eCollection 2021. Front Oncol. 2021. PMID: 33718157 Free PMC article. Review.
-
Circ-CSNK1G1 promotes cell proliferation, migration, invasion and glycolysis metabolism during triple-negative breast cancer progression by modulating the miR-28-5p/LDHA pathway.Reprod Biol Endocrinol. 2022 Sep 15;20(1):138. doi: 10.1186/s12958-022-00998-z. Reprod Biol Endocrinol. 2022. PMID: 36109751 Free PMC article.
-
The novel circFKBP8/miR-432-5p/E2F7 cascade functions as a regulatory network in breast cancer.Hereditas. 2024 Aug 27;161(1):27. doi: 10.1186/s41065-024-00331-1. Hereditas. 2024. PMID: 39192374 Free PMC article.
-
Current Status and Prospects of Clinical Treatment of Osteosarcoma.Technol Cancer Res Treat. 2022 Jan-Dec;21:15330338221124696. doi: 10.1177/15330338221124696. Technol Cancer Res Treat. 2022. PMID: 36128851 Free PMC article. Review.
-
Gene Expression Profiles of Circular RNAs and MicroRNAs in Chronic Rhinosinusitis With Nasal Polyps.Front Mol Biosci. 2021 May 28;8:643504. doi: 10.3389/fmolb.2021.643504. eCollection 2021. Front Mol Biosci. 2021. PMID: 34124144 Free PMC article.
References
Publication types
MeSH terms
Substances
LinkOut - more resources
Full Text Sources
