

Plasma lipidomic signatures of spontaneous obese rhesus monkeys
- PMID: 30621707
- PMCID: PMC6323686
- DOI: 10.1186/s12944-018-0952-9
Plasma lipidomic signatures of spontaneous obese rhesus monkeys
Abstract
Background: Obesity plays crucial roles in the pathogenesis of metabolic diseases such as hyperlipidemia, nonalcoholic fatty liver disease (NAFLD), and type 2 diabetes (T2D). The underlying mechanisms linking obesity to metabolic diseases are still less understandable.
Methods: Previously, we screened a group of spontaneously obese rhesus monkeys. Here, we performed a plasma lipidomic analysis of normal and obese monkeys using gas chromatography/mass spectroscopy (GC/MS) and ultra-high performance liquid chromatography/mass spectroscopy (UPLC/MS).
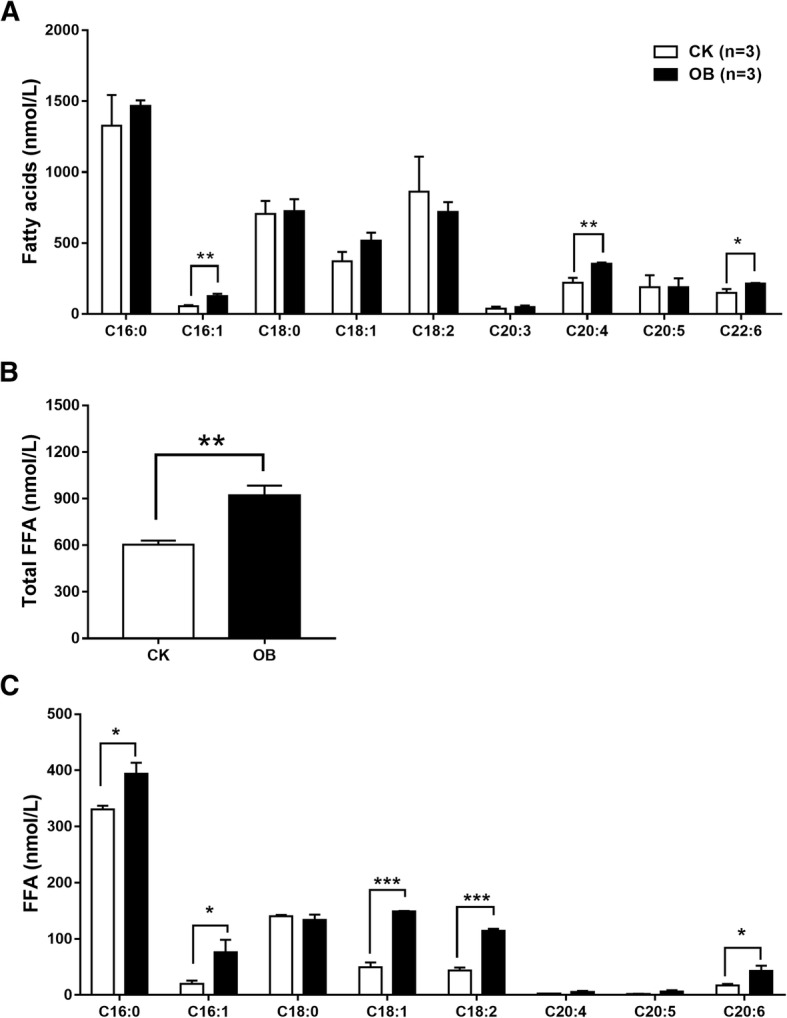
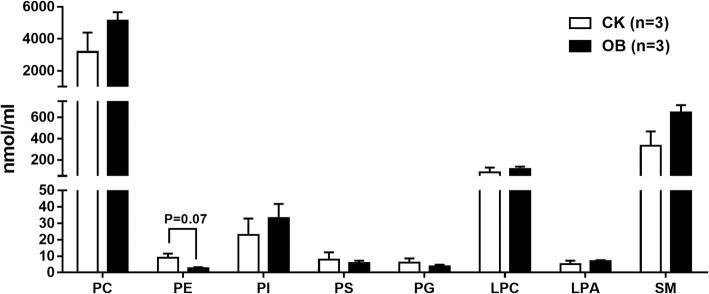
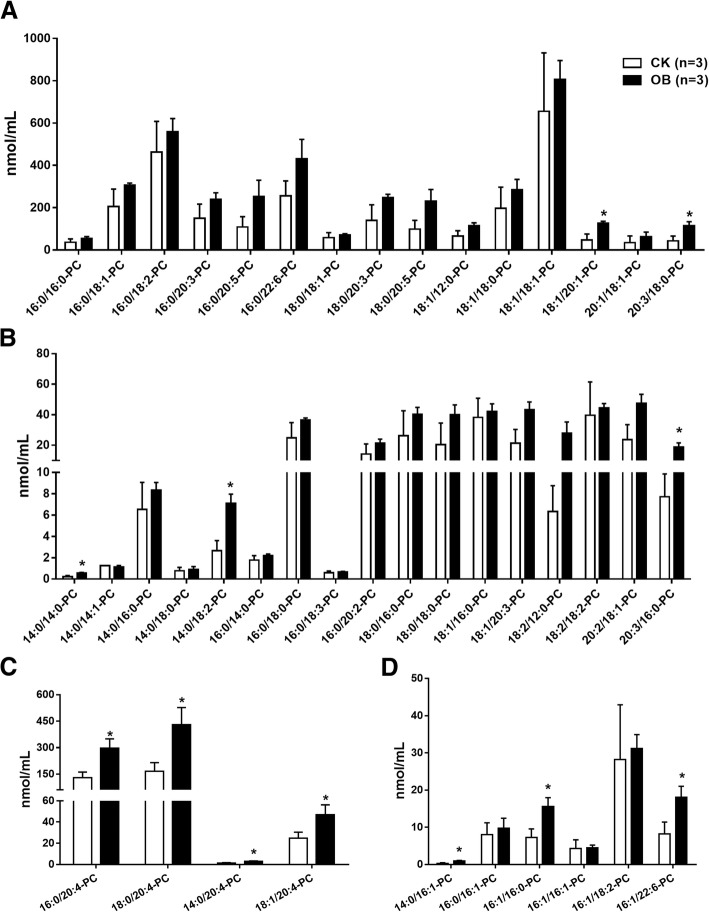
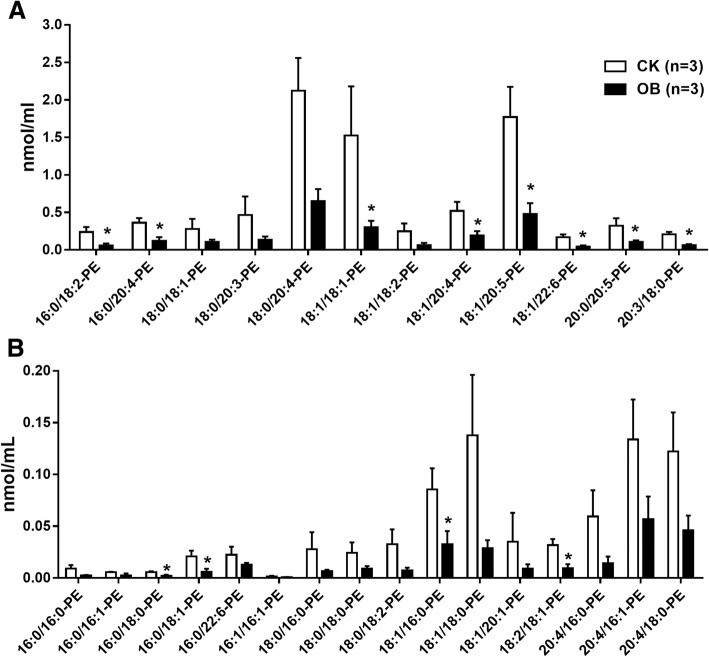
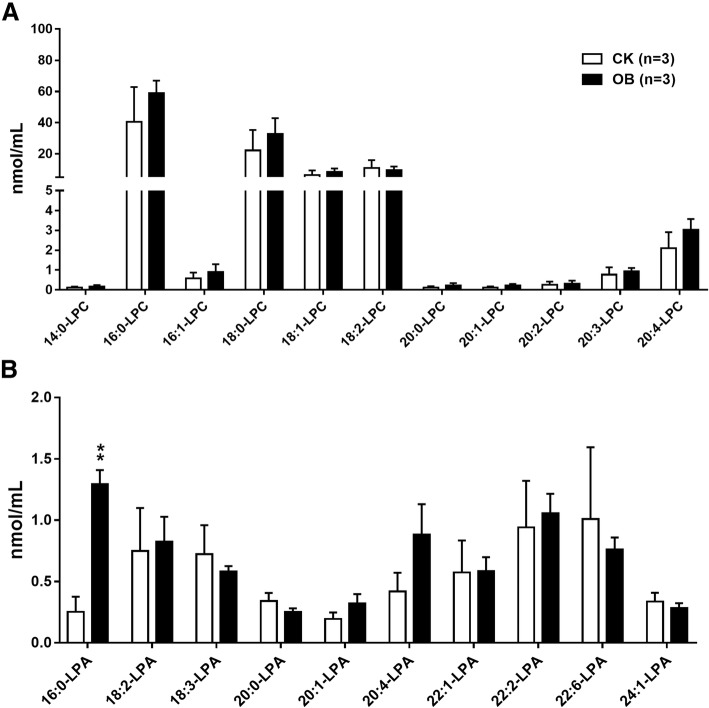
Results: In total, 143 lipid species were identified, quantified, and classified into free fatty acids (FFA), phosphatidylcholine (PC), phosphatidylethanolamine (PE), phosphatidylinositol (PI), phosphatidylserine (PS), phosphatidylglycerol (PG), lysophosphatidylcholine (LPC), lysophosphatidic acid (LPA), and sphingomyelin (SM). Data analysis showed that the obese monkeys had increased levels of fatty acids palmitoleic acid (C16:1) and arachidonic acid (C20:4), FFA especially palmitic acid (C16:0), as well as certain PC species and SM species. Surprisingly, the plasma level of LPA-C16:0 was approximately four-fold greater in the obese monkeys. Conversely, the levels of most PE species were obviously reduced in the obese monkeys.
Conclusion: Collectively, our work suggests that lipids such as FFA C16:0 and 16:0-LPA may be potential candidates for the diagnosis and study of obesity-related diseases.
Keywords: Obesity; Palmitic acid (C16:0); Plasma lipidome; Rhesus monkeys.
Conflict of interest statement
Ethics approval and consent to participate
All animal procedures were in strict accordance with the guidelines for the National Care and Use of Animals approved by the National Animal Research Authority (P.R. China) and the Institutional Animal Care and Use Committee (IACUC) of the Kunming Institute of Zoology of Chinese Academy of Sciences. The nonhuman primate cares and experimental protocols were approved by the Ethics Committee of Kunming Institute of Zoology and the Kunming Primate Research Center, Chinese Academy of Sciences (AAALAC accredited), and the methods were carried out in accordance with the approved guidelines.
Consent for publication
Not applicable.
Competing interests
The authors declare that they have no competing interests.
Publisher’s Note
Springer Nature remains neutral with regard to jurisdictional claims in published maps and institutional affiliations.
Figures


Similar articles
-
Phenylmethanesulfonyl fluoride pretreatment stabilizes plasma lipidome in lipidomic and metabolomic analysis.Anal Chim Acta. 2015 Sep 17;893:77-83. doi: 10.1016/j.aca.2015.08.049. Epub 2015 Sep 3. Anal Chim Acta. 2015. PMID: 26398425
-
Development of lipidomic platform and phosphatidylcholine retention time index for lipid profiling of rosuvastatin treated human plasma.J Chromatogr B Analyt Technol Biomed Life Sci. 2014 Jan 1;944:157-65. doi: 10.1016/j.jchromb.2013.10.029. Epub 2013 Oct 26. J Chromatogr B Analyt Technol Biomed Life Sci. 2014. PMID: 24316528
-
Alterations of plasma glycerophospholipid and sphingolipid species in male alcohol-dependent patients.Biochim Biophys Acta. 2015 Nov;1851(11):1501-10. doi: 10.1016/j.bbalip.2015.08.005. Epub 2015 Aug 17. Biochim Biophys Acta. 2015. PMID: 26291032
-
Lipidomics as a principal tool for advancing biomedical research.J Genet Genomics. 2013 Aug 20;40(8):375-90. doi: 10.1016/j.jgg.2013.06.007. Epub 2013 Jul 12. J Genet Genomics. 2013. PMID: 23969247 Review.
-
Serum phospholipids during aging: A comprehensive systematic review of cross-sectional and case-control studies.Health Promot Perspect. 2025 May 6;15(1):23-36. doi: 10.34172/hpp.025.42914. eCollection 2025 May. Health Promot Perspect. 2025. PMID: 40453687 Free PMC article. Review.
Cited by
-
Unraveling the impact of hyperleptinemia on female reproduction: insights from transgenic pig model.Biol Res. 2024 Sep 4;57(1):60. doi: 10.1186/s40659-024-00545-7. Biol Res. 2024. PMID: 39227998 Free PMC article.
-
Advances in Research on Diabetes by Human Nutriomics.Int J Mol Sci. 2019 Oct 29;20(21):5375. doi: 10.3390/ijms20215375. Int J Mol Sci. 2019. PMID: 31671732 Free PMC article. Review.
-
Current Treatment Regimens and Promising Molecular Therapies for Chronic Hepatobiliary Diseases.Biomolecules. 2025 Jan 14;15(1):121. doi: 10.3390/biom15010121. Biomolecules. 2025. PMID: 39858515 Free PMC article. Review.
-
Progress in the Study of Animal Models of Metabolic Dysfunction-Associated Steatotic Liver Disease.Nutrients. 2024 Sep 15;16(18):3120. doi: 10.3390/nu16183120. Nutrients. 2024. PMID: 39339720 Free PMC article. Review.
-
Age-related differences in immune dynamics during SARS-CoV-2 infection in rhesus macaques.Life Sci Alliance. 2022 Jan 17;5(4):e202101314. doi: 10.26508/lsa.202101314. Print 2022 Apr. Life Sci Alliance. 2022. PMID: 35039442 Free PMC article.
References
-
- Day C, Bailey CJ. Obesity in the pathogenesis of type 2 diabetes. The British Journal of Diabetes & Vascular Disease. 2011;11:55–61. doi: 10.1177/1474651411407418. - DOI
MeSH terms
Substances
Grants and funding
LinkOut - more resources
Full Text Sources
Medical
Research Materials
Miscellaneous
