. 2019 Jan 8;9(1):2.
doi: 10.1186/s13395-018-0186-6.

Open-CSAM, a new tool for semi-automated analysis of myofiber cross-sectional area in regenerating adult skeletal muscle

Affiliations

Open-CSAM, a new tool for semi-automated analysis of myofiber cross-sectional area in regenerating adult skeletal muscle

Thibaut Desgeorges et al. Skelet Muscle. .

Abstract

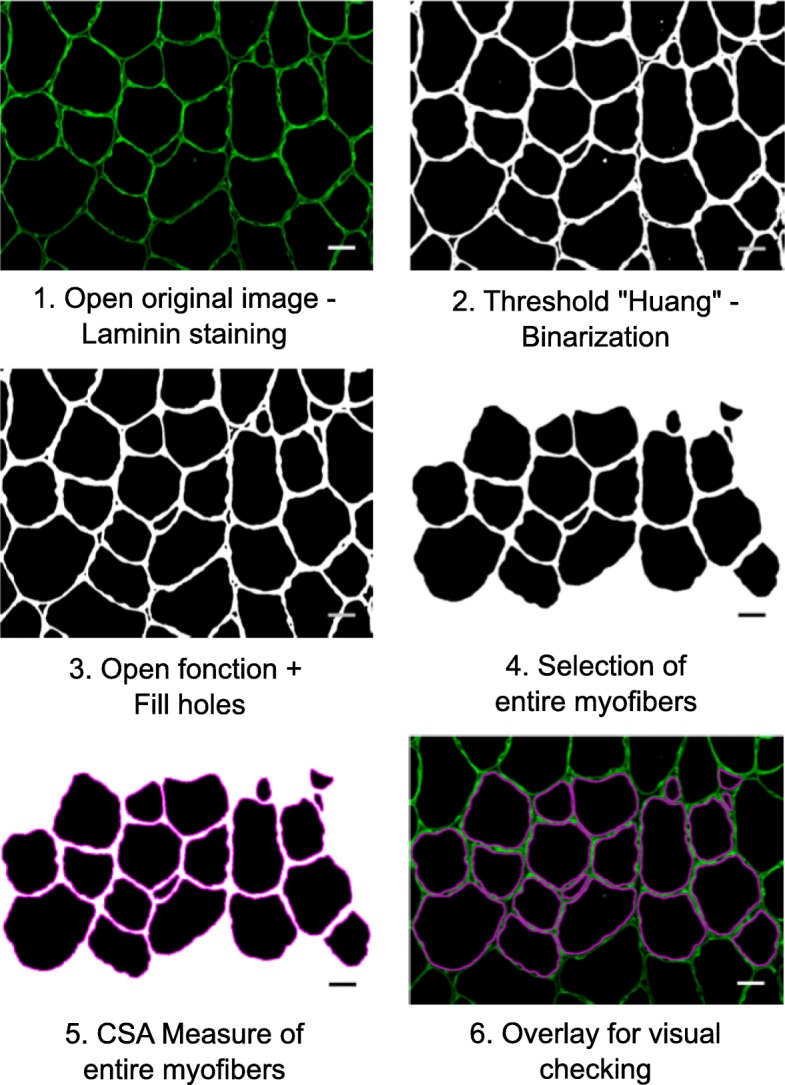
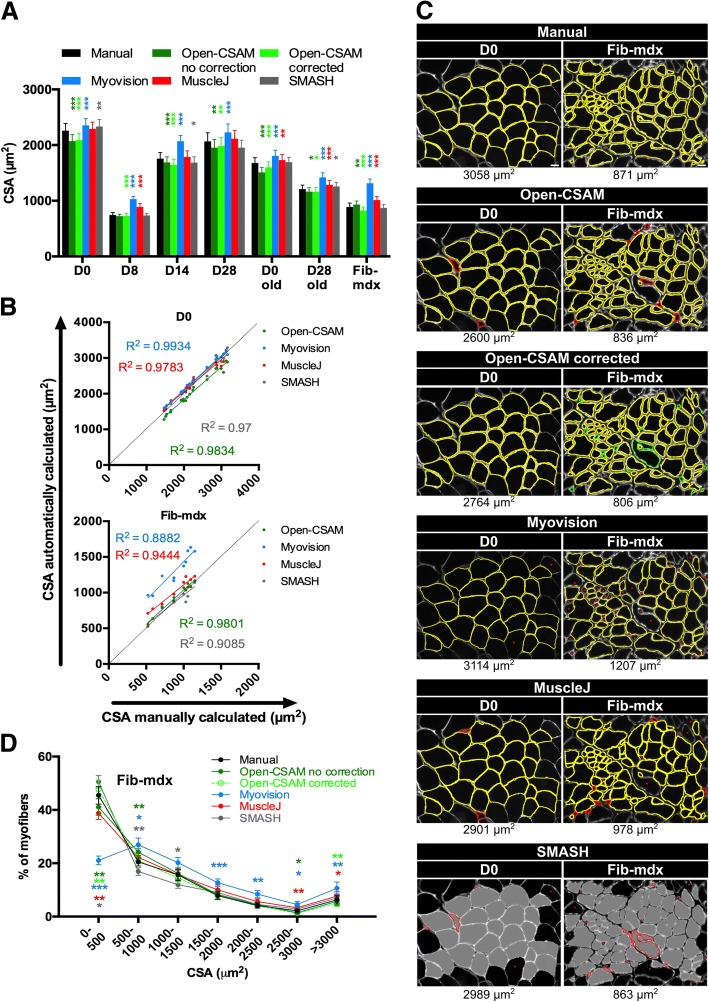
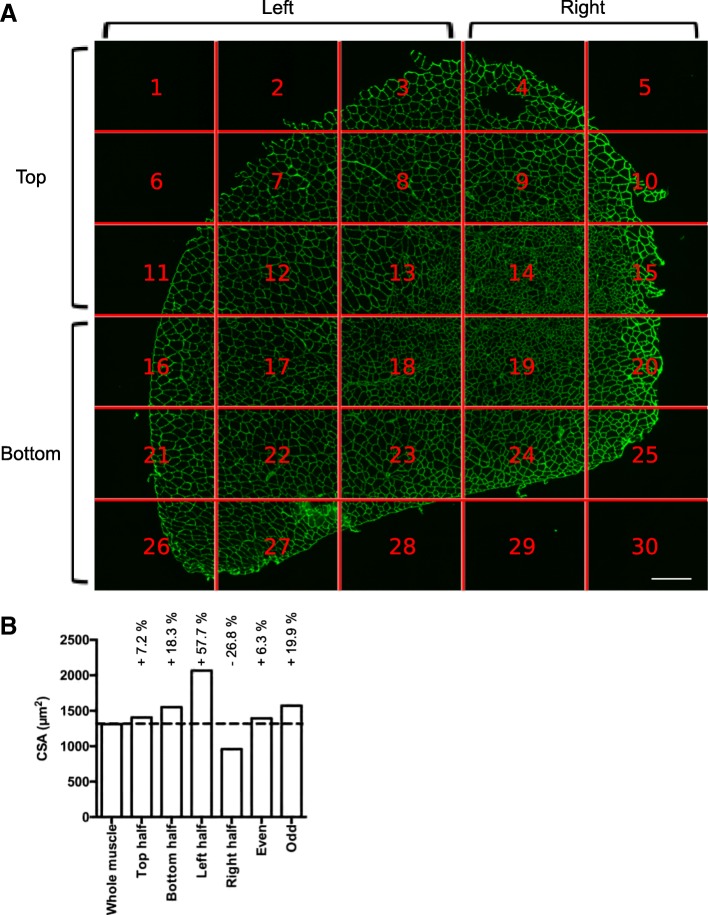
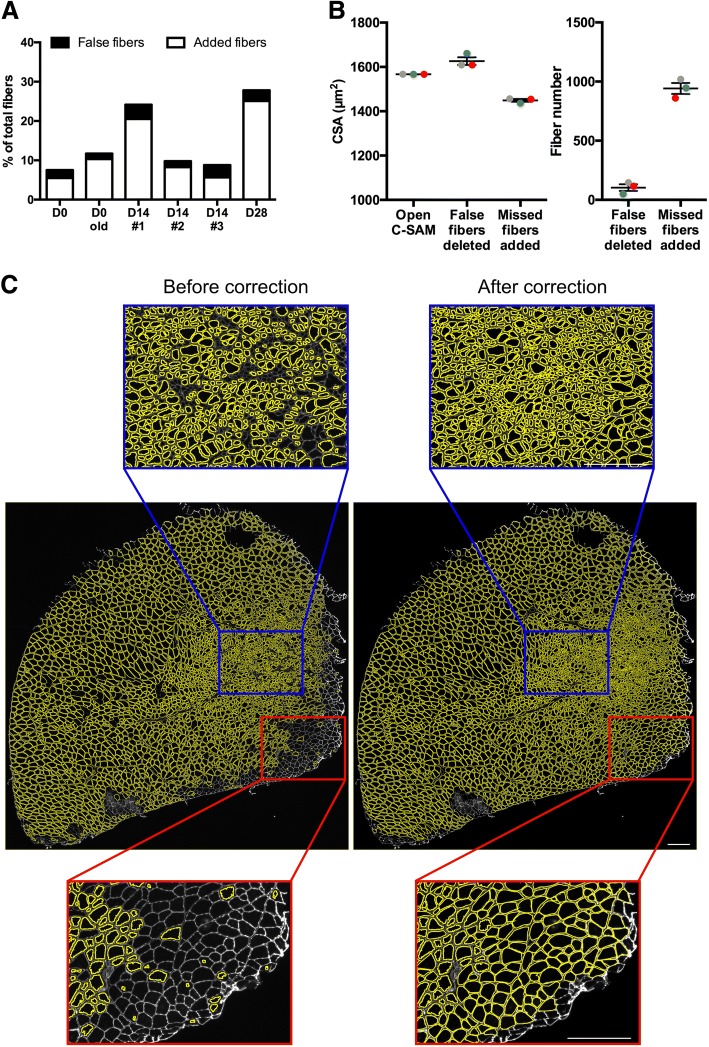
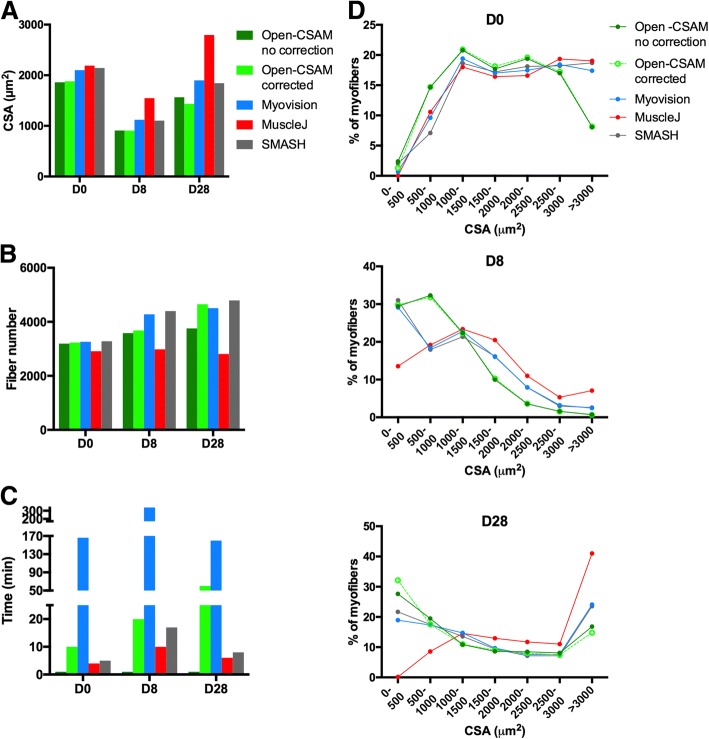
Adult skeletal muscle is capable of complete regeneration after an acute injury. The main parameter studied to assess muscle regeneration efficacy is the cross-sectional area (CSA) of the myofibers as myofiber size correlates with muscle force. CSA analysis can be time-consuming and may trigger variability in the results when performed manually. This is why programs were developed to completely automate the analysis of the CSA, such as SMASH, MyoVision, or MuscleJ softwares. Although these softwares are efficient to measure CSA on normal or hypertrophic/atrophic muscle, they fail to efficiently measure CSA on regenerating muscles. We developed Open-CSAM, an ImageJ macro, to perform a high throughput semi-automated analysis of CSA on skeletal muscle from various experimental conditions. The macro allows the experimenter to adjust the analysis and correct the mistakes done by the automation, which is not possible with fully automated programs. We showed that Open-CSAM was more accurate to measure CSA in regenerating and dystrophic muscles as compared with SMASH, MyoVision, and MuscleJ softwares and that the inter-experimenter variability was negligible. We also showed that, to obtain a representative CSA measurement, it was necessary to analyze the whole muscle section and not randomly selected pictures, a process that was easily and accurately be performed using Open-CSAM. To conclude, we show here an easy and experimenter-controlled tool to measure CSA in muscles from any experimental condition, including regenerating muscle.


Conflict of interest statement

Ethics approval and consent to participate

N/A

Consent for publication

N/A

Competing interests

The authors declare that they have no competing interests.

Publisher’s Note

Springer Nature remains neutral with regard to jurisdictional claims in published maps and institutional affiliations.

Figures

Fig. 1
Fig. 1
Open-CSAM workflow. Step 1: When the macro starts, a window automatically opens to select the image to be analyzed (here muscle cryosections immunostained for laminin). Step 2: Open-CSAM applies the ImageJ threshold “Huang” on the image. Huang threshold was chosen by empiric assays. Threshold application allows image binarization. Step 3: open function allows to adjust the myofiber contours. Myofibers are filled by the function “fill holes.” Step 4: Only the entire myofibers are selected to be analyzed. Other selected parameters as circularity and the size are used to avoid the inclusion of too many false myofibers. Step 5: The area of the selected myofibers is measured. Step 6: At the end of the measurement, all the region of interests (ROI, here the myofibers) are automatically superimposed for visual checking. It is then possible to manually delete or add new myofibers. Bars = 25 μm
Fig. 2
Fig. 2
Open-CSAM comparison with MyoVision, MuscleJ, and SMASH softwares. The same pictures were analyzed either by manual measurement or using Open-CSAM (with or without manual correction), MyoVision, MuscleJ, or SMASH softwares. a Mean cross-section area (CSA) obtained on various Tibialis Anterior (TA) muscles. Muscles were isolated from 8- to 12-week-old mice uninjured (D0) or 8 days (D8), 14 days (D14), and 28 days (D28) post-cardiotoxin (CTX) injury, from 2-year-old mice uninjured (D0 old) or 28 days post-CTX injury (D28 old) and from dystrophic fibrotic mice (Fib-mdx). Results are mean ± SEM of 10 images from 2 muscles (Fib-mdx), 20 images from 2 muscles (D0 and D0 old), 30 images from 3 muscles (D28 and D28 old), 40 images from 4 muscles (D8), and 45 images from 4 muscles (D14). b Correlation between manual measurement (X axis) and Open-CSAM (without manual correction), MyoVision, MuscleJ, or SMASH (Y axis) measurements performed on the same images used in a. Each dot represents a picture. The dotted line represents the identity line. c Representative images measured manually, by Open-CSAM (before and after correction), MyoVision, MuscleJ, or SMASH softwares. Red fibers were false myofibers identified by the softwares, and green fibers were myofibers not considered by the Open-CSAM software and manually drawn. Lacking myofibers using MyoVision, MuscleJ, or SMASH softwares are shown by red asterisks. d Distribution of the CSA obtained with the six methods using the Fib-mdx samples used in a. Results are mean ± SEM of 10 images from 2 muscles (Fib-mdx). White bar = 25 μm. *p < 0.05, **p < 0.01, and ***p < 0.001 as compared with manual quantification
Fig. 3
Fig. 3
Whole muscle analysis by Open-CSAM. a Whole reconstitution of a laminin-stained cryosection of a TA muscle 28 days post-CTX injury (30 pictures were automatically recorded and assembled by MetaMorph software). The position of each individual image is highlighted by the red lines. White bar = 250 μm. b Mean cross-section area obtained after various subsettings of pictures in a
Fig. 4
Fig. 4
Manual corrections after Open-CSAM analysis. a Percentage of false myofibers detected (black histograms) and missed myofibers (white histograms) by Open-CSAM that needed manual correction for TA muscles from young and old uninjured mice as well as from 3 muscles analyzed 14 days post-CTX injury. b, c Open-CSAM analysis of a TA muscle 28 days post-CTX injury. b CSA (left graph) and number of fibers manually corrected (right graph) after analysis by Open-CSAM by three different users (each color represents a single user). c Whole image of the TA muscle analyzed in b showing myofibers (yellow) detected by Open-CSAM before (left panel) and after (right panel) manual correction. Blue and red boxes represent zoom-in examples of two specific areas that needed extensive manual correction. White bar = 250 μm
Fig. 5
Fig. 5
Comparison of Open-CSAM, MyoVision, MuscleJ, and SMASH CSA quantification on whole muscle sections. CSA was measured using Open-CSAM (with or without manual correction), MyoVision, MuscleJ, or SMASH on whole TA muscle images obtained from uninjured (D0) or 8 days (D8) and 28 days (D28) post-CTX injury. a Mean CSA measured by the different softwares. b Number of fibers identified by the softwares. c Total analysis time required by the softwares. d Distribution of CSA obtained by the five methods on D0 (top graph), D8 (middle graph), and D28 (bottom graph) whole muscles

References

    1. Yin H, Price F, Rudnicki MA. Satellite cells and the muscle stem cell niche. Physiol Rev. 2013;93:23–67. doi: 10.1152/physrev.00043.2011. - DOI - PMC - PubMed
    1. Wen Y, Murach KA, Vechetti IJ, Jr, Fry CS, Vickery C, Peterson CA, et al. MyoVision: software for automated high-content analysis of skeletal muscle immunohistochemistry. J Appl Physiol. 2018;124:40–51. doi: 10.1152/japplphysiol.00762.2017. - DOI - PMC - PubMed
    1. Miazaki M, Viana MP, Yang Z, Comin CH, Wang Y, Costa L d F, et al. Automated high-content morphological analysis of muscle fiber histology. Comput Biol Med. 2015;63:28–35. doi: 10.1016/j.compbiomed.2015.04.020. - DOI - PMC - PubMed
    1. Liu F, Fry CS, Mula J, Jackson JR, Lee JD, Peterson CA, et al. Automated fiber-type-specific cross-sectional area assessment and myonuclei counting in skeletal muscle. J Appl Physiol. 2013;115:1714–1724. doi: 10.1152/japplphysiol.00848.2013. - DOI - PMC - PubMed
    1. Kostrominova TY, Reiner DS, Haas RH, Ingermanson R, McDonough PM. Automated methods for the analysis of skeletal muscle fiber size and metabolic type. Int Rev Cell Mol Biol. 2013;306:275–332. - PubMed

Publication types