Clinical Trial
. 2019 Apr;9(4):510-525.
doi: 10.1158/2159-8290.CD-18-0957. Epub 2019 Jan 8.

Transcriptomic Profiling of the Tumor Microenvironment Reveals Distinct Subgroups of Clear Cell Renal Cell Cancer: Data from a Randomized Phase III Trial

Affiliations
Clinical Trial

Transcriptomic Profiling of the Tumor Microenvironment Reveals Distinct Subgroups of Clear Cell Renal Cell Cancer: Data from a Randomized Phase III Trial

A Ari Hakimi et al. Cancer Discov. 2019 Apr.

Abstract

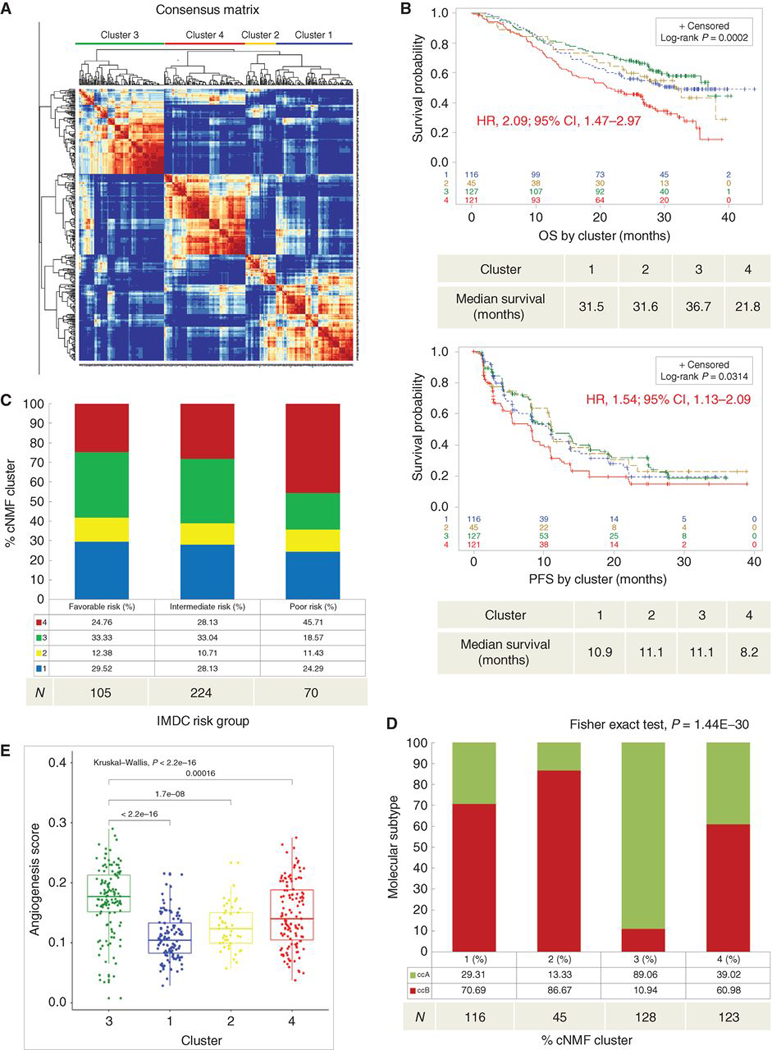
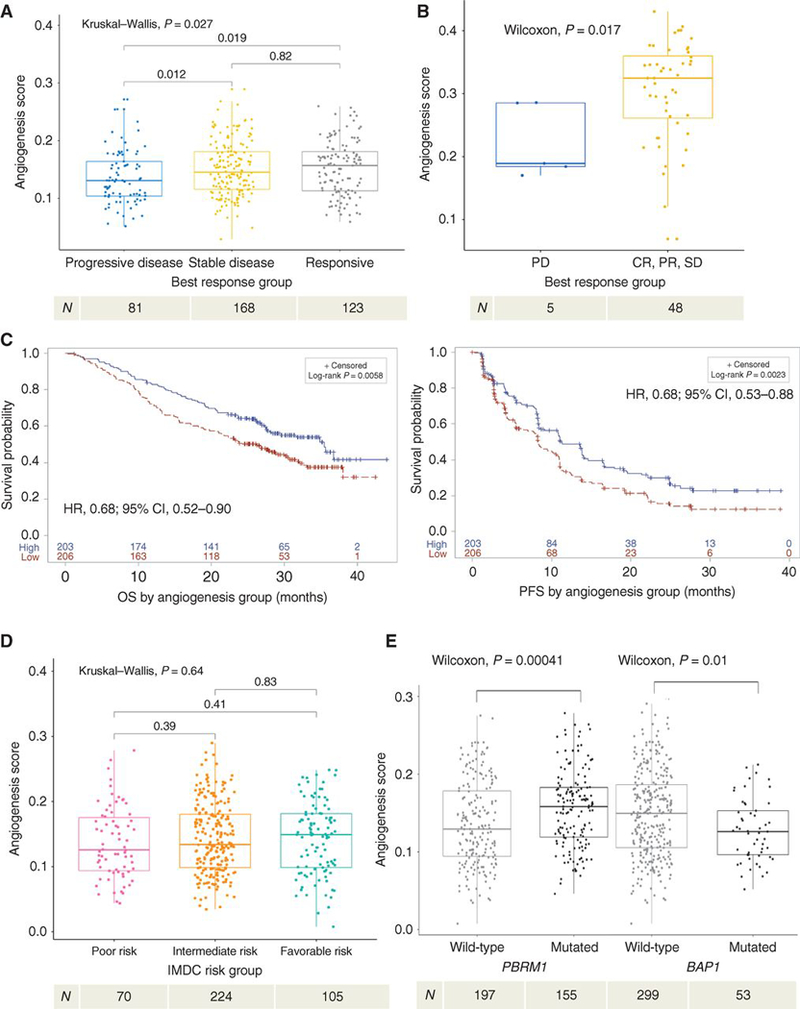
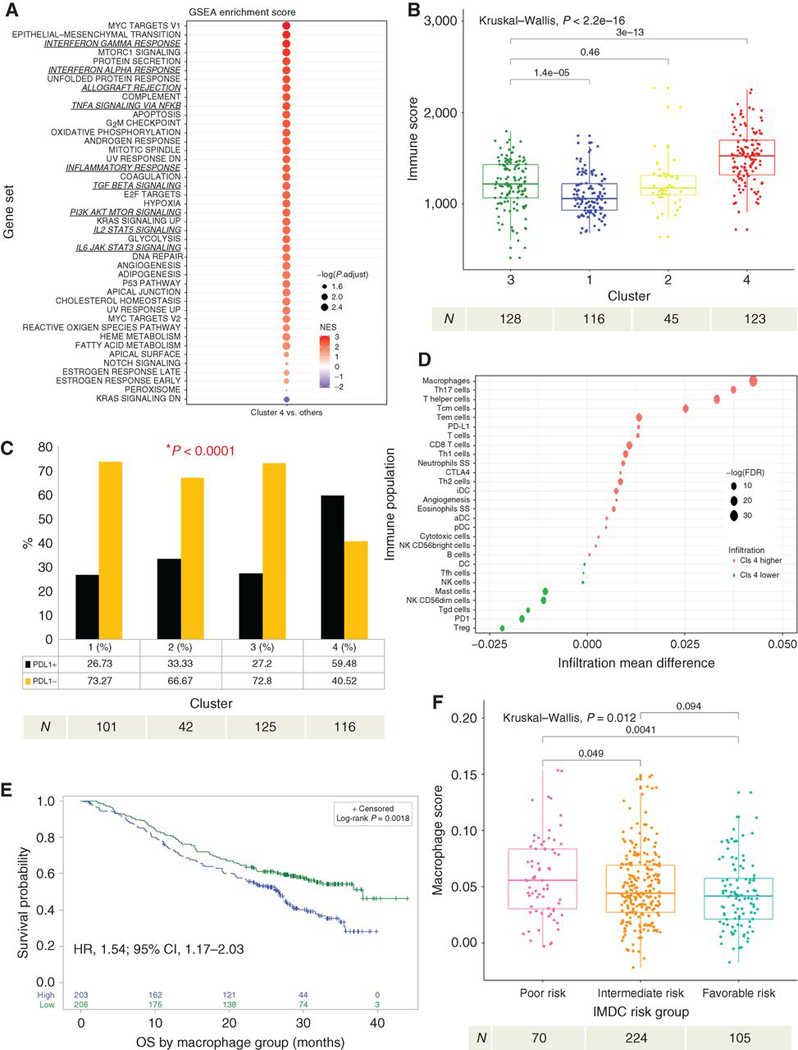
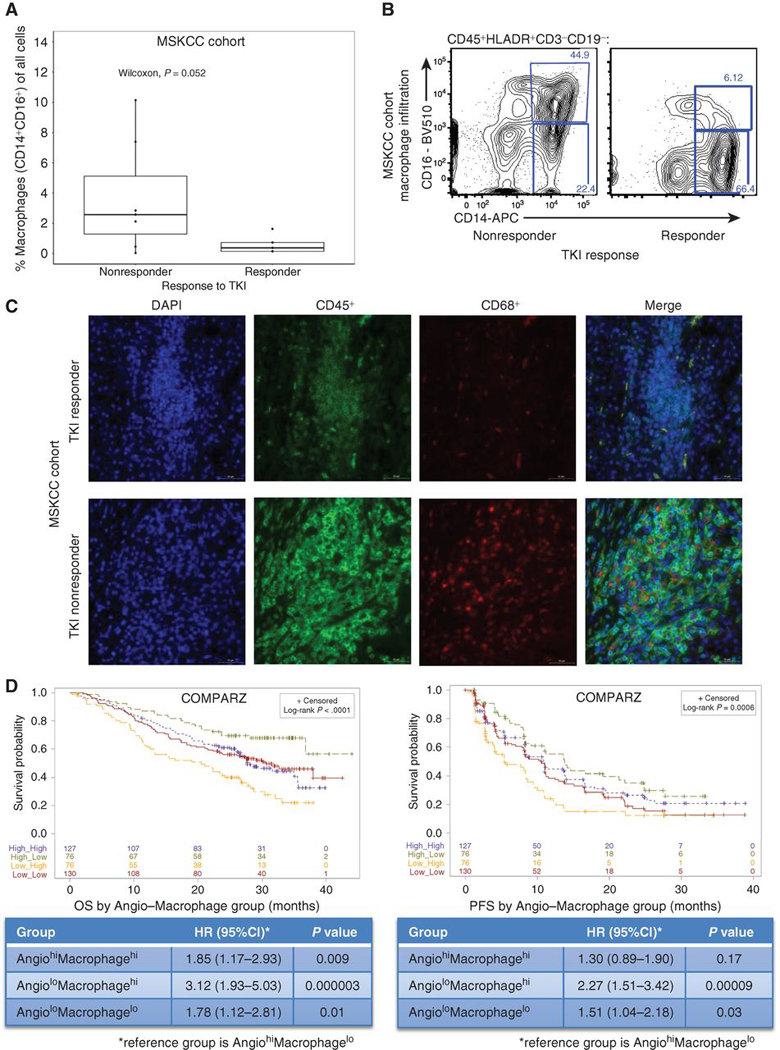
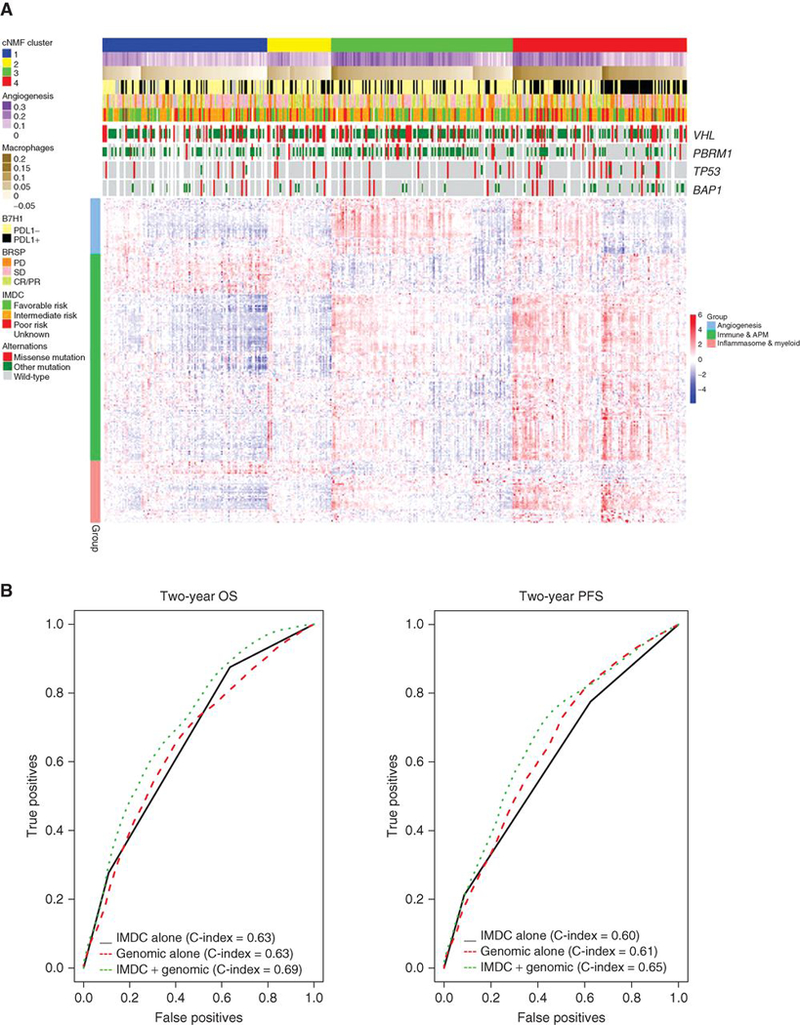
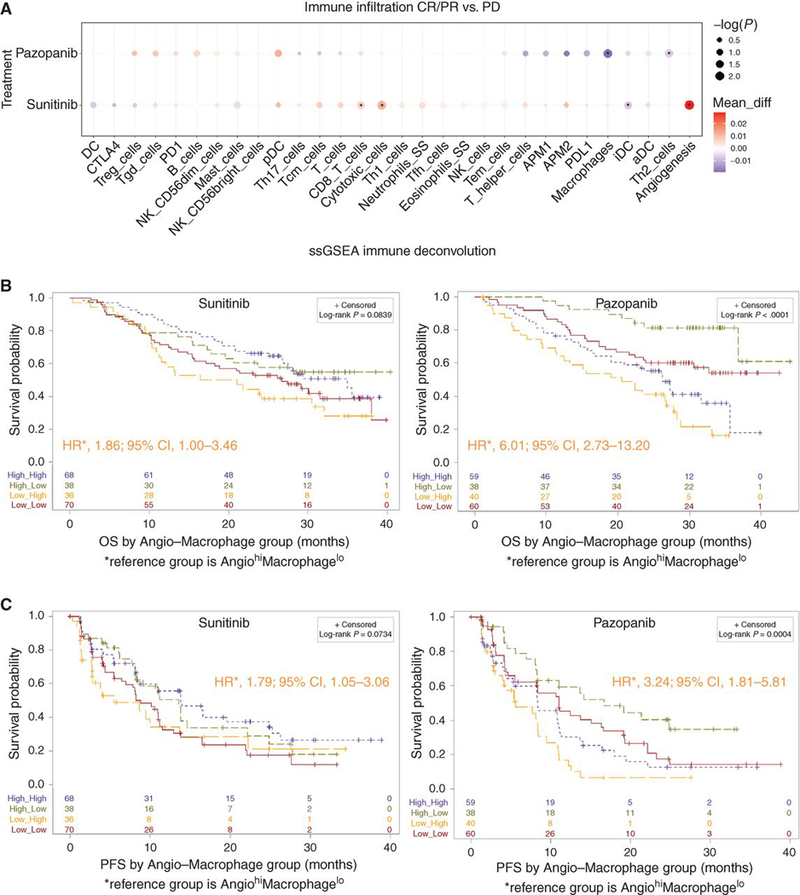
Metastasis remains the main reason for renal cell carcinoma (RCC)-associated mortality. Tyrosine kinase inhibitors (TKI) impart clinical benefit for most patients with RCC, but the determinants of response are poorly understood. We report an integrated genomic and transcriptomic analysis of patients with metastatic clear cell RCC (ccRCC) treated with TKI therapy and identify predictors of response. Patients in the COMPARZ phase III trial received first-line sunitinib or pazopanib with comparable efficacy. RNA-based analyses revealed four distinct molecular subgroups associated with response and survival. Characterization of these subgroups identified mutation profiles, angiogenesis, and macrophage infiltration programs to be powerful predictors of outcome with TKI therapy. Notably, predictors differed by the type of TKI received. Our study emphasizes the clinical significance of angiogenesis and immune tumor microenvironment and suggests that the critical effects its various aspects have on TKI efficacy vary by agent. This has broad implications for optimizing precision treatment of RCC. SIGNIFICANCE: The determinants of response to TKI therapy in metastatic ccRCC remain unknown. Our study demonstrates that key angiogenic and immune profiles of the tumor microenvironment may affect TKI response. These findings have the potential to inform treatment personalization in patients with RCC.This article is highlighted in the In This Issue feature, p. 453.


Figures

Figure 1.
Figure 1.. Consensus NMF clustering identifies four biologically distinct clusters associated with different survival outcomes after TKI therapy.
(a) Unsupervised cNMF clustering from 412 patients identified four robust clusters based on the 1500 most variable annotated genes. (b) Kaplan-Meier curves depict OS (upper) and PFS (lower) by cluster. Censored data are indicated by vertical tick marks in the curves. All P values are calculated by log-rank test. HR and CI values for OS and PFS were extracted from Cox proportional hazard regression models comparing cluster 4 (worst survival) to cluster 3 (best survival). (b-e) Sample number per group indicated below each graph. (c) Describes the percent distribution of clusters within IMDC risk groups. (d) Describes the percent distribution of ClearCode34 ccRCC molecular subtype within each cluster. (e) Comparison of angiogenesis scores across clusters. TKI, tyrosine kinase inhibitor; cNMF, consensus nonnegative matrix factorization; OS, overall survival; PFS, Progression-free survival; HR, hazard ratio; CI, confidence interval; IMDC, International Renal Cell Carcinoma Database Consortium.
Figure 2.
Figure 2.. High angiogenesis gene expression is associated with improved TKI response and survival.
(a) Demonstrates objective response, by RECIST 1.0, to TKI therapy based on angiogenesis score. (b) Beuselinck cohort validation of objective response, by RECIST 1.0, to TKI therapy based on angiogenesis score. (c) Kaplan-Meier analyses demonstrating the impact of angiogenesis gene expression (Angiohigh vs Angiolow, based on median score) on OS (left) and PFS (right) among all patients in COMPARZ. (d) Demonstrates angiogenesis score by IMDC risk group. (e) Demonstrates angiogenesis score by mutation status of PBRM1 and BAP1. TKI, tyrosine kinase inhibitor; OS, overall survival; PFS, progression-free survival; IMDC, International Renal Cell Carcinoma Database Consortium; HR, hazard ratio; CI, confidence interval. All HR and CI values for PFS and OS were extracted from Cox proportional hazard regression models. Sample number per group indicated below each graph. RECIST 1.0 objective response is categorized as: PD, progressive disease; CR, complete response; PR, partial response; or SD, stable disease.
Figure 3.
Figure 3.. Cluster 4 demonstrates enrichment in inflammatory pathways and macrophage infiltration.
(a) GSEA analysis of hallmark gene sets comparing cluster 4 vs clusters 1–3. Enrichment scores are ranked and colored based on the NES and sized by the log10 transformed value of the adjusted p-value. (b) Demonstrates a comparison ofESTIMATE Immune Score within each cluster. (c) Demonstrates differences in the proportion of overall PD-L1 tumoral positivity by IHC in each cluster. P-value was derived using the Fisher’s Exact test. (d) Demonstrates ssGSEA immune deconvolution of cluster 4 versus clusters 1–3 with the mean infiltration differences noted on the x-axis and specific immune populations on the y-axis. The size of the circles represents the log of the FDR and color represents the directionality of the association. (e) Kaplan-Meier analysis demonstrating the impact of macrophage infiltration (Macrophagehigh vs Macrophagelow, based on median score) on OS among all patients in COMPARZ. (f) Demonstrates differences in macrophage infiltration by IMDC risk group. NES, normalized enrichment score; OS, overall survival; PFS, progression-free survival; GSEA, gene set enrichment analyses; ssGSEA, single sample GSEA; IHC, immunohistochemistry; FDR, false discovery rate; HR, hazard ratio; CI, confidence interval; IMDC, International Renal Cell Carcinoma Database Consortium. All HR and CI values for OS were extracted from Cox proportional hazard regression models. Sample number per group indicated below each graph.
Figure 4.
Figure 4.. IHC and IF validation of TKI response and macrophage infiltration.
(a) Demonstrates macrophage infiltration (CD16+CD14+) by TKI response (responder defined as time to treatment failure of > 6 months vs ≤ 6 months for non-responders) in the MSKCC cohort. (b) Representative flow cytometry results demonstrating higher macrophage (CD16+CD14+) infiltration in a TKI non-responder versus responder in the MSKCC cohort. (c) Representative immunofluorescence demonstrating the difference in overall immune (CD45+) and macrophage infiltration (CD68+) in a TKI non-responder (RCC540) and responder (RCC563) in the MSKCC cohort. (d) Kaplan-Meier analyses demonstrating the impact of angiogenesis and macrophage score grouping on OS (left) and PFS (right) among all patients in COMPARZ. TKI, tyrosine kinase inhibitor; IF, immunofluorescence; IHC, immunohistochemistry; OS, overall survival; PFS, progression-free survival; HR, hazard ratio; CI, confidence interval. All HR and CI values for PFS and OS were extracted from Cox proportional hazard regression models.
Figure 5.
Figure 5.. Summary oncoprint highlights the immune infiltration within cluster 4 compared to others and combininggenomic markers with IMDC improves survival prediction.
(a) (Upper heat map) Angiogenesis and macrophage scores, PD-L1 tumoral expression positivity by IHC, mutational status, the best response to TKI therapy by RECIST 1.0, IMDC and mutational status by cluster. (Lower heat map) Demonstrates angiogenesis, immune and antigen presenting machinery (APM), and inflammasome and myeloid gene expression differences by cluster. (b) Demonstrates multivariable model and c-index with the addition of genomic markers for OS (left) and PFS (right). OS, overall survival; PFS, Progression-free survival; IMDC, International Renal Cell Carcinoma Database Consortium; HR, Hazard Ratio; IHC, immunohistochemistry. RECIST 1.0 objective response is categorized as: PD, progressive disease; CR, complete response; PR, partial response; or SD, stable disease.
Figure 6.
Figure 6.. Immune infiltration differences and TKI response differ by specific type of TKI received.
(a) Demonstrates differences in angiogenesis and immune infiltration by drug (sunitinib vs pazopanib) and response to therapy (CR/PR vs PD) where the x-axis demonstrates specific immune cell populations, differences in infiltration within each drug category are represented by the size (log10 transformed nominal p-value) and color (difference in mean ssGSEA score) of the circles; asterisks represent significant differences in infiltration between drug categories (p<0.05). (b) Kaplan-Meier analyses demonstrating the impact of angiogenesis and macrophage scores (Angiogenesishigh/lowMacrophagehigh/low, relative to the median) on OS among patients treated with sunitinib (left) and pazopanib (right). (c) Kaplan-Meier analyses demonstrating the impact of angiogenesis and macrophage scores (Angiogenesishigh/lowMacrophagehigh/low, relative to the median) on PFS among patients treated with sunitinib (left) and pazopanib (right). TKI, tyrosine kinase inhibitor; ssGSEA, single sample Gene Set Enrichment Analyses; OS, overall survival; PFS, Progression-free survival; HR, hazard ratio; CI, confidence interval. All HR and CI values for PFS and OS were extracted from Cox proportional hazard regression models. RECIST 1.0 objective response is categorized as: PD, progressive disease; CR, complete response; PR, partial response; or SD, stable disease.

Comment in

References

    1. Choueiri TK, Motzer RJ. Systemic Therapy for Metastatic Renal-Cell Carcinoma. The New England journal of medicine 2017;376(4):354–66 doi 10.1056/NEJMra1601333. - DOI - PubMed
    1. Gore ME, Larkin JM. Challenges and opportunities for converting renal cell carcinoma into a chronic disease with targeted therapies. British journal of cancer 2011;104(3):399–406 doi 10.1038/sj.bjc.6606084. - DOI - PMC - PubMed
    1. Brugarolas J Molecular genetics of clear-cell renal cell carcinoma. Journal of clinical oncology : official journal of the American Society of Clinical Oncology 2014;32(18):1968–76 doi 10.1200/jco.2012.45.2003. - DOI - PMC - PubMed
    1. Comprehensive molecular characterization of clear cell renal cell carcinoma. Nature 2013;499(7456):43–9 doi 10.1038/nature12222. - DOI - PMC - PubMed
    1. Hsieh JJ, Chen D, Wang PI, Marker M, Redzematovic A, Chen YB, et al. Genomic Biomarkers of a Randomized Trial Comparing First-line Everolimus and Sunitinib in Patients with Metastatic Renal Cell Carcinoma. European urology 2017;71(3):405–14 doi 10.1016/j.eururo.2016.10.007. - DOI - PMC - PubMed

Publication types

LinkOut - more resources