. 2019 Jan 22;116(4):1447-1456.
doi: 10.1073/pnas.1801480116. Epub 2019 Jan 8.

Clonal-level lineage commitment pathways of hematopoietic stem cells in vivo

Affiliations

Clonal-level lineage commitment pathways of hematopoietic stem cells in vivo

Rong Lu et al. Proc Natl Acad Sci U S A. .

Abstract

While the aggregate differentiation of the hematopoietic stem cell (HSC) population has been extensively studied, little is known about the lineage commitment process of individual HSC clones. Here, we provide lineage commitment maps of HSC clones under homeostasis and after perturbations of the endogenous hematopoietic system. Under homeostasis, all donor-derived HSC clones regenerate blood homogeneously throughout all measured stages and lineages of hematopoiesis. In contrast, after the hematopoietic system has been perturbed by irradiation or by an antagonistic anti-ckit antibody, only a small fraction of donor-derived HSC clones differentiate. Some of these clones dominantly expand and exhibit lineage bias. We identified the cellular origins of clonal dominance and lineage bias and uncovered the lineage commitment pathways that lead HSC clones to different levels of self-renewal and blood production under various transplantation conditions. This study reveals surprising alterations in HSC fate decisions directed by conditioning and identifies the key hematopoiesis stages that may be manipulated to control blood production and balance.

Keywords: clonal tracking; hematopoietic stem cell; lineage commitment; radiation; transplantation preconditioning.


Conflict of interest statement

The authors declare no conflict of interest.

Figures
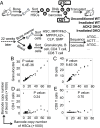
Fig. 1.
Fig. 1.
Comparing clonality of HSCs with clonality of blood cells. (A) Experimental design. Donor HSCs are harvested from the bone marrow and genetically labeled with 33-bp barcodes using a lentiviral vector. Barcoded HSCs are transplanted into WT mice without any conditioning (unconditioned, n = 8), WT mice preconditioned with irradiation (n = 7), Rag2−/−γc−/− (DKO) mice preconditioned with anti-ckit antibody (n = 7), or DKO mice preconditioned with irradiation (n = 10). Twenty-two weeks after transplantation, donor-derived hematopoietic stem/progenitor cells [HSCs, Flk2− multipotent progenitor (MPPFlk2−), Flk2+ multipotent progenitor (MPPFlk2+), GMPs, CLPs], and mature blood cells (granulocyte, B cell, CD4 T cell, and CD8 T cell) are isolated from bone marrow and peripheral blood, respectively. Barcodes are extracted and analyzed as described elsewhere (37). (BE) Barcode copy numbers from HSCs are compared with those from blood cells after unconditioned transplantation. Each dot represents a unique barcode that is used to track a single HSC clone. The x and y axes represent barcode copy numbers of different cell populations. The two-tailed P values of the Pearson correlation are shown to quantify the significance of the linear correlation. These scatter plots depict data from a single representative mouse. Data from all eight mice are shown in SI Appendix, Fig. S1.
Fig. 2.
Fig. 2.
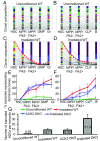
Pretransplantation conditioning induces dominant differentiation of HSC clones. (AD) Clonal compositions at each stage of HSC differentiation. Each column represents a hematopoietic population. Each colored section in a column represents one distinct genetic barcode, corresponding to an HSC clone. The size of each colored section indicates its relative abundance within each cell population. Identical barcodes from different cell populations (columns) are shown in the same color and are connected by lines. Red dotted lines highlight clones that exhibit dominant differentiation in irradiated mice. HSC, Flk2− multipotent progenitor (MPPFlk2−), Flk2+ multipotent progenitor (MPPFlk2+), GMP, CLP, granulocyte (Gr), and B cell (B) are arranged along myeloid differentiation stages (A and C) and lymphoid differentiation stages (B and D). Barcodes are arranged from top to bottom according to their abundances in terminally differentiated cells in the rightmost column of each panel. Shown are data from a WT recipient mouse not treated with any pretransplantation conditioning (A and B) and a WT recipient mouse treated with lethal irradiation before transplantation (C and D). Data from all eight unconditioned mice and seven irradiated mice are shown in SI Appendix, Fig. S2. (E and F) The percentage of barcodes representing dominant clones at each stage of HSC differentiation under various transplantation conditions. Dominant clones are defined as those whose relative copy numbers in blood cells (granulocytes or B cells) are more than five times their relative copy numbers in HSCs. Similar results are obtained when dominant clones are defined by different threshold values (SI Appendix, Fig. S3 A and B). ACK2, a clone of anti-ckit antibody; DKO, Rag2−/−γc−/− mice. (G) Number of harvested barcoded HSCs carrying the same barcode 22 wk after transplantation. GFP+ HSCs are counted as barcoded HSCs at the time of harvest, as GFP is constantly expressed in the barcode vectors. (EG) Error bars show the SEMs for all mice under the same transplantation conditions.
Fig. 3.
Fig. 3.
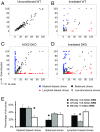
Pretransplantation conditioning induces HSC lineage bias. (AD) Scatter plots comparing barcode copy numbers from granulocytes with barcode copy numbers from B cells in the peripheral blood. Each dot represents a unique barcode that is used to track a single HSC clone. Colors are assigned according to the ratios of the granulocytes’ barcode copy numbers (myeloid lineage) to B cells’ barcode copy numbers (lymphoid lineage). Lineage-biased clones are defined as those whose relative copy numbers in one lineage are more than 2.4142 (cotangent 22.5°) times their relative copy numbers in the other lineage. Low-abundance clones are excluded from the analysis of lineage bias versus balance. These clones are defined as those whose copy numbers are less than 10% of the maximum copy numbers in both lineages. Shown are the barcodes from all mice examined under each condition. Barcode copy numbers are normalized to the most abundant clone in each cell population of each mouse. Mice with insufficient reads (maximum barcode copy number <5,000) or with a low number of barcodes (fewer than three unique barcodes present in granulocytes and B cells) are excluded from these plots. Raw data from all mice are shown individually in SI Appendix, Fig. S4. The percentages of barcodes with distinct lineage bias and balance are summarized in SI Appendix, Fig. S3C. (E) Lineage bias and balance of donor HSCs after various conditions of irradiation-mediated transplantations. Shown are percentages of clones with distinct lineage bias or balance. Lethal irradiation uses 950 cGy and 0.5 million helper cells (whole bone marrow cells, WBM). Half-lethal irradiation uses 475 cGy and 0.5 million helper cells. The “more helper cells” condition uses 5 million helper cells and 950 cGy. Error bars show the SEMs for all mice under the same transplantation conditions. *P < 0.05 by Student’s t test.
Fig. 4.
Fig. 4.
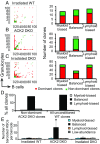
Connections between dominant differentiation and lineage bias. (AC) Dominant clones and nondominant clones are compared by their lineage bias and balance. (AC, Left) Plots are generated as described in the legend for Fig. 3 AD. Colors are assigned according to the ratios of HSC barcode copy numbers to granulocytes and B cells copy numbers. Dominant clones are defined as those whose relative copy numbers in blood cells (granulocytes or B cells) are more than five times their relative copy numbers in HSCs. Similar results are obtained when dominant clones are defined by different threshold values (SI Appendix, Fig. S5). (AC, Right) The number of clones with lineage bias or balance from all mice under the indicated transplantation condition. P value depicts the probability that a given result is caused by dominant or nondominant clones randomly becoming lineage-biased or balanced. (D) Lineage bias and balance of nondominant clones in ACK2-treated Rag2−/−γc−/− mice (DKO) compared with all clones in unconditioned WT mice. (E) Numbers of lineage-biased or balanced barcoded HSCs carrying the same barcode. Data are normalized by lymphoid-biased barcodes of each transplantation condition. GFP+ HSCs are counted as barcoded HSCs at the time of harvest, as GFP is constantly expressed in the barcode vectors. Error bars show the SEMs for all mice under the same transplantation conditions. *P < 0.05 by Student’s t test, ***P < 0.001.
Fig. 5.
Fig. 5.
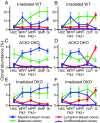
Lineage bias of HSCs is derived from dominant differentiation at distinct lineage commitment steps. (A) Plots were generated as described in the legend for Fig. 2 E and F, except that only myeloid-biased clones (Left) or lymphoid-biased clones (Right) are plotted. Other clones are shown in SI Appendix, Fig. S6. (B) Pie charts illustrate the lineage bias and balance of the clones that expand dominantly from HSC to MPPFlk2− (Upper) or from CLP to B cells (Lower). P value depicts the significance that the clones that dominantly expand during HSC-to-MPPFlk2− commitment become myeloid-biased (Upper) and that the clones that dominantly expand during CLP-to-B-cell commitment become lymphoid-biased (Lower). (C) P value depicts the significance that the lineage bias and balance at the progenitor stages is reflected in blood cells. (B and C) P value is calculated to quantify the probability that the clones are randomly distributed among the different categories of lineage bias and balance. (D) Plots are generated as described in the legend for Fig. 3 AD. Dot colors in all plots are assigned based on the bias between GMPs and CLPs. The dotted lines show the boundary of lineage bias versus balance in blood cells. Analysis based on the lineage bias exhibited in blood cells is shown in SI Appendix, Fig. S7, where dot colors are assigned based on the bias between granulocytes and B cells.
Fig. 6.
Fig. 6.
Lineage commitment of HSC clones with distinct lineage bias and lineage balance. Shown are the average abundance of clones with distinct lineage bias and balance at various stages of HSC differentiation. Clonal abundance here refers to the copy number of a particular barcode as a percentage of all barcode copy numbers from a cell population. (A and B) Irradiated WT mice. (C and D) ACK2-treated Rag2−/−γc−/− mice. (E and F) Irradiated Rag2−/−γc−/− mice. (A, C, and E) Myeloid differentiation toward granulocytes. (B, D, and F) Lymphoid differentiation toward B cells. Error bars show the SEMss for all of the barcodes from mice under the same transplantation conditions. DKO, Rag2−/−γc−/− mice.
Fig. 7.
Fig. 7.
A model of clonal-level lineage commitment pathways of HSCs in vivo. Thicker and ascendant arrows represent dominant differentiation of HSC clones. HSCs transplanted into mice pretreated with different conditioning regimens follow distinct pathways during lineage commitment. These pathways lead to distinct balanced or biased blood production.

References

    1. Bryder D, Rossi DJ, Weissman IL. Hematopoietic stem cells: The paradigmatic tissue-specific stem cell. Am J Pathol. 2006;169:338–346. - PMC - PubMed
    1. Seita J, Weissman IL. Hematopoietic stem cell: Self-renewal versus differentiation. Wiley Interdiscip Rev Syst Biol Med. 2010;2:640–653. - PMC - PubMed
    1. Weissman IL. Stem cells: Units of development, units of regeneration, and units in evolution. Cell. 2000;100:157–168. - PubMed
    1. Kondo M, et al. Cell-fate conversion of lymphoid-committed progenitors by instructive actions of cytokines. Nature. 2000;407:383–386. - PubMed
    1. Rankin EB, et al. The HIF signaling pathway in osteoblasts directly modulates erythropoiesis through the production of EPO. Cell. 2012;149:63–74. - PMC - PubMed

Publication types