. 2018 Dec 21:12:85.
doi: 10.3389/fninf.2018.00085. eCollection 2018.

National Neuroinformatics Framework for Canadian Consortium on Neurodegeneration in Aging (CCNA)

Affiliations

National Neuroinformatics Framework for Canadian Consortium on Neurodegeneration in Aging (CCNA)

Zia Mohaddes et al. Front Neuroinform. .

Abstract

The Canadian Institutes for Health Research (CIHR) launched the "International Collaborative Research Strategy for Alzheimer's Disease" as a signature initiative, focusing on Alzheimer's Disease (AD) and related neurodegenerative disorders (NDDs). The Canadian Consortium for Neurodegeneration and Aging (CCNA) was subsequently established to coordinate and strengthen Canadian research on AD and NDDs. To facilitate this research, CCNA uses LORIS, a modular data management system that integrates acquisition, storage, curation, and dissemination across multiple modalities. Through an unprecedented national collaboration studying various groups of dementia-related diagnoses, CCNA aims to investigate and develop proactive treatment strategies to improve disease prognosis and quality of life of those affected. However, this constitutes a unique technical undertaking, as heterogeneous data collected from sites across Canada must be uniformly organized, stored, and processed in a consistent manner. Currently clinical, neuropsychological, imaging, genomic, and biospecimen data for 509 CCNA subjects have been uploaded to LORIS. In addition, data validation is handled through a number of quality control (QC) measures such as double data entry (DDE), conflict flagging and resolution, imaging protocol checks, and visual imaging quality validation. Site coordinators are also notified of incidental findings found in MRI reads or biosample analyses. Data is then disseminated to CCNA researchers via a web-based Data-Querying Tool (DQT). This paper will detail the wide array of capabilities handled by LORIS for CCNA, aiming to provide the necessary neuroinformatic infrastructure for this nation-wide investigation of healthy and diseased aging.

Keywords: Alzheimer's; database; dementia; infrastructure; neuroimaging.


Figures

Figure 1
Figure 1
CCNA data-upload flow in LORIS. Step 1: Creation and registration of subjects, Step 2: Creation of timepoint and media upload, Step 3: Behavioral data entry and QC, and Step 4: Visit review and data dissemination.
Figure 2
Figure 2
Sample collection and distribution.
Figure 3
Figure 3
Imaging workflow.
Figure 4
Figure 4
Detailed diagram of procedure for incidental findings.
Figure 5
Figure 5
Study Tracker. Each row corresponds to a participant, with each circle in that row corresponding to a visit for that participant. The border color of the circle represents the status of visit registration and the fill indicates data entry completion with respect to the due date. Here the open sidebar has the visit specific view in focus, with links to individual forms as well as links to the Conflict Resolver.
Figure 6
Figure 6
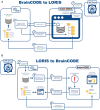
Imaging transfer (A) BrainCODE to LORIS (B) LORIS to BrainCODE.
Figure 7
Figure 7
Biosamples collection forms.
Figure 8
Figure 8
Sample result (extracted from DQT) for the upcoming CCNA release.
Figure 9
Figure 9
Graphs showing overall activity on the Member's Portal over the last year. Signups: accounts added which are imported automatically from the LORIS users list. Topics: number of new support requests. Posts: number of support replies from our user support team. Daily active users/monthly active users (DAU/MAU): number of members that logged in within the last day, divided by number of members that logged in within the last month. Daily Engaged Users: number of users that liked or posted something new per day. New Contributors: number of users that made their first contribution during the indicated period.
Figure 10
Figure 10
Graph representing the number of topics (support requests) created across time between January 1st, 2016 and August 18th, 2018.
Figure 11
Figure 11
Graph representing the longitudinal number of posts (support request replies) between January 1st, 2016 and August 18th, 2018.

References

    1. Belleville S. (2014). Detecting early preclinical Alzheimer's Disease via cognition, neuropsychiatry, and neuroimaging: qualitative review and recommendations for testing. J. Alzheimer Dis. 142:4 10.3233/JAD-141470 - DOI - PubMed
    1. Bennet C. M., Miller M. B. (2010). How reliable are the results from functional magnetic resonance imaging? Ann. N.Y. Acad. Sci. 1191, 133–155. 10.1111/j.1749-6632.2010.05446.x. - DOI - PubMed
    1. Campbell T. (2017). An online training system to enable systematic delivery of study protocols in multisite neuroimaging, in Proceeding of: Organization of Human Brain Mapping (OHBM), Vancouver, BC.
    1. Da Mota B., Tudoran R., Costan A., Varoquaux G., Brasche G., Conrod P., et al. . (2014). Machine learning patterns for neuroimaging-genetic studies in the cloud. Front. Neuroinform. 8:31. 10.3389/fninf.2014.00031 - DOI - PMC - PubMed
    1. Das S., Glatard T., MacIntyre L. C., Madjar C., Rogers C., Rousseau M. E., et al. . (2016). The MNI data-sharing and processing ecosystem. Neuroimage 124:1188–1195. 10.1016/j.neuroimage.2015.08.076 - DOI - PubMed

LinkOut - more resources