. 2018 Nov;10(11):5991-6001.
doi: 10.21037/jtd.2018.10.50.

Distribution of the atypical pathogens of community-acquired pneumonia to disease severity

Affiliations

Distribution of the atypical pathogens of community-acquired pneumonia to disease severity

Cheng Gong et al. J Thorac Dis. 2018 Nov.

Abstract

Background: To investigate the epidemiological characteristics of 11 atypical pathogens of community-acquired pneumonia (CAP) among Chinese, and to determine whether or not there is an association between these pathogens and the severity of illness.

Methods: We conducted a surveillance study for CAP in 30 hospitals of Beijing. Epidemiological data and clinical specimens were systematically collected from enrolled CAP patients. The detection for 11 atypical pathogens [9 respiratory viruses, Mycoplasma pneumoniae (MP) and Chlamydophila pneumoniae (CP)] was performed. Risk factors of severe CAP and death in Hospital were evaluated.

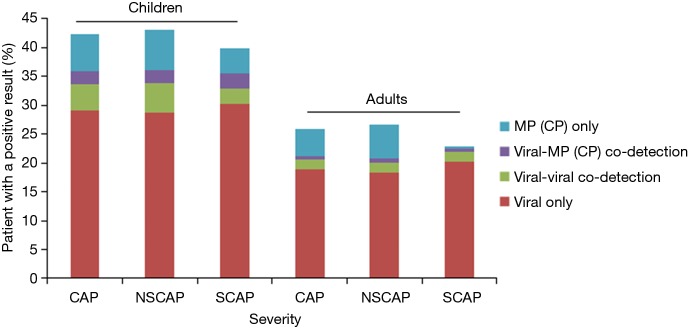
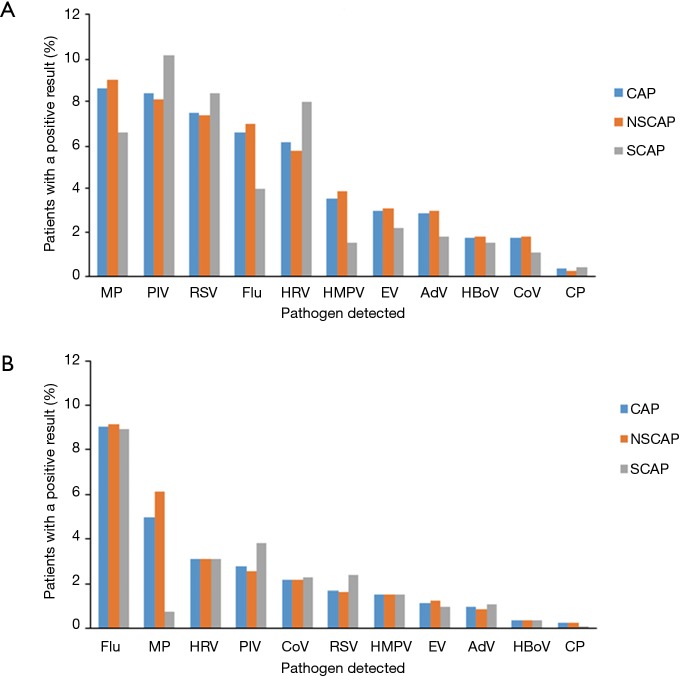
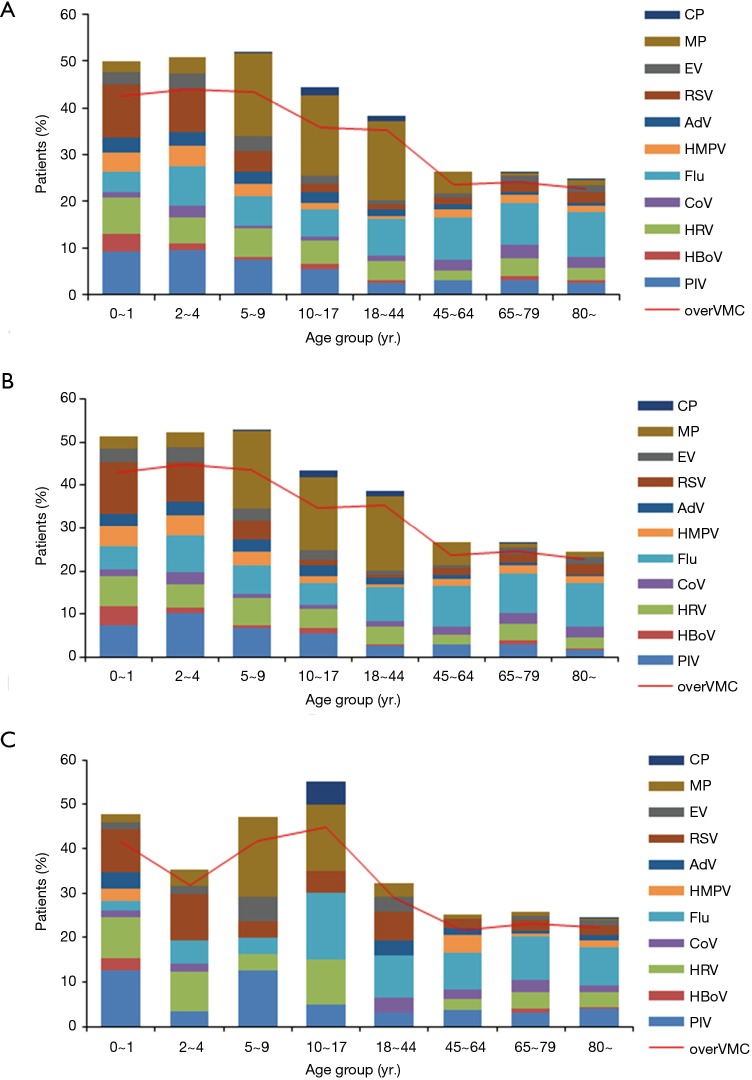
Results: A total of 6,008 CAP patients [including 1,071 severe CAP (SCAP)] were enrolled. The overall detection rate of the 11 atypical pathogens was 42.4% among 1,925 child CAP (39.9% among 274 child SCAP), and 25.8% among 4,083 adult CAP (22.8% among 797 adult SCAP). The most frequent atypical pathogen among child SCAP was parainfluenza virus (10.2%) followed by respiratory syncytial virus (RSV) (8.4%). However, the most frequent atypical pathogen among adult SCAP was influenza virus (8.9%) followed by parainfluenza virus (3.8%). Multivariate analyses showed that the important predictors for SCAP were an age ≤9 years, an age ≥65 years and co-existing diseases. These factors, except an age ≤9 years, were also predictors of death in Hospital. None of these 11 atypical pathogens was included as the risk factors of SCAP or death in Hospital.

Conclusions: Although these 11 atypical pathogens were the common causes of CAP (including SCAP) among Chinese, they were not observed to increase risks for SCAP or death in Hospital.

Keywords: Community-acquired pneumonia (CAP); atypical respiratory pathogen; respiratory pathogen; severe community acquired pneumonia; surveillance.


Conflict of interest statement

Conflicts of Interest: The authors have no conflicts of interest to declare.

Figures

Figure 1
Figure 1
Flow chart of enrollment of CAP patients with radiographic evidence. CAP, community-acquired pneumonia; SCAP, severe CAP.
Figure 2
Figure 2
Distribution of infection types among CAP patients by age group and illness severity. This figure shows the results among 6,008 CAP consisting of 4,937 patients with NSCAP, and 1,071 SCAP obtained from August 1, 2014, through July 31, 2016. CAP, community-acquired pneumonia; NSCAP, non-severe CAP; SCAP, severe CAP.
Figure 3
Figure 3
Percentages of the pathogens detected among (A) child patients and (B) adult patients. Among 6,008 CAP patients who had tests for Mycoplasma pneumoniae, Chlamydophila pneumoniae and viral pathogens. CAP, community-acquired pneumonia; AdV, adenovirus; CoV, coronavirus; Flu, influenza A or B virus; HMPV, human metapneumovirus; HRV, human rhinovirus; PIV, parainfluenza virus; RSV, respiratory syncytial virus; HBoV, human bocavirus; EV, enterovirus; MP, Mycoplasma pneumoniae; CP, Chlamydophila pneumoniae.
Figure 4
Figure 4
Spectrum of pathogens by age group among (A) all CAP patients, (B) NSCAP patients and (C) SCAP patients. Bars indicate the detection yield of each pathogen; line indicates the detection yield of pathogens together. Over VMC stands for the overall positive rate of respiratory viruses, MP and CP, It means the rate of the patients with at least one of 9 respiratory viruses, MP and CP detected. CAP, community-acquired pneumonia; NSCAP, non-severe CAP; SCAP, severe CAP.
Figure 5
Figure 5
Monthly detection of pathogens among the CAP patients detected from August 1, 2014 to July 31, 2016. (A) Monthly detection rate of 9 viruses together among all CAP patients; (B) the frequency of patients in whom parainfluenza virus, human bocavirus, human rhinovirus, coronavirus, influenza virus, and human metapneumovirus were detected; (C) the frequency of patients in whom adenovirus, respiratory syncytial virus, enterovirus, M. pneumoniae, and C. pneumoniae were detected. Note the difference in scale of the y axis for each line graph. CAP, community-acquired pneumonia.

References

    1. Schnoor M, Hedicke J, Dalhoff K, et al. Approaches to estimate the population-based incidence of community acquired pneumonia. J Infect 2007;55:233-9. 10.1016/j.jinf.2007.04.355 - DOI - PubMed
    1. Marston BJ, Plouffe JF, File TM, Jr, et al. Incidence of community-acquired pneumonia requiring Hospitalization. Results of a population-based active surveillance Study in Ohio. The Community-Based Pneumonia Incidence Study Group. Arch Intern Med 1997;157:1709-18. 10.1001/archinte.1997.00440360129015 - DOI - PubMed
    1. Fielden NM. Community-acquired pneumonia. Perspect Respir Nurs 1998;9:1-2, 4, 6 passim. - PubMed
    1. Takaki M, Nakama T, Ishida M, et al. High incidence of community-acquired pneumonia among rapidly aging population in Japan: a prospective Hospital-based surveillance. Jpn J Infect Dis 2014;67:269-75. 10.7883/yoken.67.269 - DOI - PubMed
    1. Jain S, Self WH, Wunderink RG, et al. Community-Acquired Pneumonia Requiring Hospitalization among U.S. Adults. N Engl J Med 2015;373:415-27. 10.1056/NEJMoa1500245 - DOI - PMC - PubMed