. 2019 Aug;17(8):1514-1526.
doi: 10.1111/pbi.13074. Epub 2019 Jan 25.

Metabolic engineering of bread wheat improves grain iron concentration and bioavailability

Affiliations

Metabolic engineering of bread wheat improves grain iron concentration and bioavailability

Jesse T Beasley et al. Plant Biotechnol J. 2019 Aug.

Abstract

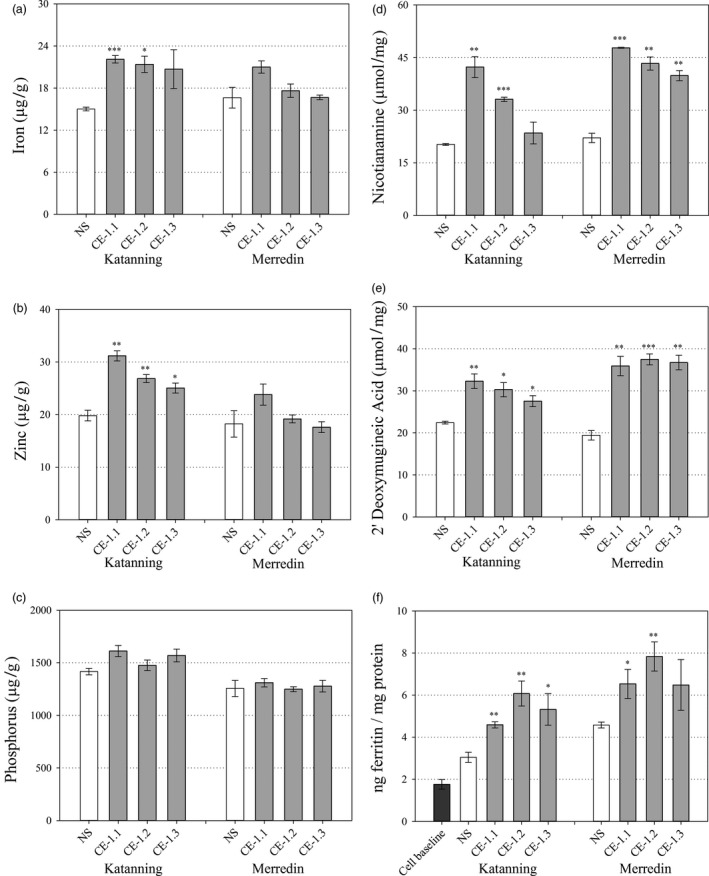
Bread wheat (Triticum aestivum L.) is cultivated on more land than any other crop and produces a fifth of the calories consumed by humans. Wheat endosperm is rich in starch yet contains low concentrations of dietary iron (Fe) and zinc (Zn). Biofortification is a micronutrient intervention aimed at increasing the density and bioavailability of essential vitamins and minerals in staple crops; Fe biofortification of wheat has proved challenging. In this study we employed constitutive expression (CE) of the rice (Oryza sativa L.) nicotianamine synthase 2 (OsNAS2) gene in bread wheat to up-regulate biosynthesis of two low molecular weight metal chelators - nicotianamine (NA) and 2'-deoxymugineic acid (DMA) - that play key roles in metal transport and nutrition. The CE-OsNAS2 plants accumulated higher concentrations of grain Fe, Zn, NA and DMA and synchrotron X-ray fluorescence microscopy (XFM) revealed enhanced localization of Fe and Zn in endosperm and crease tissues, respectively. Iron bioavailability was increased in white flour milled from field-grown CE-OsNAS2 grain and positively correlated with NA and DMA concentrations.

Keywords: 2′-deoxymugineic acid; Caco-2; X-ray fluorescence microscopy; Zinc; biofortification; nicotianamine.


Conflict of interest statement

The authors declare no conflict of interest.

Figures

Figure 1
Figure 1
Generation and characterization of independent bread wheat transformation events constitutively expressing the rice nicotianamine synthase 2 (OsNAS2) gene. (a) Schematic representation of the T‐DNA construct. RB and LB: right and left borders, respectively; UBI‐1: maize ubiquitin 1 promoter; OsNAS2: rice nicotianamine synthase 2 gene (LOC_Os03 g19420); nos‐ter: nopaline synthase terminator; 35S‐pro: dual promoter of 35S cauliflower mosaic virus gene; hyg: hygromycin phosphotransferase gene; 35S‐ter: terminator of 35S cauliflower mosaic virus gene. (b) Southern blot analysis of T1 wheat events to determine T‐DNA insertion number. DraI: restriction endonuclease; + indicates positive control. (c) Representative plants of null segregant (NS) and the 6 transformation events (CE‐OsNAS2) 100 days after sowing. (d–g) Projected shoot area (cm2), plant height (cm), total grain number and thousand grain weight (TGW) of NS (white), leading CE‐OsNAS2 event (CE‐1, orange) and other CE‐OsNAS2 events (grey) at the T1 generation. Bars represent mean ± SEM of at least 7 biological replicates. (h, i) Iron and zinc concentration (μg/g DW) in T2 whole grain of NS, CE‐1 and other CE‐OsNAS2 events. Bars represent mean ± SEM of at least seven biological replicates. (j, k) Relative quantification of OsNAS2 transcript levels in NS and CE‐1 shoots and roots. Bars represent mean ± SEM of three bulked biological replicates, each with three technical replicates of quantitative RT‐PCR. (l) Nicotianamine concentration (μmol/mg) in whole grain of NS and CE‐1 plants at the T2 generation. Bars represent mean ± SEM of three biological replicates. Asterisks denote the significance between NS and CE‐OsNAS2 events for P < 0.05 (*), P ≤ 0.01 (**), P ≤ 0.001 (***) as determined by student's t‐test. Wild‐type plants did not differ from NS plants for any trait measured and therefore only NS data is presented.
Figure 2
Figure 2
Fe and Zn content in vegetative and grain tissues during grain filling of CE‐OsNAS2 and NS wheat lines. Fe and Zn content (μg) in NS (open circles) and CE‐1 (closed circles) plant tissues between 5–8, 12–15, 19–21 and 26–29 days after anthesis (DAA) as well as at maturity. (a, b) grain; (c, d) bracts; (e, f) rachis; and (g, h) flag leaf tissues were sampled for Fe and Zn content, respectively. Each symbol represents mean ± SEM of at least 3 biological replicates. Asterisks denote the significance between NS and CE‐1 for P < 0.05 (*), P ≤ 0.01 (**), P ≤ 0.001 (***) as determined by student's t‐test.
Figure 3
Figure 3
Distribution of Fe and Zn in CE‐OsNAS2 and NS wheat grain. (a) Grain position where transverse cross‐sections were made. (b) Location of major tissue types in transverse section of wheat grain. (c) Bright field images of two representative NS grain sections and corresponding XFM elemental maps of Fe and Zn. (d) Bright field images of two representative CE‐1 grain sections and corresponding XFM elemental maps of Fe and Zn. Colour bar represents high (white) and low (black) elemental concentration. White boxes in the bright field images represent areas in two grain sections (one each for NS and CE‐1) used to generate line scans. (e) Line scans showing the distribution and signal intensity of Fe and Zn across NS grain. (f) Line scans showing the distribution and signal intensity of Fe and Zn across CE‐1 grain. Units for the y‐axis are elemental counts per pixel.
Figure 4
Figure 4
Distribution of Fe, Zn and P in CE‐OsNAS2 and NS wheat grain. (a, b) Bright field images of NS and CE‐1 grain sections, respectively. Yellow boxes represent areas used to generate tri‐colour elemental maps. (c) Tri‐colour XFM elemental map of Fe (red), Zn (green) and P (blue) in NS grain. White box represents the area used to generate line scans. (d) Tri‐colour XFM elemental map of Fe (red), Zn (green) and P (blue) in CE‐1 grain. White box represents the area used to generate line scans. (e) Line scans showing the distribution and signal intensity of Fe, Zn, P and S in NS grain. (f) Line scans showing the distribution and signal intensity of Fe, Zn, P and S in CE‐1 grain. Units for the y‐axis are elemental counts per pixel.
Figure 5
Figure 5
Whole grain nutrition of field grown CE‐1 and NS wheat lines. Nutrient and metabolite concentrations in whole grain samples of NS (white) and three CE‐1 sibling lines (CE‐1.1, 1.2 and 1.3, grey) at the T6 generation. (a–c) Whole grain Fe, Zn and P concentrations (μg/g) of NS and CE‐1 plants grown at Katanning and Merredin field sites. (d, e) Whole grain NA and DMA concentrations (μmol/mg) of NS and CE‐1 plants grown at Katanning and Merredin field sites. (f) Whole grain Fe bioavailability of NS and CE‐1 plants grown at Merredin field site. Bars represent mean ± SEM of 3 biological replicates. Asterisks denote the significance between NS and each CE‐1 wheat line for P < 0.05 (*), P ≤ 0.01 (**), P ≤ 0.001 (***) as determined by student's t‐test.
Figure 6
Figure 6
White flour nutrition of field grown CE‐1 and NS wheat lines. Nutrient and metabolite concentrations in white flour samples of NS (white) and three CE‐1 sibling lines (CE‐1.1, 1.2 and 1.3, grey) at the T6 generation. (a–c) White flour Fe, Zn and P concentrations (μg/g) of NS and CE‐1 plants grown at Katanning and Merredin field sites. (d, e) White flour NA and DMA concentrations (μmol/mg) of NS and CE‐1 plants grown at Katanning and Merredin field sites. (f) White flour Fe bioavailability of NS and CE‐1 plants grown at Merredin and Katanning field sites. Bars represent mean ± SEM of 3 biological replicates. Asterisks denote the significance between NS and each CE‐1 wheat line for P < 0.05 (*), P ≤ 0.01 (**), P ≤ 0.001 (***) as determined by student's t‐test.

References

    1. Beal, T. , Massiot, E. , Arsenault, J.E. , Smith, M.R. and Hijmans, R.J. (2017) Global trends in dietary micronutrient supplies and estimated prevalence of inadequate intakes. PLoS One, 12, e0175554. - PMC - PubMed
    1. Berger, B. , De Regt, B. and Tester, M. (2012) High‐throughput phenotyping in plants. Methods Mol. Biol. 918, 9–20. - PubMed
    1. Borrill, P. , Connorton, J.M. , Balk, J. , Miller, A.J. , Sanders, D. and Uauy, C. (2014) Biofortification of wheat grain with iron and zinc: integrating novel genomic resources and knowledge from model crops. Front Plant Sci. 5, 1–8. - PMC - PubMed
    1. Bouis, H.E. , Hotz, C. , McClafferty, B. , Meenakshi, J.V. and Pfeiffer, W.H. (2011) Biofortification: a new tool to reduce micronutrient malnutrition. Food Nutr. Bull. 32, S31–S40. - PubMed
    1. Brouns, F. , Hemery, Y. , Price, R. and Anson, N.M. (2012) Wheat aleurone: separation, composition, health aspects, and potential food use. Crit. Rev. Food Sci. Nutr. 52, 553–568. - PubMed

Publication types

MeSH terms

LinkOut - more resources