

Trends in Clinical Breast Density Assessment From the Breast Cancer Surveillance Consortium
- PMID: 30624682
- PMCID: PMC6579740
- DOI: 10.1093/jnci/djy210
Trends in Clinical Breast Density Assessment From the Breast Cancer Surveillance Consortium
Abstract
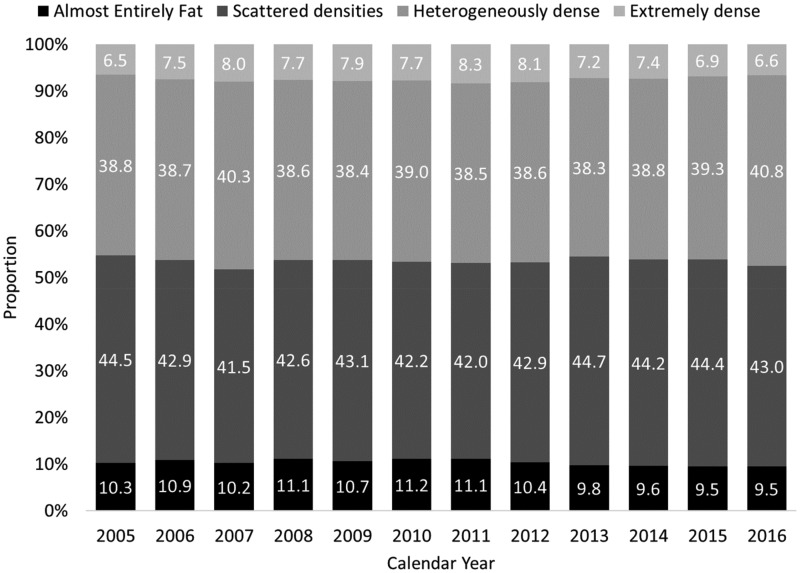
Changes to mammography practice, including revised Breast Imaging Reporting and Data System (BI-RADS) density classification guidelines and implementation of digital breast tomosynthesis (DBT), may impact clinical breast density assessment. We investigated temporal trends in clinical breast density assessment among 2 990 291 digital mammography (DM) screens and 221 063 DBT screens interpreted by 722 radiologists from 144 facilities in the Breast Cancer Surveillance Consortium. After age-standardization, 46.3% (95% CI = 44.1% to 48.6%) of DM screens were assessed as dense (heterogeneously/extremely dense) during the BI-RADS 4th edition era (2005-2013), compared to 46.5% (95% CI = 43.8% to 49.1%) during the 5th edition era (2014-2016) (P = .93 from two-sided generalized score test). Among DBT screens in the BI-RADS 5th edition era, 45.8% (95% CI = 42.0% to 49.7%) were assessed as dense (P = .77 from two-sided generalized score test) compared to 46.5% (95% CI = 43.8% to 49.1%) dense on DM in BI-RADS 5th edition era. Results were similar when examining all four density categories and age subgroups. Clinicians, researchers, and policymakers may reasonably expect stable density distributions across screened populations despite changes to the BI-RADS guidelines and implementation of DBT.
© The Author(s) 2019. Published by Oxford University Press. All rights reserved. For permissions, please email: journals.permissions@oup.com.
Figures
References
-
- Carney PA, Miglioretti DL, Yankaskas BC, et al. Individual and combined effects of age, breast density, and hormone replacement therapy use on the accuracy of screening mammography. Ann Intern Med. 2003;1383:168–175. - PubMed
-
- Boyd NF, Guo H, Martin LJ, et al. Mammographic density and the risk and detection of breast cancer. N Engl J Med. 2007;3563:227–236. - PubMed
-
- Alonzo-Proulx O, Mawdsley GE, Patrie JT, Yaffe MJ, Harvey JA.. Reliability of automated breast density measurements. Radiology. 2015;2752:366–376. - PubMed
