. 2019 Apr 16;219(9):1407-1417.
doi: 10.1093/infdis/jiy668.

Differential Pathogen-Specific Immune Reconstitution in Antiretroviral Therapy-Treated Human Immunodeficiency Virus-Infected Children

Affiliations

Differential Pathogen-Specific Immune Reconstitution in Antiretroviral Therapy-Treated Human Immunodeficiency Virus-Infected Children

Maximilian Muenchhoff et al. J Infect Dis. .

Abstract

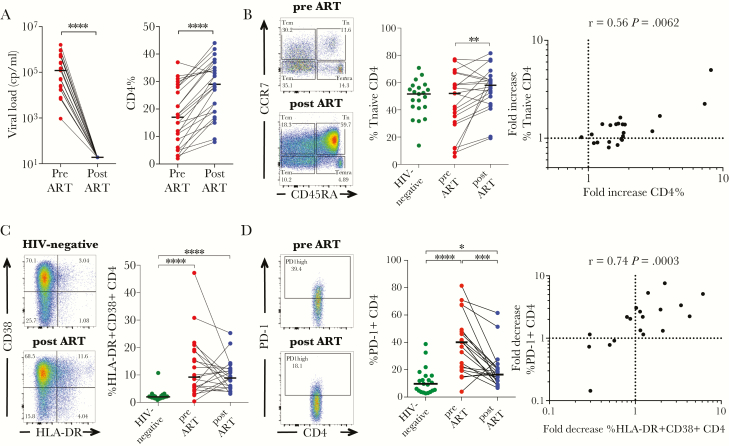
Background: Susceptibility to coinfections in human immunodeficiency virus (HIV)-infected patients remains increased despite antiretroviral therapy (ART). To elucidate mechanisms involved in immune reconstitution, we studied immune activation, immune exhaustion, and HIV- and copathogen-specific T-cell responses in children before and after ART.

Methods: We prospectively enrolled 25 HIV-infected children to study HIV-, cytomegalovirus (CMV)-, and tuberculosis (TB)-specific T-cell responses before and 1 year after initiation of ART using intracellular cytokine (interleukin-2, interferon-γ, tumor necrosis factor-α) staining assays after in vitro stimulation. We further measured expression of activation, immune exhaustion, and memory phenotype markers and studied proliferative responses after antigen stimulation.

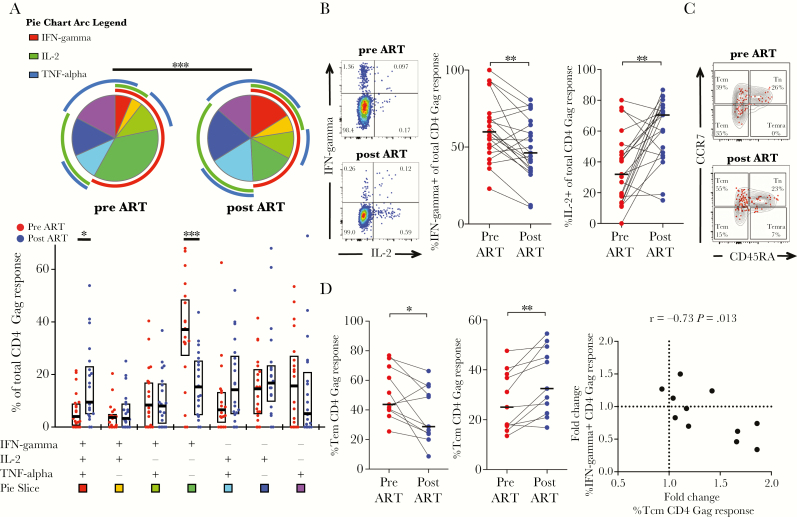
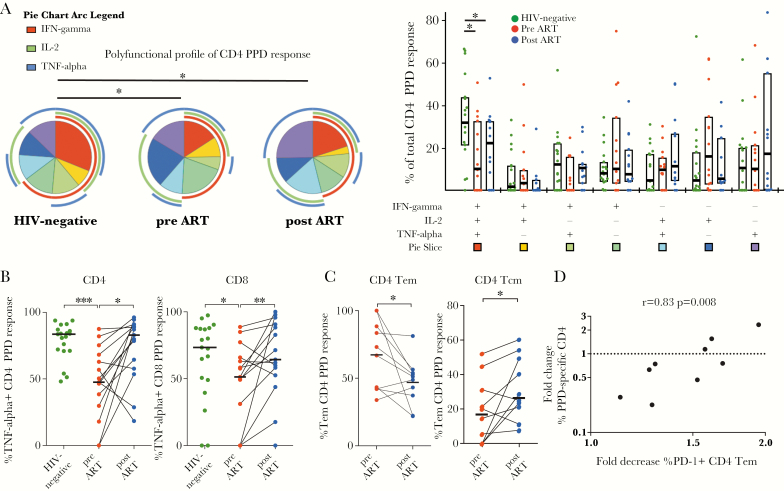
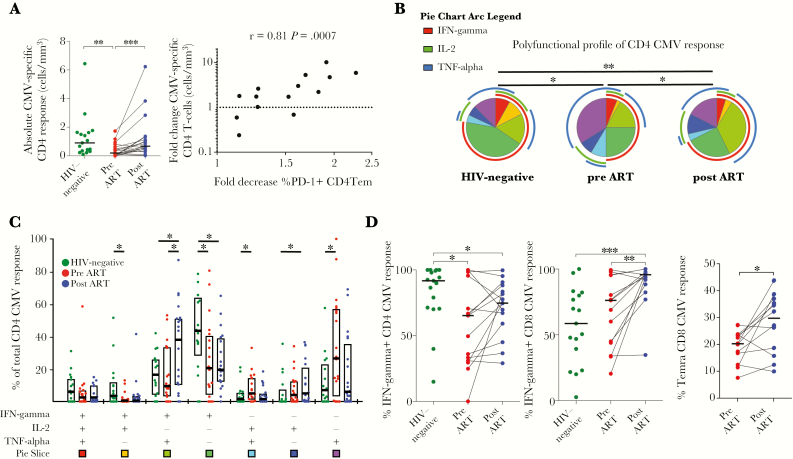
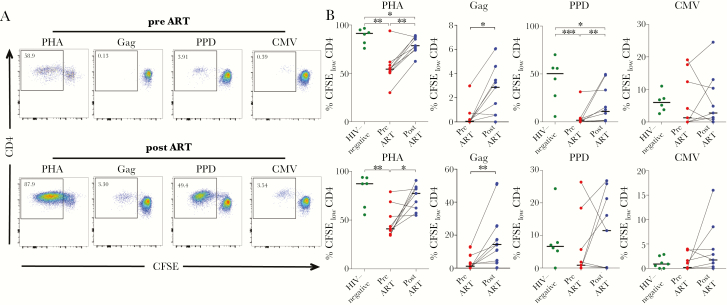
Results: We observed differential, pathogen-specific changes after 1 year of ART in cytokine profiles of CD4 T-cell responses that were associated with shifts in memory phenotype and decreased programmed cell death 1 (PD-1) expression. The proliferative capacity of HIV- and PPD-specific responses increased after 1 year of ART. Of note, the recovery of CMV- and TB-specific responses was correlated with a decrease in PD-1 expression (r = 0.83, P = .008 and r = 0.81, P = .0007, respectively).

Conclusions: Reconstitution of immune responses on ART is associated with alterations in T-cell phenotype, function, and PD-1 expression that are distinct for HIV, TB, and CMV. The PD-1 pathway represents a potential target for immunotherapy in HIV-infected patients on ART with insufficient immune reconstitution.

Keywords: HIV; antiretroviral therapy; cytomegalovirus; tuberculosis.


Figures

Figure 1.
Figure 1.
Effect of antiretroviral therapy (ART) on T-cell activation, programmed cell death 1 (PD-1) expression, and memory phenotype. (A) Suppression of viremia and recovery of CD4% after 1 year of ART in the 25 human immunodeficiency virus (HIV)-infected children selected for this study. Medians are shown as horizontal bars. (B) Representative fluorescence-activated cell sorting (FACS) data showing CD45RA and CCR7 expression of CD4 T cells of child 205-33-0015-1 before (top dot plot; CD4 count: 35 cells/mm3, CD4%: 2%, viral load: 25910 cp/mL) and after 1 year of ART ([bottom dot plot] CD4 count, 692 cells/mm3; CD4%, 16%; viral load, <20 cp/mL). Middle panel shows the frequency of naive (CD45RA+CCR7+) CD4 T cells in HIV-infected children before and 1 year after ART compared to HIV-uninfected children. The fold increase of the naive CD4 T-cell population (frequency of naive CD4 T cells after 1 year of ART/frequency of naive CD4 T cells before ART) correlates with the fold increase of CD4% (CD4% after 1 year of ART/CD4% before ART). (C) Representative FACS data showing CD38 and HLA-DR expression of CD4 T cells in an HIV-uninfected child (top panel) compared with child 205-33-0061-1 after 1 year of ART ([bottom panel] CD4 count, 511 cells/mm3; CD4%, 15%; viral load, <20 cp/mL). Frequencies of activated CD4+ T cells (CD38+HLA-DR+) of HIV-infected children before and after 1 year of ART are shown in comparison with HIV-uninfected children. (D) Representative FACS data for PD-1-expression of CD4 T cells of child 205-33-0061-1 before ([top panel] CD4 count, 251 cells/mm3; CD4%, 9%; viral load, 540000 cp/mL) and after 1 year of ART ([bottom panel] CD4 count, 511 cells/mm3; CD4%, 15%; viral load, <20 cp/mL). Frequencies of PD-1+ CD4 T cells are shown for HIV-infected children before and after ART and in comparison with HIV-uninfected children. Correlation between the fold decrease of PD-1high CD4 T cells (frequency of PD-1+ CD4 T cells before ART/frequency of PD-1+ CD4 T cells after ART) and activated CD4 T cells after 1 year of ART (frequency of CD38+HLA-DR+ CD4 T cells before/frequency of CD38+HLA-DR+ CD4 T cells after ART). Statistical comparisons between groups are based on Mann-Whitney U and Wilcoxon rank-sum tests for unmatched and paired samples, respectively (A–D). Spearman rank tests are shown for correlations (B and D) (*, P < .05; **, P < .01; ***, P < .001; ****, P < .0001).
Figure 2.
Figure 2.
Changes in functional profiles correlate with shifts in memory phenotype of human immunodeficiency virus (HIV)-specific CD4 T cells on antiretroviral therapy (ART). (A) Comparison of HIV-1 Gag-reactive CD4 T cells of 21 children before and after 1 year of ART. Each slice of the pie chart represents the average relative proportions of total Gag-reactive cells producing each possible combination of the cytokines measured. The arcs illustrate the proportions of specific cytokine responses. Interferon (IFN)-γ-monoproducing cells are the predominant Gag-reactive CD4 T cells before ART. Human immunodeficiency virus-specific CD4 T cells from HIV-infected children before ART (red dots) have a qualitatively different functional profile compared with after 1 year of ART (blue dots). The box plots represent the median values and interquartile range of the proportion of the respective functional response toward the total CD4 T-cell response against HIV Gag. (B) Representative fluorescence-activated cell sorting plots showing the frequencies of IFN-γ and interleukin (IL)-2 responding CD4 T cells of child 205-33-0065-1 before ([top] panel] CD4 count, 195 cells/mm3; CD4%; 11%, viral load; 250000 cp/mL) and 1 year after ART ([bottom panel] CD4 count, 430 cells/mm3; CD4%, 19%; viral load, <20 cp/mL). The percentage of the contribution of the indicated functional response (IFN-γ, left; IL-2, right) toward the total CD4 T-cell response against HIV Gag are shown for HIV-infected children before (red) and after (blue) ART. Decreased proportions of IFN-γ and increased proportions of IL-2 Gag-responding CD4 T cells after ART were observed. (C) Representative dot plots showing the memory maturation profile of the total CD4 population (gray density plot) and of CD4 T cells responding with any cytokine against HIV Gag (Boolean combination of IFN-γ- and/or IL-2- and/or TNF-α-positive CD4 T cells [red dots]). The proportions for each memory subset of the total Gag response are given in the quadrants. Data are shown for child 205-33-0066-1 before ([top panel] CD4 count, 251 cells/mm3; CD4%, 9%; viral load, 540 000 cp/mL) and after 1 year of ART ([bottom panel] CD4 count, 511 cells/mm3; CD4%, 15%; viral load, <20 cp/mL). (D) The proportions of Gag-responding CD4 T cells with T effector memory (Tem) (CD45RACCR7) and central memory T (Tcm) (CD45RACCR7+) memory maturation are shown for n = 11 children before (red) and 1 year after ART (blue). The correlation is shown between the fold change of the proportion of Gag-responding CD4 T cells with Tcm phenotype after 1 year of ART (%Tcm of total response after ART/%Tcm response before ART) and the fold change of the proportion of IFN-γ responding cells of the total CD4 Gag response (%IFN-γ responding cells after ART/%IFN-γ responding cells before ART). Increased proportions of Gag-responding CD4 T cells with central memory phenotype (CD45RACCR7+) correlate with decreased IFN-γ responses. Pie charts were compared using permutation tests based on χ2 analysis (A). Statistical comparisons between groups are based on Wilcoxon rank-sum tests for paired samples (A, B, and D). Spearman rank test correlation coefficients are shown (D) (*, P < .05; **, P < .01; ***, P < .001).
Figure 3.
Figure 3.
Limited changes in phenotype and function of mycobacteria-specific T-cell responses in human immunodeficiency virus (HIV)-infected children on antiretroviral therapy (ART). (A) Comparison of purified peptide derivative (PPD)-reactive CD4 T cells of 15 children before and after 1 year of ART relative to 22 HIV-uninfected children. Each slice of the pie chart represents the average relative proportions of total PPD-reactive cells producing each possible combination of the cytokines measured. The arcs illustrate the proportions of specific cytokine responses. The PPD-specific CD4 T cells from HIV-infected children before ART (red dots) and after ART (blue dots) show persistently reduced proportions of polyfunctional PPD-reactive CD4 T cells compared with HIV-negative children (green dots). Median values and the interquartile rage are indicated by the bar graphs. (B) Proportions of tumor necrosis factor (TNF)-α-responding CD4 and CD8 T cells are decreased in HIV-infected children before ART (red dots) compared with HIV-negative children (green dots). After 1 year of ART, proportions of TNF-α-responding T cells (blue dots) are restored to levels similar to HIV-negative children. Median values are indicated by the bar graph. (C) Decreased proportions of T effector memory (Tem) CD4 T cells (left panel) and increased proportions of central memory T (Tcm) CD4 T cells of the total PPD-specific CD4 response in children after 1 year of ART (blue dots) compared with before ART (red dots). Data are shown for n = 9 children with available samples for this analysis. (D) Association between the decrease of programmed cell death 1 (PD-1)+ CD4 Tem cells on ART (%PD-1+ Tem CD4 T cells before ART/%PD-1+ Tem after ART) and the change of the total CD4 PPD response (%cytokine-positive CD4 T cells after ART/%cytokine-positive CD4 T cells before ART). Pie charts were compared using permutation tests based on χ2 analysis (A). Statistical comparisons between groups are based on Mann-Whitney U and Wilcoxon rank-sum tests for unmatched and paired samples, respectively (A–C). Spearman rank test correlation coefficients are shown (D) (*, P < .05; **, P < .01; ***, P < .001).
Figure 4.
Figure 4.
Recovery of cytomegalovirus (CMV)-specific T-cell responses in human immunodeficiency virus (HIV)-infected children on antiretroviral therapy (ART). (A) Comparison of the number of CMV-responding CD4 T cells per mm3 of blood in 19 HIV-infected children before (red dots) and after 1 year of ART (blue dots) and relative to 22 HIV-uninfected children (green dots). Horizontal lines represent median values. The fold increase of the numbers of CMV-responding CD4 T cells (CMV-specific CD4 T cells per mm3 blood after ART/CMV-specific CD4 T cells per mm3 blood before ART) in HIV-infected children after 1 year of ART correlates with decreased frequencies of programmed cell death 1 (PD-1)+ CD4 T effector memory (Tem) cells (%PD-1+ Tem CD4 T cells before ART/%PD-1+ Tem after ART). (B and C) Comparison of cytokine profiles of CMV-reactive CD4 T cells of 15 children with a detectable response before and after 1 year of ART relative to HIV-uninfected children. Each slice of the pie chart represents the average relative proportions of total PPD-reactive cells producing each possible combination of the cytokines measured. The arcs illustrate the proportions of specific cytokine responses. (B) Polyfunctional profiles of CMV-reactive CD4 T cells. Median values and the interquartile rage are indicated by the bar graphs (C). (D, left panel) Decreased proportions of interferon (IFN)-γ-responding CMV-specific CD4 T cells in HIV-infected children before (red dots) and after ART (blue dots) compared with HIV-uninfected children (green dots). (Middle panel) Increased proportions of IFN-γ-responding CD8 T cells in children after 1 year of ART. (Right panel) Increased proportions of CMV-responding CD8 T cells with Temra memory phenotype in children after 1 year on ART. Horizontal bars indicate median values. Pie charts were compared using permutation tests based on χ2 analysis (B). Statistical comparisons between groups are based on Mann-Whitney U and Wilcoxon rank-sum tests for unmatched and paired samples, respectively (A, C, and D). Spearman rank correlation coefficient and P value are shown (A). (*, P < .05; **, P < .01; ***, P < .001).
Figure 5.
Figure 5.
Recovery of T-cell proliferative capacity in human immunodeficiency virus (HIV)-infected children on antiretroviral therapy (ART). (A) Representative fluorescence-activated cell sorting plots for carboxyfluorescein diacetate succinimidyl ester (CFSE)-dilution proliferative responses gated on viable CD4 T cells after 7-day in vitro stimulation with the indicated stimulations in children before and after 1 year of ART. Data are shown for child 205-33-0067-2 before ([top panel] CD4 count, 443 cells/mm3; CD4%, 18%; viral load, 1 600 000 cp/mL) and after 1 year of ART ([bottom panel] CD4 count, 631 cells/mm3; CD4%, 29%; viral load, <20 cp/mL). (B) Comparison of CFSElow proliferative CD4 and CD8 T-cell responses of HIV-infected children (n = 9) before (red dots) and after ART (blue dots) and relative to HIV-uninfected children (green dots, n = 6). Medians are shown as horizontal bars. Statistical comparisons between groups are based on Mann-Whitney U and Wilcoxon rank-sum tests for unmatched and paired samples, respectively (*, P < .05; **, P < .01; ***, P < .001).

Comment in

References

    1. Paiardini M, Müller-Trutwin M. HIV-associated chronic immune activation. Immunol Rev 2013; 254:78–101. - PMC - PubMed
    1. Day CL, Kaufmann DE, Kiepiela P, et al. PD-1 expression on HIV-specific T cells is associated with T-cell exhaustion and disease progression. Nature 2006; 443:350–4. - PubMed
    1. Kaufmann DE, Kavanagh DG, Pereyra F, et al. Upregulation of CTLA-4 by HIV-specific CD4+ T cells correlates with disease progression and defines a reversible immune dysfunction. Nat Immunol 2007; 8:1246–54. - PubMed
    1. Betts MR, Nason MC, West SM, et al. HIV nonprogressors preferentially maintain highly functional HIV-specific CD8+ T cells. Blood 2006; 107:4781–9. - PMC - PubMed
    1. Geldmacher C, Ngwenyama N, Schuetz A, et al. Preferential infection and depletion of Mycobacterium tuberculosis-specific CD4 T cells after HIV-1 infection. J Exp Med 2010; 207:2869–81. - PMC - PubMed

Publication types

MeSH terms