Review
. 2019 May 8;119(9):6040-6085.
doi: 10.1021/acs.chemrev.8b00520. Epub 2019 Jan 9.

Mechanistic Landscape of Membrane-Permeabilizing Peptides

Affiliations
Review

Mechanistic Landscape of Membrane-Permeabilizing Peptides

Shantanu Guha et al. Chem Rev. .

Abstract

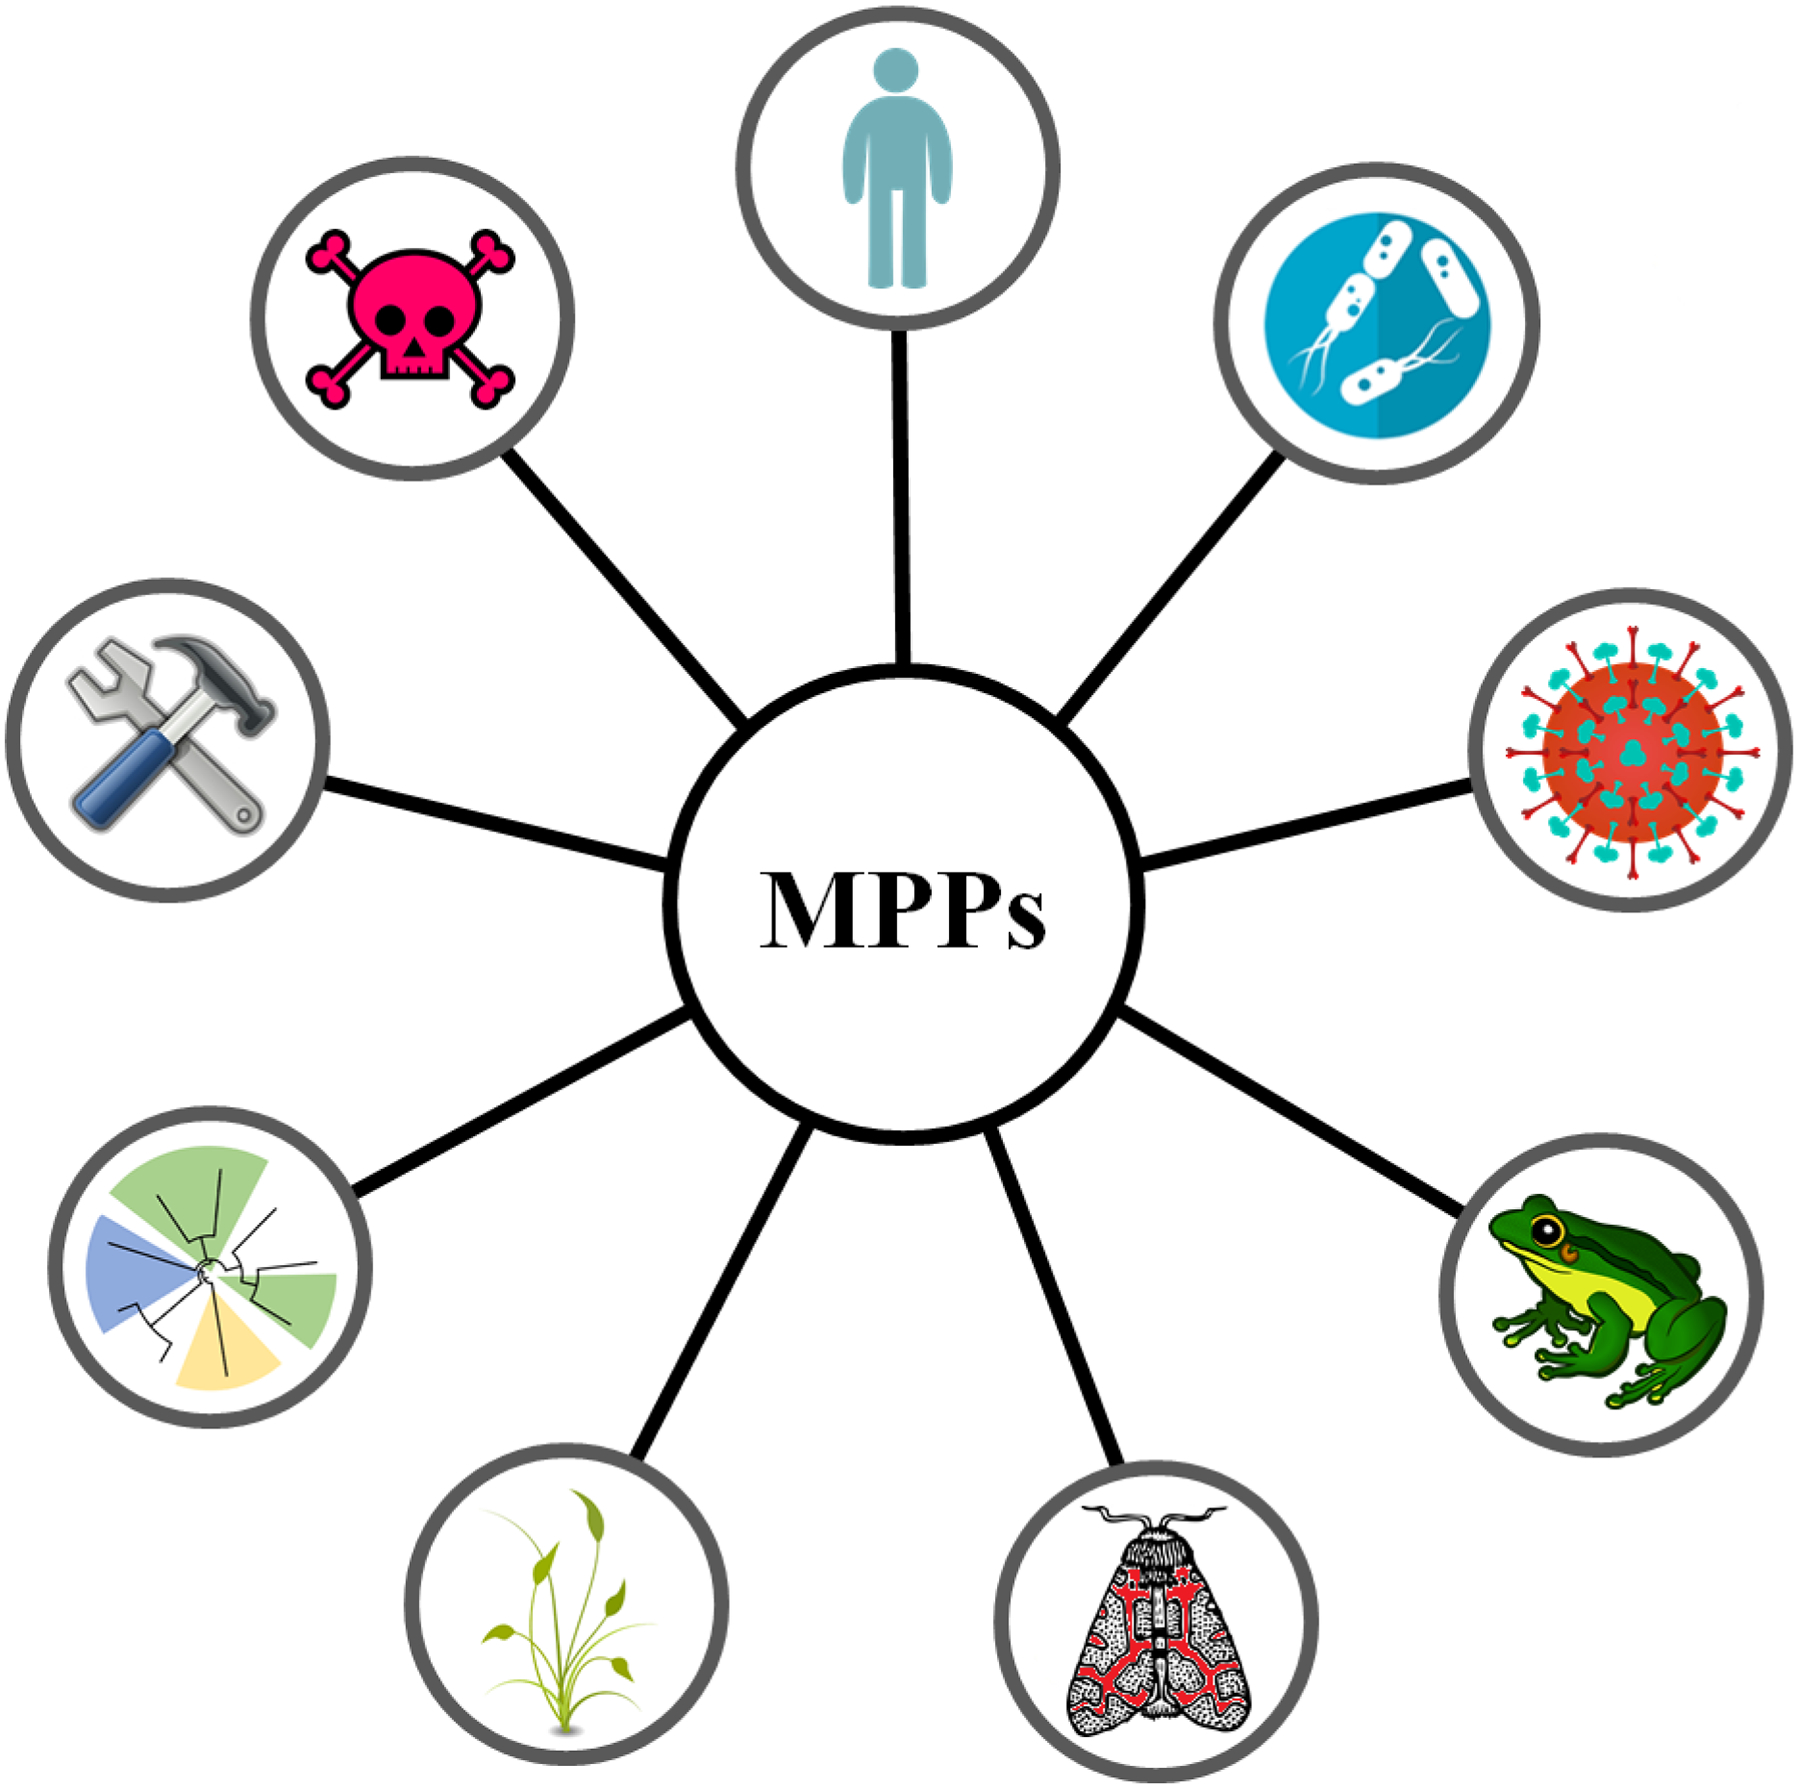
Membrane permeabilizing peptides (MPPs) are as ubiquitous as the lipid bilayer membranes they act upon. Produced by all forms of life, most membrane permeabilizing peptides are used offensively or defensively against the membranes of other organisms. Just as nature has found many uses for them, translational scientists have worked for decades to design or optimize membrane permeabilizing peptides for applications in the laboratory and in the clinic ranging from antibacterial and antiviral therapy and prophylaxis to anticancer therapeutics and drug delivery. Here, we review the field of membrane permeabilizing peptides. We discuss the diversity of their sources and structures, the systems and methods used to measure their activities, and the behaviors that are observed. We discuss the fact that "mechanism" is not a discrete or a static entity for an MPP but rather the result of a heterogeneous and dynamic ensemble of structural states that vary in response to many different experimental conditions. This has led to an almost complete lack of discrete three-dimensional active structures among the thousands of known MPPs and a lack of useful or predictive sequence-structure-function relationship rules. Ultimately, we discuss how it may be more useful to think of membrane permeabilizing peptides mechanisms as broad regions of a mechanistic landscape rather than discrete molecular processes.


Figures

Figure 1.
Figure 1.
The mechanistic landscape of membrane permeabilizing peptides. The molecular mechanisms of membrane permeabilizing peptides have, for the most part, eluded atomic level description despite decades of intense study. As a result, their active structures and mechanisms are often drawn as cartoons like the imaginary snapshots arrayed in the cartoon bilayer above. Different colored lipids indicate changes in membrane composition, lipid tails and headgroups. Curvy tails indicate fluid phase bilayers and straight tails indicate more ordered domains. In this review we describe how it might be useful to think of membrane permeabilizing peptides on a mechanistic landscape where molecular mechanism is not a fixed entity, but instead depends on the sum of many experimental variables. The image in the center of the cartoon vesicle depicts concentric “dials”, one for each experimental variable (many are not explicitly shown). Each dial can be set to a particular “value” in the parameter space. The combinations of all the settings give rise to a point on multidimensional mechanistic landscape.
Figure 2.
Figure 2.
Melittin, the archetypal membrane permeabilizing peptide. A: European Honey Bee (apis mellifera) workers produce a defensive venom that contains many compounds, including peptide and proteins. The most abundant component by weight is melittin, a 26-residue membrane permeabilizing peptide. Photograph by William Wimley, used with permission. B: Amino acid sequences of melittin from Apis mellifera and several closely related species. Sequences are generally hydrophobic over the first 20 residues, except for lysine at position 7, and are highly polar and basic on the C-terminus. C: Helical wheel diagrams show the placement of residues on the surface of an imaginary perfect helix. D: On the surface of the ideal melittin helix, hydrophobic residues form a contiguous surface. E: In the first three-dimensional structure of melittin in solution, and other structures its amphipathicity was apparent in the burial of the hydrophobic surfaces in the core of a tetrameric structure or in the membrane. F: The amphipathicity of the melittin monomers in the context of the crystal structure, in which the helices are bent and disrupted at the central Gly-X-Pro. G: Some experiments and biased molecular dynamics simulations, demonstrate melittin forming membrane spanning equilibrium pores. However, unbiased simulations of slow insertion equilibrium requires currently unachievably long simulations. Images courtesy of Jakob Ulmschneider. H: Under other conditions, experiments, such as electrochemical impedance spectroscopy and vesicle permeabilization, show that the permeabilization of membranes by melittin is a transient non-equilibrium process,,.
Figure 3.
Figure 3.
Sources of membrane permeabilizing peptides. There are a multitude of sources for membrane-permeabilizing peptides (MPPs) as shown in the figure above. Clockwise from the top, sources include humans and other mammal host defense, bacteria and fungi, viruses, amphibian and other vertebrate host defense, insect host defense, plant host defense, bioinformatics and computational approaches, engineering and rational design, and venoms and toxins. Host defense peptides are the most ubiquitous, but there are also MPPs which can comprise part of a venom or toxin cocktail, viroporins, de novo designed peptides, synthetically evolved peptides, and other sources which are not listed. Overall, there are thousands of known MPPs and certainly many more to be discovered. Images reproduced with permission under Creative Commons CC0 license.
Figure 4.
Figure 4.
Secondary structures of membrane permeabilizing peptides. Cartoon models for 15 peptides which are known membrane-permeabilizing peptides depicting the wide array of secondary structures. Some peptides are uniformly one secondary structure and other peptides appear to be a hybrid of multiple secondary structure motifs.
Figure 5.
Figure 5.
Amphipathic structures of membrane permeabilizing peptides. Space filling models for 15 peptides which are known membrane-permeabilizing peptides depicting hydrophobicity; no peptide here is depicted as singularly hydrophilic or hydrophobic, there are elements of both when considering MPPs.
Figure 6.
Figure 6.
Realistic cartoons of lipid vesicles. In this cartoon, small (SUV), large (LUV) and giant (GUV) unilamellar vesicles are drawn roughly to scale in three different magnifications. Even the membrane thickness is drawn to scale in each magnifications. On the right is a simulation of a vesicle of 34 nm diameter, containing ~40,000 lipids. Image courtesy of Andrew Jewett at www.moltemplate.org.
Figure 7.
Figure 7.
Large unilamellar vesicles. LUVs are the most commonly used synthetic models in the study of peptides in membranes. They are formed by extrusion of multilamellar lipid suspensions through Nucleopore polycarbonate filters at high pressure. A: Cryo transmission electron microscopy of a preparation of LUVs made from fluid phase PC lipids (Jibao He, Tulane University). B: Negative stain electron microscopy of LUVs showing their remarkable size and uniformity (Thomas W. Tillack, University of Virginia). A legacy image of the first extruded LUVs made by author WCW, circa 1987. C: Comparison of LUVs with the double membrane of E. coli bacteria, in the same sample, shows similar size and curvature. D: Comparison of LUVs with influenza virions in the same sample shown similar size and curvature.
Figure 8.
Figure 8.
Probes used to measure permeabilization of LUVs. The chemical structures for small molecules and cartoon representations of larger molecules are shown, as well as a general theory of each assay. Only a select few assays are shown. Some assays can be relatively simple and measure leakage of a single fluorophore out of a vesicle, as in (A) and (B). Others are more elaborate, utilizing FRET [(H), (F)], macromolecules [(G), (H)], or even membrane potential [(I)]. The assays are as follows: (A) carboxyfluorescein assay, (B) calcein assay, (C) ANTS/DPX assay, (D) Tb3+/DPA assay, (E) equilibrium permeabilization assay, (F) translocation assay, (G) chymotrypsin release assay, (H) macromolecule release assay, and (I) diffusion potential assay. See text for details.
Figure 9.
Figure 9.
Graded and all-or-none leakage are two distinct peptide-induced leakage mechanisms on vesicles. The ANTS/DPX assay is used as an example here. (A) When all vesicles lose an equal portion of all encapsulated solutes, it is considered graded, non-preferential leakage. (B) Losing an unequal portion of encapsulated solutes is considered graded and preferential. The equations from can determine ANTS or DPX preferential leakage. In this example, α > 1 therefore there is preferential leakage of the cationic quencher DPX. (C) Treatment of a sample of vesicles can lead to some vesicles losing all of their contents while the remaining vesicles losing none. This is an all-or-none behavior. Yellow and black dots are ANTS and DPX molecules, respectively. (D) This simulation shows how the two mechanisms can be experimentally distinguished. When plotting Qin (internal quenching) against fout (ANTS released), a steady Qin indicates an all-or-none mechanism; an increasing Qin indicates a graded mechanism. Different encapsulated [DPX] affects the results (left) such that 4–8 mM is optimal. Here, α = kANTS/kDPX which determines the preferential nature of leakage that is occurring (right). Adapted with permission from ref . Copyright 1997 Elsevier, Inc.
Figure 10.
Figure 10.
Cationic peptides rapidly aggregate anionic LUVs. Addition of the peptide *ARVA (RRGWALRLVLAY-amide) to POPG vesicles causes immediate, large scale aggregation of vesicles as shown by the increase in light scattering. Incorporation of PEG-2k-POPE lipids decreases aggregation dramatically, completely blocking it at 4–5 mol% PEG-lipids.
Figure 11.
Figure 11.
Peptide-induced permeabilization of GUVs. Membrane leakage of Alexa Fluor 647 hydrazide (AF647) and membrane permeabilization of carboxyfluorescein (CF)-labeled magainin 2 (CF-magainin 2) is visualized in single 40%DOPG/60%DOPC-GUVs. (A) and (B) shows confocal laser scanning microscopy (CLSM) images of (1) AF647 and (2) CF-Magainin 2 in a single GUV treated with 31 μM CF-magainin 2/magainin 2 and 20 μM CF-magainin 2/magainin 2 respectively at certain time after of CF-magainin 2/magainin 2 addition to GUV denoted in seconds under each image. (C) and (D) describe the time course of peptide-induced decrease in fluorescence intensity of AF647 in the GUV and increase in permeation of CF in the rim of GUV following the addition of CF-magainin 2/magainin 2. The solid red line corresponds to fluorescence intensity of AF647 inside the GUV while the green triangles correspond to the fluorescence intensity of CF-magainin 2 in the rim. The circles correspond to the fluorescence intensity of the outside vicinity of the GUV. FI = I(t)/I(0), where I(t) and I(0) are the fluorescence intensity of AF647 inside the GUV at time = t. (E) refers to concentration dependent average lag time between the stochastic permeabilization of magainin 2 in to the GUV and the leakage of dye from inside the GUV. These two phenomena can be studied by quantification of increase in the fluorescence intensities of the CF at rim of the GUV and decrease in the fluorescence intensity of AF647 from inside the GUV. Adapted with permission from ref . Copyright 2015 American Chemical Society. Images courtesy of Masahito Yamazaki.
Figure 12:
Figure 12:
Atomic Force Microscopy (AFM) demonstrating the effects of MelP5 (a melittin derivative) on POPC (Peptide:Lipid = 1:1200). A: Punctate perturbations can be visualized in this image and seem to be present across the entire bilayer plane (500 × 500 nm2). B: An image of a MelP5-treated POPC membrane at a higher magnification (290 × 290 nm2). C: A line scan through the image (dashed line in Fig 12A); numerous bilayer perturbations are scanned, and this information can be used to determine the depth of each topological depression. D: A line scan through the image (dashed line in Fig. 12B) at increased magnification. In this panel, pore-like features are highlighted in purple and thinned membrane regions are highlighted in green. Images courtesy of Gavin King. Adapted with permission from ref . Copyright 2018 American Chemical Society.
Figure 13.
Figure 13.
Electrochemical impedance spectroscopy. A: A polymer cushioned planar supported bilayer is adsorbed to the cleaned surface on a silicon crystal and the electrical properties are measured and modeled with an equivalent circuit. B: Resistance changes of a PC bilayer upon addition of the equilibrium pore former, MelP5. Note that the resistance does not recover as it would for a transient permeabilizing peptide. C: Concentration dependence of the resistance drop for a variety of potent MPPs. Adapted with permission from ref . Copyright 2014 American Chemical Society.
Figure 14.
Figure 14.
Oriented Circular Dichroism. In OCD, oriented multibilayers stacks containing a peptide that has mostly α-helical secondary structure are prepared on a quartz disk and hydrated through the vapor phase. Circular dichroism is measured with the bilayer plane oriented perpendicular to the beam axis. A: Bilayers with imaginary helical MPPs that have axes perpendicular or parallel to the bilayer normal, or a combination of the two. B: Theoretical spectra for perpendicular (transmembrane) and parallel (surface-oriented) α-helices are shown, along with linear combinations of the two. These data are scaled to represent residue contributions assuming 100% helicity. C: Real experimental OCD data for melittin, which is parallel to the bilayer and has a helicity of ~60%, and two gain of function analogs, MelP5, which is perpendicular to the bilayer and has 90% helix, and MelP9, which is parallel to the bilayer and has 90% helix. Adapted with permission from ref . Copyright 2018 American Chemical Society.
Figure 15.
Figure 15.
Molecular dynamics simulations of MPPs show binding and structure formation on and in bilayers. (A) A simulation of melittin monomer binding over 17 μs shows that the peptide settles at a depth near the glycerol groups, which notably is consistent with X-ray diffraction results. Adapted with permission from ref . Copyright 2013 Elsevier, Inc. (B) Two different behaviors of multiple peptides binding to a bilayer are shown here. The interfacial S state is preferred by PGLa while a transmembrane configuration is preferred by alamethicin, a known potent pore former. Adapted with permission from ref . Copyright 2018 American Chemical Society. (C) Transmembrane structures of an all-or-none and graded peptide. Melittin peptides are in a U-shape that blocks water passage while magainin-2 allows water through more easily. These simulations indicate how all-or-none and graded mechanisms can be structurally different. Adapted with permission from ref . Copyright 2012 American Chemical Society. (D) Permeabilization is complex, as shown with the example of maculatin. The peptide does not form just one structure on a bilayer; it forms a variety of structures that assemble and disassemble over time for both DMPC and DPPC bilayers (bottom). However, it should be noted that most peptides are in the surface bound state (S). (E) Unbiased dye-conductance simulations show that P15A-E19Q, a maculatin double mutant that is thermally stable, forms lesions just large enough to allow ANTS and DPX through (bottom). Importantly, this finding was validated with experimental ANTS/DPX and dextran release assays (top). (D) and (E) are courtesy of Martin B. Ulmschneider. Adapted with permission from ref . Copyright 2016 Springer Nature Limited (CC) https://creativecommons.org/licenses/by/4.0/legalcode.
Figure 16.
Figure 16.
Examples of permeabilization of eukaryotic plasma membranes. A: Cells in culture were treated with calcein red orange acetoxy methylester, which freely crosses the cell and is activated by cellular esterases to become entrapped and membrane impermeant (red, upper left). At the same time STYOX Green, a membrane impermeant DNA binding dye is added to the outside of the cells. Membrane permeabilization, as with MelP5 in the upper right, enables entry of SYTOX Green where it enter the nucleus and becomes fluorescent, B: In this confocal microscopy image, cell membranes are labelled green and a 3,000 Da dextran labelled with TAMRA (red) is added outside the cells. Shortly after addition of a membrane permeabilizing peptide in the corner, the first cells exposed are permeabilized to the dextran and they show osmotic swelling. The cells in the opposite corner have not yet been affected by peptide. C: Cell membranes are labelled red and cells are incubated with external SYTOX Green. A low concentration of the Ebola Virus delta peptide, a viroporin was added 10 min prior to taking this image. Here cells have been permeabilized to SYTOX Green, which stains the nuclei, but massive water influx and osmotic lysis are not occurring, evidenced by the lack of swelling or cell rounding at this time. D: TAMRA-labelled cell penetrating peptide (Arg9-TAMRA) and a spontaneous membrane translocating peptide TP2-TAMRA are incubated with cells at a low concentration of ~1 μM. The CPP gets untaken into endosomes, but cannot escape into the cytosol, in this case, because its concentration is too low to disrupt the membrane. The translocating peptide spontaneously crosses the plasma membrane and enters the cytosol. We thank Kalina Hristova for generous access to her confocal microscope.
Figure 17.
Figure 17.
EM images of bacteria treated with AMPs. Top: SEM micrograph of E. coli ATCC 25922 (A) Control; (B-E) synthetic centrosymmetric α-helical AMP GG2, GG3, AA2 and AA3 treated; (F)MPP melittin treated. Bacterial cells were treated with 1X minimum bactericidal concentration (MBC) of peptide for 1 hour. Adapted with permission from ref . Copyright 2015 Nature Publishing Group. Bottom: TEM micrographs of E. coli ATCC 25922: 25922 (A) Control; (B-E) synthetic centrosymmetric α-helical AMP GG2, GG3, AA2 and AA3 treated; (F)MPP melittin treated. Bacterial cells were treated with 1X minimum bactericidal concentration (MBC) of peptide for 1 hour. Scale Bar = 500nm. Adapted with permission from ref Copyright 2015 Nature Publishing Group.
Figure 18.
Figure 18.
Statistics and stoichiometries in permeabilization experiments. Three tables of statistics and stoichiometries of permeabilization experiments. Top: Vesicle statistics for LUV and GUV, assuming a size of 10 μm for the GUV. Entrapped probes are assumed to be 10 mM for LUVs which use dye quenching as a probe, and 10 μM for GUVs which use dye observation in confocal microscopy as a probe. Typical experimental conditions for LUV and GUV experiments assuming 10 μM peptide concentration a mole fraction partition coefficient equal to that of melittin, Kx = 5×10⁵. Lipid concentration in the GIV experiment is assumed to be very low (a few vesicles per μl. Bottom: Stoichiometries for biosystem permeabilization experiments. Lipids per cell is calculated from surface area using 70 Å2 per lipid molecule, and multiplying by 2 for each membrane present.
Figure 19.
Figure 19.
Meta-analysis of membrane permeabilizing peptides. A representative set of high quality published results was aggregated to show the range of behaviors observed for the permeabilization of synthetic vesicles by MPPs. A: Charge distribution in the dataset. The colors used here are the same colors used in panels C and D. B: Distribution of the total peptide to lipid ratio required to release 50% of vesicle-entrapped contents, or LIC50. C: LIC50 plotted as a function of acidic lipid content (PG, PS, ganglioside, cardiolipin). The peptide charge states are shown by the color of the points, as shown in panel A. Random noise is added to the X-axis values to spread out the data points. D: LIC50 plotted as a function of cholesterol content. The peptide charge states are shown by the color of the points, E: LIC50 plotted as a function of acidic lipid content (PG, PS, ganglioside, cardiolipin) for a subset of well-studied peptides. F LIC50 plotted as a function of cholesterol content for a subset of well-studied peptides.
Figure 20:
Figure 20:
Experimental and simulated permeabilization of LUVs. We simulate vesicle leakage using simple numerical models. A: Transient leakage has a constant exponential rise toward a final value that itself depends on the P:L in the experiment. Many leakage experiments have behavior like this. The exponential rise assumes that the fraction of remaining entrapped contents released per unit time is constant. The plot on the right shows potency profile in a semi-log plot. B: Simple equilibrium leakage model assumes an exponential rise towards 100% release where the rate (the fraction of remaining entrapped contents released per unit time) is a function of peptide concentration. This behavior is rarely observed. The plots on the right shows potency profile at 30 minutes in a semi-log plot. C: Hybrid leakage, assumes that there is a major component of transient leakage, followed by a low level steady equilibrium release. Many peptides have this behavior. D: Real experimental leakage curves for various MPPs taken from the authors’ manuscripts. Real curves like all three of these simulations are seen in this set. The plots on the right shows various potent curves taken from the authors’ manuscripts. They range from high potency MPPs (e.g. alamethicin) that release ~100% of contents at P:L=1:2000, to some AMPs or analogs that release almost nothing at P:L of 1:10. Peptides, lipid compositions and other details vary in these curves.

Similar articles

Cited by

References

    1. Wiener MC; White SH Structure of a Fluid Dioleoylphosphatidylcholine Bilayer Determined by Joint Refinement of X-Ray and Neutron Diffraction Data. III. Complete Structure. Biophys. J 1992, 61, 434–447. - PMC - PubMed
    1. Wimley WC Describing the Mechanism of Antimicrobial Peptide Action with the Interfacial Activity Model. ACS Chemical Biology 2010, 905–917. - PMC - PubMed
    1. Bechinger B Rationalizing the Membrane Interactions of Cationic Amphipathic Antimicrobial Peptides by Their Molecular Shape. Curr. Opin. Colloid Interface Sci 2009, 14, 349–355.
    1. Bechinger B; Lohner K Detergent-like Actions of Linear Amphipathic Cationic Antimicrobial Peptides. Biochim. Biophys. Acta - Biomembr 2006, 1758, 1529–1539. - PubMed
    1. Rathinakumar R; Wimley WC Biomolecular Engineering by Combinatorial Design and High-Throughput Screening: Small, Soluble Peptides That Permeabilize Membranes. J. Am. Chem. Soc 2008, 130, 9849–9858. - PMC - PubMed

Publication types