. 2019 Mar 1;30(5):591-606.
doi: 10.1091/mbc.E18-08-0524. Epub 2019 Jan 9.

Compositional reorganization of the nucleolus in budding yeast mitosis

Affiliations

Compositional reorganization of the nucleolus in budding yeast mitosis

Philipp Girke et al. Mol Biol Cell. .

Abstract

The nucleolus is a membraneless organelle of the nucleus and the site of rRNA synthesis, maturation, and assembly into preribosomal particles. The nucleolus, organized around arrays of rRNA genes (rDNA), dissolves during prophase of mitosis in metazoans, when rDNA transcription ceases, and reforms in telophase, when rDNA transcription resumes. No such dissolution and reformation cycle exists in budding yeast, and the precise course of nucleolar segregation remains unclear. By quantitative live-cell imaging, we observed that the yeast nucleolus is reorganized in its protein composition during mitosis. Daughter cells received equal shares of preinitiation factors, which bind the RNA polymerase I promoter and the rDNA binding barrier protein Fob1, but only about one-third of RNA polymerase I and the processing factors Nop56 and Nsr1. The distribution bias was diminished in nonpolar chromosome segregation events observable in dyn1 mutants. Unequal distribution, however, was enhanced by defects in RNA polymerase I, suggesting that rDNA transcription supports nucleolar segregation. Indeed, quantification of pre-rRNA levels indicated ongoing rDNA transcription in yeast mitosis. These data, together with photobleaching experiments to measure nucleolar protein dynamics in anaphase, consolidate a model that explains the differential partitioning of nucleolar components in budding yeast mitosis.


Figures

FIGURE 1:
FIGURE 1:
Differential segregation of nucleoplasm and chromatin. Fluorescence microscopy of the nucleoplasmic protein mCherry-NLS and the endogenous histone H2A-GFP in the course of mitosis. t = 0 is the first point in time with completely segregated mother and daughter signals in the GFP-channel. Scale bar, 5 µm. The box plot illustrates the percentage of the total nuclear signal inherited by daughter cells (n = 12; ***p < 0.001).
FIGURE 2:
FIGURE 2:
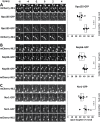
Differential segregation of nucleolar proteins. (A–J) Fluorescence microscopy showing colocalization of mCherry-NLS with endogenous (A) Rpa190-GFP, (B) Rpa135-GFP, (C) Rpa43-GFP, (D) Nop56-GFP, (E) Nsr1-GFP, (F) Rrn6-GFP, (G) Rrn7-GFP, (H) Rrn5-GFP, (I) Rrn10-GFP, and (J) Fob1-GFP in the course of mitosis. t = 0 is the first point in time with completely segregated mother and daughter signals in the GFP channel. Scale bars, 5 µm. The box plot illustrates the percentage of total nuclear signal inherited by daughter cells (from left to right: n = 12, 11, 11, 10, 10, 11, 10, 10, 10, 12; **p < 0.01).
FIGURE 3:
FIGURE 3:
Low internucleolar protein exchange in anaphase. (A–C) Cobleaching of mCherry-NLS and (A) Rpa135-GFP, (B) Nop56-GFP, and (C) Nsr1-GFP in the mother cell body of mid-anaphase cells. Bleaching of the indicated areas (yellow outlines) was done for 26 s. Images before bleaching (pre), immediately after bleaching (0 min), and 4 min after bleaching (4 min) are shown. Scale bars, 5 µm. The bar graphs depict signal intensities in mother and daughter cell bodies normalized to the prebleach image. Unbleached cells were used as controls. Mean values and SDs are shown (n = 5).
FIGURE 4:
FIGURE 4:
Nonpolar rDNA segregation in a dyn1 mutant. A tetO array was introduced at the telomere-proximal flank of the rDNA locus and visualized by tetR GFP. (A) Mitotic segregation of the rDNA dot with Nop56-3mCherry as comarker. Scale bar, 5 µm. t = 0 is set arbitrarily. (B, C) Mitotic segregation of the rDNA-dot and Spc42-3mCherry in dyn1 cells elongating the mitotic spindle through the bud neck, B, or inside the mother cell body, C. t = 0 is the last point in time with SPB-SPB distance <3 µm. Scale bars, 5 µm. (D) SPB–SPB distance in RRN3 and rrn3 ts cells over time. Mean values and SDs (n = 10). (E) Percentage of dyn1 cells (spindle elongation through the bud neck or inside the mother, respectively) showing segregated rDNA dots (distance permanently >1 µm) over time. (F) Distance of rDNA dot and SPB over time for mother- and daughter-directed chromatids when segregation proceeds through the bud neck. Mean values and SDs. (G) Distance of rDNA dot and SPB over time for mother- and daughter-directed chromatids when segregation is confined to the mother cell (SPB and rDNA dot closer to the bud are termed daughter-directed). Mean values and SDs are shown. (H) Scheme to illustrate the distances measured in D–G.
FIGURE 5:
FIGURE 5:
Decreased asymmetry of pol I and processing factors in nonpolar chromosome segregation events of dyn1 mutant cells. (A–C) Colocalization of mCherry-NLS and (A) Rpa135-GP, (B) Nop56-GFP, and (C) Nsr1-GFP in mitotic dyn1 mutant cells. Most cells performed a regular nuclear division through the bud neck (top panels). A minority (5%) segregated the nucleolus inside the mother cell body (at least three time points with segregated structures inside the mother cell body; signal closer to bud neck regarded as daughter nucleolus). t = 0 is the first point in time with completely segregated signals in the GFP channel. Scale bars, 5 µm. Box plots depict the percentage of total signal inherited by daughter cells in regular mitotic divisions (top) or segregated to the bud neck–proximal nucleolus in the case of division inside the mother cell (bottom). From top to bottom: n = 10, 9; 10, 10; 10, 10; **p < 0.01; ***p < 0.001.
FIGURE 6:
FIGURE 6:
Increased asymmetry of pol I and processing factors in an rrn3 ts mutant. (A, B) Line intensity profiles depicting the maximum-intensity distribution of mCherry-NLS and Rpa135-GFP in interphase and anaphase (last time point showing unsegregated signal) for wild-type and rrn3 ts cells at 37°C, respectively. (C–F) Mitotic segregation of (C) Rpa135-GFP, (D) Nop56-GFP, (E) Nsr1-GFP, and (F) Fob1-GFP in RRN3 and rrn3 ts cells at 37°C. Rrn3 was inactivated in growing, nonsynchronized cells by a shift to 37°C for 30 min before time series of 28 min at 37°C were acquired. t = 0 is the first point in time with completely segregated mother and daughter signals in the GFP-channel. Scale bars, 5 µm. Box plots depict the percentage of total nuclear signal inherited by daughter cells (from top to bottom: n = 12, 12; 10, 10; 11, 11; 10, 10; *p < 0.05; **p < 0.01; ***p < 0.001).
FIGURE 7:
FIGURE 7:
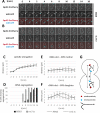
Altered timing of rDNA segregation in an rrn3 ts mutant. A tetO array was introduced at the telomere-proximal flank of the rDNA locus and visualized by tetR-GFP. (A, B) Mitotic segregation of the rDNA dot and Spc42-3mCherry in (A) RRN3 and (B) rrn3 ts cells at 37°C. Rrn3 was inactivated in growing, nonsynchronized cells by a shift to 37°C for 30 min before time series of 28 min at 37°C were acquired. t = 0 is the last point in time with SPB–SPB distance <3 µm. Scale bars, 5 µm. (C) SPB–SPB distance in RRN3 and rrn3 ts cells over time. Mean values and SDs (n = 10). (D) Percentage of RRN3 and rrn3 ts cells showing segregated rDNA dots (distance permanently >1 µm) over time. (E) Distance of rDNA dot and SPB over time for mother-directed chromatids in RRN3 and rrn3 ts cells. Mean values and SDs are given. (F) Distance of rDNA dot and SPB over time for daughter-directed chromatids in RRN3 and rrn3 ts cells. Mean values and SDs are given. (G) Scheme to illustrate the distances measured in C–F.
FIGURE 8:
FIGURE 8:
Increased asymmetry of pol I and processing factors in a rpa12 mutant. (A–D) Mitotic segregation of (A) Rpa135-GFP, (B) Nop56-GFP, (C) Nsr1-GFP, and (D) Fob1-GFP in RPA12 and rpa12 cells. t = 0 is the first point in time with completely segregated mother and daughter signals in the GFP channel. Scale bars, 5 µm. Box plots depict the percentage of total nuclear signal inherited by daughter cells (from top to bottom: n = 13, 12; 17, 15; 12, 14; 10, 10; *p < 0.05; **p < 0.01; ***p < 0.001).
FIGURE 9:
FIGURE 9:
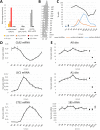
Pre-rRNA levels throughout the cell cycle. (A–E) bar1 cells were synchronized by a pheromone induced G1 arrest and release into fresh medium. (A) Maximum change of RNAs in the synchronized culture over time compared with the change of RNAs in RRN3 wild-type and rrn3 ts mutant cells following shift from 25 to 37°C for 30 min. (B, C) Synchrony of the culture was tested by flow cytometry providing DNA-profiles (1C, G1 cells; 2C, G2 and M cells) (B) and counting of DAPI stained cells (n = 100) to follow nuclear division (C). (D) Levels of CLB2, SIC, and CTS1 mRNAs in the synchronized culture shown as fold actin mRNA. (E) Levels of the pre-rRNA portion spanning the cleavage sites A0 and A1 and an 18S rRNA segment are shown as fold actin mRNA. Fold actin mRNA values for cycling cells at 25°C and for RRN3 wild-type and rrn3 ts mutant cells after 30 min at 37°C are shown for comparison. Means and SDs for three qPCR replicas are shown.
FIGURE 10:
FIGURE 10:
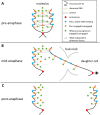
Model for the mitotic inheritance of nucleolar proteins in budding yeast. (A) The nucleolus is a dynamic multicomponent assembly showing a high degree of coherence. Multiple protein–protein, protein–nucleic acid, and nucleic acid–nucleic acid interactions contribute to this behavior. Active and inactive factors can reside in the nucleolus. (B) During anaphase, the chromatid transmitted from the mother to the daughter cell body undergoes stretching and recoiling. Transcription by pol I in anaphase causes efficient association of pol I and processing factors with rDNA. This results in cohesive forces between rDNA sister arrays and facilitates efficient transport of the engaged rRNA transcription and processing machineries into the daughter nucleus. (C) Following anaphase, mother and daughter nucleoli contain equal numbers of proteins stably binding to rDNA. The noncollectively and nonpermanently associated transcription and processing components are inherited asymmetrically.

Similar articles

Cited by

References

    1. Albert B, Mathon J, Shukla A, Saad H, Normand C, Leger-Silvestre I, Villa D, Kamgoue A, Mozziconacci J, Wong H, et al (2013). Systematic characterization of the conformation and dynamics of budding yeast chromosome XII. J Cell Biol , 201–210. - PMC - PubMed
    1. Albert B, Perez-Fernandez J, Leger-Silvestre I, Gadal O. (2012). Regulation of ribosomal RNA production by RNA polymerase I: does elongation come first? Genet Res Int , 276948. - PMC - PubMed
    1. Arnold L, Hockner S, Seufert W. (2015). Insights into the cellular mechanism of the yeast ubiquitin ligase APC/C-Cdh1 from the analysis of in vivo degrons. Mol Biol Cell , 843–858. - PMC - PubMed
    1. Ausubel FM, Brent R, Kingston RE, Moore DD, Seidman JG, Smith JA, Struhl K. (eds.) (2005). Current Protocols in Molecular Biology, New York: John Wiley & Sons.
    1. Barandun J, Chaker-Margot M, Hunziker M, Molloy KR, Chait BT, Klinge S. (2017). The complete structure of the small-subunit processome. Nat Struct Mol Biol , 944–953. - PubMed

LinkOut - more resources