. 2019 Mar 1;30(5):646-657.
doi: 10.1091/mbc.E18-10-0639. Epub 2019 Jan 9.

Neuronal drebrin A directly interacts with mDia2 formin to inhibit actin assembly

Affiliations

Neuronal drebrin A directly interacts with mDia2 formin to inhibit actin assembly

Anush A Ginosyan et al. Mol Biol Cell. .

Abstract

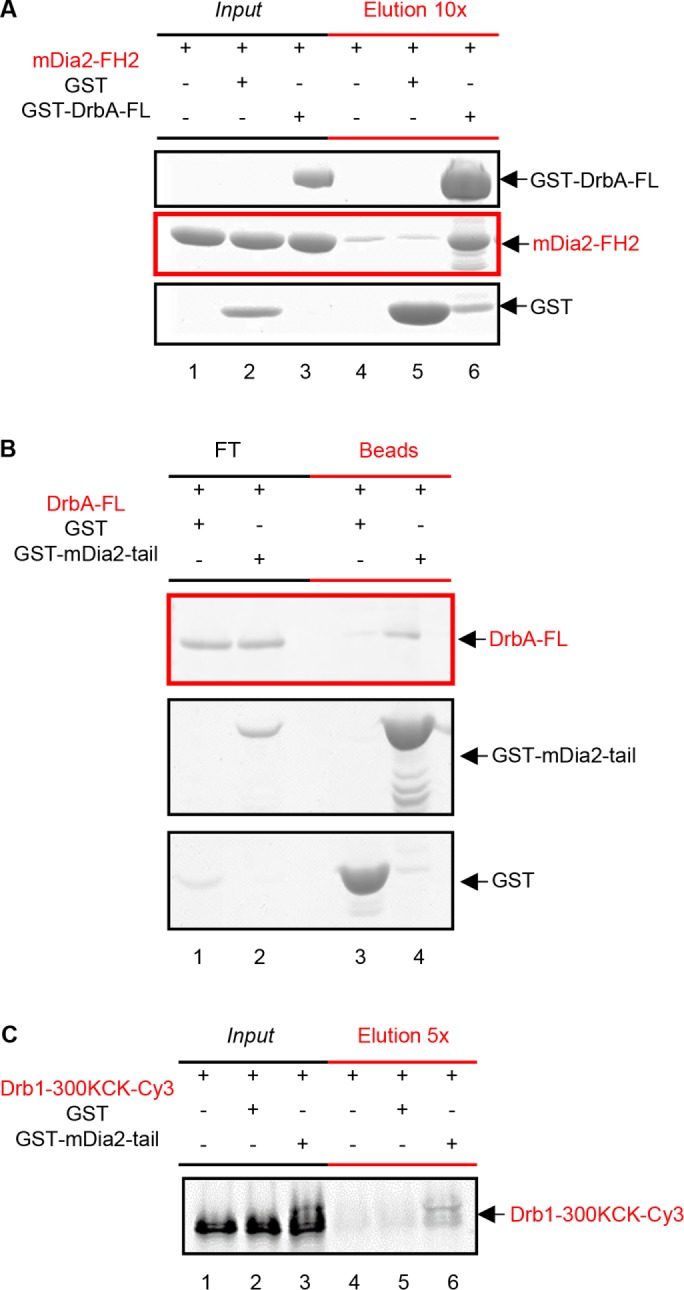
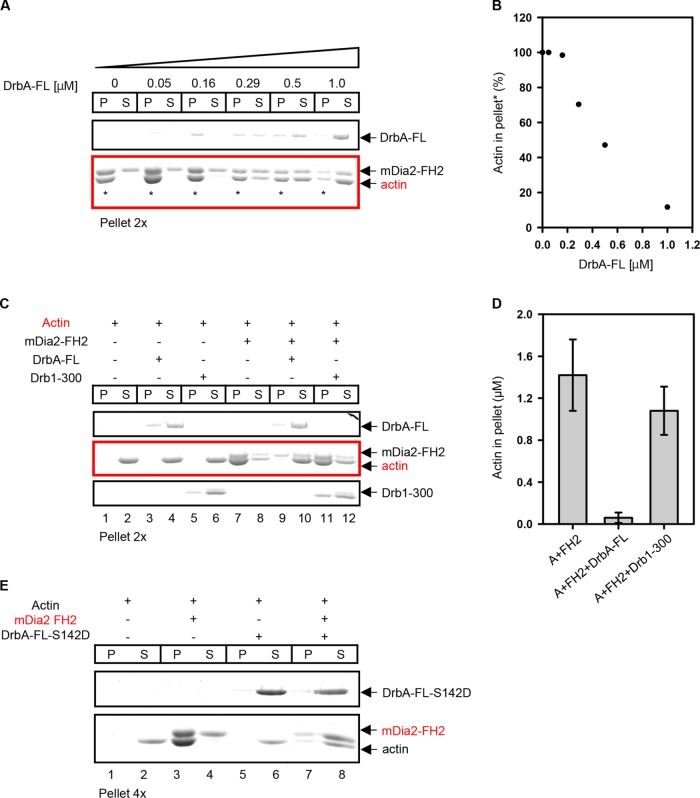
Dendritic spines (DS) are actin-rich postsynaptic terminals of neurons that are critical for higher-order brain functions. Maturation of DS is accompanied by a change in actin architecture from linear to branched filamentous structures. Presumably, the underlying cause of this is a switch in a mode of actin assembly from formin-driven to Arp2/3-mediated via an undefined mechanism. Here we present data suggesting that neuron-specific actin-binding drebrin A may be a part of such a switch. It is well documented that DS are highly enriched in drebrin A, which is critical for their plasticity and function. At the same time, mDia2 is known to mediate the formation of filopodia-type (immature) spines. We found that neuronal drebrin A directly interacts with mDia2 formin. Drebrin inhibits formin-mediated nucleation of actin and abolishes mDia2-induced actin bundling. Using truncated protein constructs we identified the domain requirements for drebrin-mDia2 interaction. We hypothesize that accumulation of drebrin A in DS (that coincides with spine maturation) leads to inhibition of mDia2-driven actin polymerization and, therefore, may contribute to a change in actin architecture from linear to branched filaments.


Figures

FIGURE 1:
FIGURE 1:
Neuronal drebrin A inhibits mDia2-FFC-mediated actin assembly in a concentration-dependent manner. (A) Domain structure of DrbA-FL. Actin Depolymerizing Factor homology domain (ADFhd) is shown in green; helical-charged domain is shown in orange; Actin Binding Domain (ABD) is shown in blue; intrinsically disordered C-terminal region is shown as a solid black line. The amino acid numbering is based on mouse drebrin isoform A (UniProtKB: Q9QXS6; methionine-1 was not present in the protein sequence). (B) DrbA-FL strongly inhibits mDia2-FFC-mediated actin assembly. mDia2-FFC drives rapid assembly of actin (1 µM) in the absence of DrbA-FL (black trace). DrbA-FL inhibits mDia2–FFC-driven actin assembly in a concentration-dependent manner (dark-blue to light-blue traces; 0.05, 0.1, 0.15, 0.2, 0.25, 0.3, 0.4, 0.5, 0.6, and 0.7 µM DrbA-FL, respectively). (C) Quantification of the data shown in B. The concentration of DrbA-FL yielding half-maximum inhibition (IC50) of mDia2-FFC-mediated actin assembly is 70 nM. (D) DrbA-FL inhibits mDia2-FFC-mediated actin (1 µM) assembly in the presence of profilin (5 µM). The concentrations of DrbA-FL used were the same as in B. (E) Quantification of the data shown in D. The concentration of DrbA-FL yielding half-maximum inhibition (IC50) of mDia2-FFC-mediated actin assembly is 40 nM. (F) Domain structure of Drb1–300. The disordered C-terminal region of drebrin has been truncated. (G) The rates of mDia2-FFC-mediated actin assembly decrease as Drb1–300 concentration is increased (black trace: no drebrin added; dark blue to light blue: 0.45, 0.7. 2, 4, 5, 6, 8, and 10 µM Drb1–300, respectively). (H) Quantification of data shown in G. Drb1–300 concentration yielding half-maximum inhibition (IC50) of mDia2-FFC-mediated actin assembly is 810 nM. Conditions: [Actin] = 1 µM (10% pyrene-maleimide labeled); mDia2-FFC = 30 nM (B, C, D, E, F, and H). Additionally, 5 µM profilin was present in D and E. Buffer: KMEH7 (see Materials and Methods).
FIGURE 2:
FIGURE 2:
Effects of drebrin on actin nucleation and elongations assessed in TIRF microscopy assays. (A–C) Representative images showing drebrin inhibition of mDia2-mediated nucleation of profilin–actin complexes. Actin polymerization (15% Alexa488SE-labeled) was started by the addition of polymerizing salts and the indicated proteins. After 10 min, F-actin was diluted with imaging buffer and immobilized on polyK-treated coverslip. Representative fields are shown. Conditions: [Actin] = 2 µM; [Profilin] = 10 μM; mDia2-FFC = 30 nM; [DrbA-FL] or [Drb1–300] = 0.7 µM. (D) Rates of actin filaments elongation determined from time-lapse TIRF microscopy experiments in the absence and presence of drebrin constructs. Left panel: without formin; Right panel: in the presence of mDia2-FFC formin construct. The rates that are not representative of the mDia2-driven actin assembly are under the dashed line (bottom-right panel). Actin filaments that were elongating at slower rates than those in the “actin-profilin-DrbA-FL” sample are encircled (right panel). Conditions: [Actin] = 0.5 µM; [profilin] = 2.5 µM; [mDia2-FFC] = 1.5–3 nM; [DrbA-FL] or [Drb1–300] = 0.7 µM. (E) Population size of fast and slow F-actin elongation events observed in the samples (graphic representation of data in D, right panel). We used “FFC only” control (D, right panel, green dots) to define the fast population. In this sample, two populations of elongating filaments are evident: main (fast, n = 21 events) and minor (slow, n = 3 events) populations. The mean rate of the fast population in “FFC only” samples was 17.3 ± 2.7 subunits/s (n = 21 events). We defined fast elongation events in all three samples as those with elongation rates = mean ± 2 SD of the fast population in “FFC only” samples (white part of the bar). Populations of slow and intermediate elongating events are represented by a gray part of the bar. Note that we observed an increase in population size of slow elongating filaments with both DrbA-FL and Drb1–300. The numbers of filaments switching their elongation rates within observation time are shown for all samples in the bottom panel. Rare instances of filaments capped by photo-induced actin dimers (depolymerizing under our conditions) were excluded from the analysis.
FIGURE 3:
FIGURE 3:
Domain requirements for drebrin-induced inhibition of mDia2-driven actin assembly. Graphic representations of proteins present in the reactions (except for drebrin constructs) are shown in each panel. The FH1, FH2, and C-terminal tail domains of mDia2 are shown in blue, gray, and orange, respectively. Green spheres represent actin. Each panel demonstrates the effects of DrbA-FL and Drb1–300 on the rates of actin assembly by mDia2-FFC (A) or its C-terminal tail missing version, mDia2-FF (B) (shown as an orange line in the schematics). In each panel (A, B) white, gray, and black bars represent actin assembly rates when no drebrin, DrbA-FL, or Drb1–300, respectively, are added. (A) Actin assembly mediated by mDia2-FFC is inhibited strongly in the presence of DrbA-FL. This inhibition is weaker in the presence of Drb1–300. (B) Actin assembly mediated by mDia2-FF is partially inhibited in the presence of DrbA-FL but not in the presence of Drb1–300. Note that the error bar in the no-drebrin condition is too small to be visible. Representative sets of data are shown. Error bars mean ± SD (n = 3 replicates). Conditions: [Actin] = 1 µM (10% pyrene-maleimide); [mDia2-FFC] = 30 nM; [DrbA-FL] = 0.25 µM; [Drb1–300] = 7 µM. Buffer: KMEH7.
FIGURE 4:
FIGURE 4:
Drebrin A is a novel binding partner of mDia2. (A) GST-DrbA-FL directly binds mDia2-FH2. GST or GST-DrbA-FL (1 µM) was incubated with mDia2-FH2 (2 µM) at 4°C overnight (lanes 1–3, Input). These samples were applied to glutathione-Sepharose beads, incubated for 3 h at 4°C, and then eluted with a volume of glutathione, 1/10th of the input volume (lanes 4–6, Elution 10x). Samples were analyzed by SDS–PAGE and Coomassie Blue staining. Note that mDia2-FH2 does not significantly bind beads or GST alone (lanes 4 and 5, red-lined panel), but coelutes with GST-DrbA-FL (lane 6, red-lined panel). Buffer: KMEH7, 0.5 mM Thesit, 0.05% IGEPAL CA 630. (B) GST-mDia2-tail binds substoichiometric amounts of DrbA-FL. GST or GST-mDia2-tail (2 µM) was incubated with DrbA-FL (1 µM) and glutathione-Sepharose beads for 2 h at 4°C. Flow-through (FT, lanes 1 and 2) and beads (lanes 3 and 4) were analyzed by SDS–PAGE and Coomassie Blue staining. Note that DrbA-FL binds GST-mDia2-tail (lane 4, red-lined panel) to a much greater extent than GST alone (lane 3, red-lined panel). Buffer: KMEH7, 0.5 mM Thesit. (C) GST-mDia2-tail binds sub-stoichiometric amounts of Drb1–300KCK-Cy3. GST or GST-mDia2-tails (2 µM) were incubated with Cy3-labeled Drb1–300 (1 µM) at 4°C overnight (lanes 1–3, Input). These samples were applied to glutathione-Sepharose beads, incubated for 3 h at 4°C, and then eluted with a volume of glutathione, 1/5th of the input volume (lanes 4–6, Elution 5×). Samples were analyzed by SDS–PAGE and then visualized using Cy3 fluorescence. Note that Drb1–300 KCK-Cy3 binds very weakly to beads or GST alone (lanes 4 and 5), but coelutes with GST-mDia2-tail (lane 6). Buffer: KMEH7, 0.5 mM Thesit, 0.05% IGEPAL CA 630.
FIGURE 5:
FIGURE 5:
Drebrin A inhibits bundling of filamentous actin by mDia2. (A) DrbA-FL inhibits mDia2–FH2-induced F-actin bundling in a concentration-dependent manner. Increasing amounts of DrbA-FL (0, 0.05, 0.15, 0.29, 0.50, and 1 µM) were added to mDia2-FH2 (0.8 µM) and F-actin (2 µM). Low-speed pellets were concentrated twofold to aid in protein quantification. Note that as DrbA-FL concentration increases, the amount of actin in the low-speed pellet decreases (lanes denoted with asterisks, red box), whereas the amount of actin in the supernatant increases. (B) Amounts of F-actin bundled by mDia2-FH2 in the presence of DrbA-FL. Quantification of the data shown in the red box panel of A (in lanes marked with asterisk). (C) C-terminal truncation of drebrin sequence dramatically reduces its inhibitory effect on mDia2–FH2-induced F-actin bundling. Either DrbA-FL (0.85–1 µM) or Drb1–300 (1.9 µM) was added to mDia2-FH2 (0.8 µM) and phalloidin-stabilized F-actin (2 µM). Pellets were concentrated twofold to aid in quantification. Note that no bundling (actin in pellet) is detected with actin alone and both drebrin constructs (lanes 1–6, red panel). In the presence of mDia2-FH2 actin was found in the pellet (lane 7, red panel). DrbA-FL strongly inhibits mDia2-FH2-mediated bundling such that almost no actin was detected in the pellet (lane 9, red panel). However, Drb1–300 did not affect mDia2-FH2-mediated bundling to any considerable extent (lane 11, red panel). (D) Quantification of the amounts of actin in low-speed pellets in the presence of mDia2-FH2 (FH2) and drebrin constructs. Representative gel is shown in C. Error bars: mean ± SD (n = 3 experiments). (E) Phosphomimetic mutant of drebrin A (DrbA-FL-S142D) inhibits mDia2-FH2 F-actin bundling as well as DrbA-FL. DrbA-FL-S142D (1 µM) was added to mDia2-FH2 (0.8 µM) and F-actin (2 µM). Low-speed pellets were concentrated fourfold to aid in their quantification. Note that F-actin alone is not bundled (actin can be detected in the supernatant, lane 2). mDia2-FH2 bundles F-actin (actin can be detected in the pellet, lane 3, red panel). When DrbA-S142D is introduced, mDia2-FH2-mediated bundling of F-actin is inhibited (actin is mostly in the low-speed supernatant; compare lanes 7 and 8, red panel).
FIGURE 6:
FIGURE 6:
mDia2-FH2 and drebrin constructs codecorate F-actin. (A) High-speed sedimentation of DrbA-FL and Drb1–300 with F-actin and mDia2-FH2. DrbA-FL (0.85 µM) or Drb1–300 (1.9 µM) was added to mDia2-FH2 (0.8 µM) and F-actin (2 µM). Note that both mDia2-FH2 and drebrin constructs are detected in high-speed pellets, with the formin construct band just above the actin band (lanes 9 and 11). (B) DrbA-FL, unlike Drb1–300, partially displaces mDia2-FH2 (FH2) from F-actin. Quantification of data shown in A. Error bars: mean ± SD (n = 3 experiments). (C) Proposed working model of mDia2–drebrin A interaction. FH1, FH2, and C-terminal tail of mDia2 formin are shown in dark blue (line), gray, and orange (line), respectively. The N-terminal sequence of drebrin is shown as a tricolored box, and the intrinsically disordered C-terminal part of drebrin is shown as a black line. Strong drebrin binding to mDia2 requires two interaction sites. High-affinity binding between the FH2 domain of formin and the C-terminal part of drebrin guides its interaction with the second interacting site within formin tails. Drebrin interaction with isolated mDia2-tails is weak but it is improved in mDia2-FFC construct due to the increase of local drebrin concentration near the formin’s tails.

Similar articles

Cited by

References

    1. Alberts AS. (2001). Identification of a carboxyl-terminal diaphanous-related formin homology protein autoregulatory domain. J Biol Chem , 2824–2830. - PubMed
    1. Alioto SL, Garabedian MV, Bellavance DR, Goode BL. (2016). Tropomyosin and profilin cooperate to promote formin-mediated actin nucleation and drive yeast actin cable assembly. Curr Biol , 3230–3237. - PMC - PubMed
    1. Almuqbil M, Hamdan FF, Mathonnet G, Rosenblatt B, Srour M. (2013). De novo deletion of FMN2 in a girl with mild non-syndromic intellectual disability. Eur J Med Genet , 686–688. - PubMed
    1. Bertling E, Hotulainen P. (2017). New waves in dendritic spine actin cytoskeleton: from branches and bundles to rings, from actin binding proteins to post-translational modifications. Mol Cell Neurosci , 77–84. - PubMed
    1. Breitsprecher D, Goode BL. (2013). Formins at a glance. J Cell Sci (Pt 1), 1–7. - PMC - PubMed

Publication types