. 2019 Jan 9;14(1):e0209068.
doi: 10.1371/journal.pone.0209068. eCollection 2019.

Using machine learning and an ensemble of methods to predict kidney transplant survival

Affiliations

Using machine learning and an ensemble of methods to predict kidney transplant survival

Ethan Mark et al. PLoS One. .

Abstract

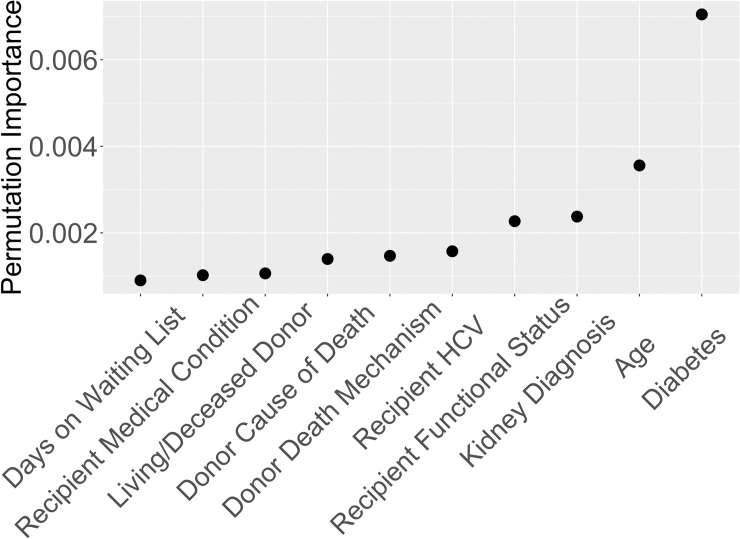
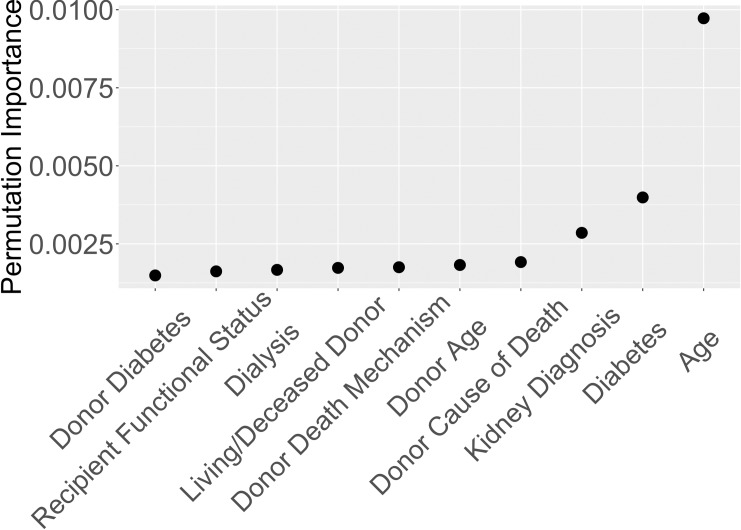
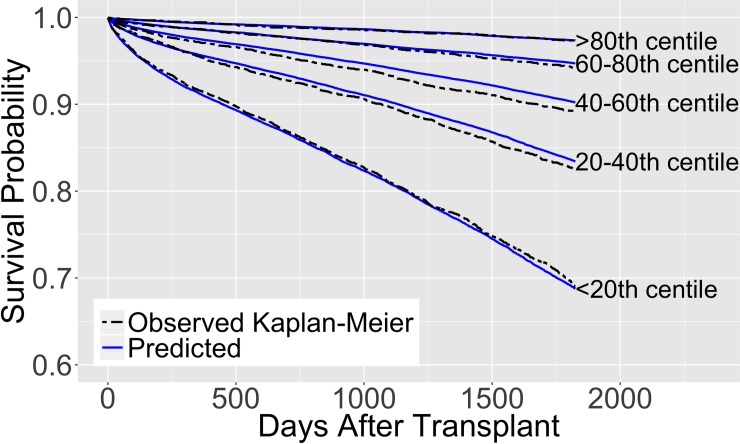
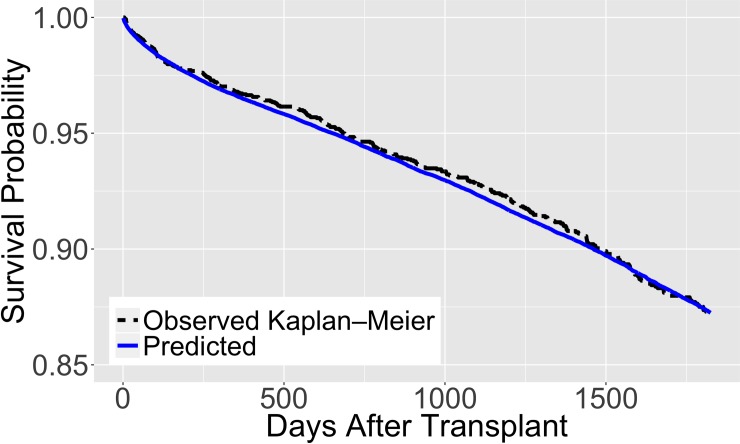
We used an ensemble of statistical methods to build a model that predicts kidney transplant survival and identifies important predictive variables. The proposed model achieved better performance, measured by Harrell's concordance index, than the Estimated Post Transplant Survival model used in the kidney allocation system in the U.S., and other models published recently in the literature. The model has a five-year concordance index of 0.724 (in comparison, the concordance index is 0.697 for the Estimated Post Transplant Survival model, the state of the art currently in use). It combines predictions from random survival forests with a Cox proportional hazards model. The rankings of importance for the model's variables differ by transplant recipient age. Better survival predictions could eventually lead to more efficient allocation of kidneys and improve patient outcomes.


Conflict of interest statement

The authors have declared that no competing interests exist.

Figures

Fig 1
Fig 1. Survival probabilities of different transplant cohorts.
The survival probabilities are calculated from the Kaplan-Meier estimate.
Fig 2
Fig 2. Variable importance for recipients ages 50 and under based on Breiman-Cutler permutation importance.
Fig 3
Fig 3. Variable importance for recipients ages 51 and older based on Breiman-Cutler permutation importance.
Fig 4
Fig 4. Cox lasso variable selection for recipients ages 50 and under.
The top row represents the number of non-zero coefficients per Lasso penalty value, lambda. The vertical line L0 corresponds to the optimal penalty, which minimizes the PLD. The line Lσ corresponds to the largest penalty value corresponding to the PLD values within one standard deviation of the minimum PLD.
Fig 5
Fig 5. Predicted survival of the proposed model.
Trained on 100,000 observations and validated on 25,000 out-of-sample observations. The survival curves are separated into 5 groups based on the predicted 5-year survival in the out-of-sample data.
Fig 6
Fig 6. Predicted survival of the proposed model for a ‘typical’ kidney transplant recipient.
Trained on 100,000 observations and validated on 25,000 out-of-sample observations. In the out-of-sample data, an observation is considered ‘typical’ if the values are within one standard deviation of the mean for recipient age, donor age, and cold ischemia time, and the most common values from the data for recipient diabetes, recipient dialysis status, recipient medical condition, and donor hypertension status.

References

    1. Clayton PA, McDonald SP, Snyder JJ, Salkowski N, Chadban SJ. External validation of the estimated posttransplant survival score for allocation of deceased donor kidneys in the United States. Am J Transplant. 2014;14(8):1922–6. 10.1111/ajt.12761 - DOI - PubMed
    1. A guide to calculating and interpreting the Estimated Post-Transplant Survival (EPTS) score used in the Kidney Allocation System (KAS). 2014. Available from: https://optn.transplant.hrsa.gov/media/1511/guide_to_calculating_interpr....
    1. Baskin-Bey ES, Kremers W, Nyberg SL. A recipient risk score for deceased donor renal allocation. Am J Kidney Dis. 2007;49(2):284–93. 10.1053/j.ajkd.2006.10.018 - DOI - PubMed
    1. Wolfe RA, McCullough KP, Leichtman AB. Predictability of survival models for waiting list and transplant patients: calculating LYFT. Am J Transplant. 2009;9(7):1523–7. 10.1111/j.1600-6143.2009.02708.x - DOI - PubMed
    1. Cox DR. Regression models and life-tables. J R Stat Soc Series B Stat Methodol. 1972;34(2):187–220.

Publication types