Interpretation of CVD risk predictions in clinical practice: Mission impossible?
- PMID: 30625177
- PMCID: PMC6326414
- DOI: 10.1371/journal.pone.0209314
Interpretation of CVD risk predictions in clinical practice: Mission impossible?
Abstract
Background: Cardiovascular disease (CVD) risk prediction models are often used to identify individuals at high risk of CVD events. Providing preventive treatment to these individuals may then reduce the CVD burden at population level. However, different prediction models may predict different (sets of) CVD outcomes which may lead to variation in selection of high risk individuals. Here, it is investigated if the use of different prediction models may actually lead to different treatment recommendations in clinical practice.
Method: The exact definition of and the event types included in the predicted outcomes of four widely used CVD risk prediction models (ATP-III, Framingham (FRS), Pooled Cohort Equations (PCE) and SCORE) was determined according to ICD-10 codes. The models were applied to a Dutch population cohort (n = 18,137) to predict the 10-year CVD risks. Finally, treatment recommendations, based on predicted risks and the treatment threshold associated with each model, were investigated and compared across models.
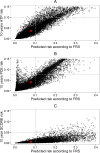
Results: Due to the different definitions of predicted outcomes, the predicted risks varied widely, with an average 10-year CVD risk of 1.2% (ATP), 5.2% (FRS), 1.9% (PCE), and 0.7% (SCORE). Given the variation in predicted risks and recommended treatment thresholds, preventive drugs would be prescribed for 0.2%, 14.9%, 4.4%, and 2.0% of all individuals when using ATP, FRS, PCE and SCORE, respectively.
Conclusion: Widely used CVD prediction models vary substantially regarding their outcomes and associated absolute risk estimates. Consequently, absolute predicted 10-year risks from different prediction models cannot be compared directly. Furthermore, treatment decisions often depend on which prediction model is applied and its recommended risk threshold, introducing unwanted practice variation into risk-based preventive strategies for CVD.
Conflict of interest statement
The authors have declared that no competing interests exist.
Figures

References
-
- Beswick, A.D., et al., in A Systematic Review of Risk Scoring Methods and Clinical Decision Aids Used in the Primary Prevention of Coronary Heart Disease (Supplement). 2008: London. - PubMed
MeSH terms
LinkOut - more resources
Full Text Sources

