. 2019 Apr:124:531-543.
doi: 10.1016/j.nbd.2019.01.001. Epub 2019 Jan 6.

Human and rodent temporal lobe epilepsy is characterized by changes in O-GlcNAc homeostasis that can be reversed to dampen epileptiform activity

Affiliations

Human and rodent temporal lobe epilepsy is characterized by changes in O-GlcNAc homeostasis that can be reversed to dampen epileptiform activity

Richard G Sánchez et al. Neurobiol Dis. 2019 Apr.

Abstract

Temporal Lobe Epilepsy (TLE) is frequently associated with changes in protein composition and post-translational modifications (PTM) that exacerbate the disorder. O-linked-β-N-acetyl glucosamine (O-GlcNAc) is a PTM occurring at serine/threonine residues that is derived from and closely associated with metabolic substrates. The enzymes O-GlcNActransferase (OGT) and O-GlcNAcase (OGA) mediate the addition and removal, respectively, of the O-GlcNAc modification. The goal of this study was to characterize OGT/OGA and protein O-GlcNAcylation in the epileptic hippocampus and to determine and whether direct manipulation of these proteins and PTM's alter epileptiform activity. We observed reduced global and protein specific O-GlcNAcylation and OGT expression in the kainate rat model of TLE and in human TLE hippocampal tissue. Inhibiting OGA with Thiamet-G elevated protein O-GlcNAcylation, and decreased both seizure duration and epileptic spike events, suggesting that OGA may be a therapeutic target for seizure control. These findings suggest that loss of O-GlcNAc homeostasis in the kainate model and in human TLE can be reversed via targeting of O-GlcNAc related pathways.

Keywords: Electroencephalogram; Electrophysiology; Hippocampus; Magnetic resonance imaging; Mass spectrometry; O-GlcNAcylation; Post-translational modification; Thiamet-G.


Figures

Figure 1:
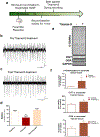
Figure 1:. O-GlcNAcylation and OGT levels decreased in the hippocampus of epileptic rats.
(a) Experimental design. Rats were either injected with saline or kainic acid in order to induce status epilepticus (SE). The animals were then sacrificed eight weeks post-KA injection at which point these animals had become epileptic and the hippocampus was collected for protein analysis. (b) Representative O-GlcNAcylation as well as OGT and actin western blots for controls and epileptic rats. (c) Global O-GlcNAcylation was decreased in epileptic rats in comparison to control. (n=4–6 per group) (d) OGT protein levels were significantly reduced in epilepsy (n=4–6 per group). .* denotes P <0.05 from controls, *** denotes P<0.001 from controls. Unpaired T-Test Error bars are SEM
Figure 2:
Figure 2:. Protein expression and PTM in epilepsy.
(a) The heatmap illustrates all differentially expressed proteins (p<0.05) in epileptic rats (green bar) relative to controls (orange) bar. Each row is a protein indicated by the RefSeq accession number and each column in a biological replicate where the row and column order was determined by the Euclidian clustering method shown by the dendrograms. The protein values are shown as standardized z-scores, where the color indicates the standard deviation increasing (yellow) or decreasing (blue) relative to the mean (black). Grey blocks indicate missing values for the respective biological replicate. Further, for each protein, the top five disorders and GO terms (adjusted p-value<0.05) are annotated in pink and purple respectively. Lastly, the phosphorylation (phospho) fold change and O-GlcNAc levels are indicated for each differentially expressed protein.* denotes P <0.05 from controls, *** denotes P<0.001 from controls. Unpaired T-Test Error bars are SEM
Figure 3:
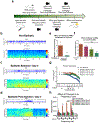
Figure 3:. OGA inhibition decreased seizure duration and epileptiform activity.
(a) Experimental outline. Epileptic rats were created using kainic acid. Four weeks post kainate the rats underwent EEG surgery where cortical electrodes were placed and the animals had a week to recover from the surgery before recordings were initiated. Baseline recordings were taking for 24hrs and Thiamet-G treatment ensued immediately after for three consecutive days followed by euthanization. (b) Cortical baseline EEG spectrogram of a saline (control) treated rat. (c) Cortical baseline EEG spectrogram of an epileptic rat during a seizure. (d) Cortical EEG spectrogram of the same epileptic rat following three days of Thiamet-G treatment. (e) The number of seizures decreased after three days of Thiamet-G treatment between the pre and post-treated animals. (f) Thiamet-G significantly decreased seizure duration by the second day of treatment and continued to decrease seizure duration up to the last day of treatment. (g) A power spectrum analysis demonstrated that the frequencies that were most dampened by Thiamet-G intervention were theta through gamma bands (h) Quantification of the power spectrum illustrates which frequencies were significantly decreased after treatment in comparison to control non-epileptic animals. * denotes P <0.05 from controls, ** denotes P<0.01 from controls, *** denotes P<0.001 from controls, **** denotes P<0.0001 from controls. ^ denotes P<0.10 One-way ANOVA, Error bars are SEM
Figure 4:
Figure 4:. Thiamet-G treatment has no reduction in ventricle expansion or protein specific changes in O-GlcNAcylation.
(a) Experimental outline of animal model and treatment. Epileptic animals were created with kainic acid. Eight weeks post-kainate the animals had their first T2 scans were taken. Immediately following the scan, animals were treated with Thiamet-G (10mg/kg/day) for 2 weeks at the same time each day. The animals then had a final T2 scan where they were then sacrificed and the hippocampus was collected. (b)Representative pre/post T2 weighted images of epileptic and non-epileptic rats that were treated with either saline or Thiamet-G for two weeks. The CSF is bright white in the T2 MRI images demonstrating ventricle expansion with epilepsy and a more severe expansion with Thiamet-G treatment. (c) Quantification of T2 MRI images showing significant ventricle sizes between controls and epileptics before Thiamet-G treatment. Ventricle sizes significantly differed between the epileptic Thiamet-G treated group and the rest of the other group’s post-treatment. (n=8/group). (d) Representative western blots of OGA and actin for the two-week saline or Thiamet-G treated epileptic and non-epileptic rats. (e) statistical analysis of the two-week saline or Thiamet-G treated epileptic and non-epileptic rats normalized to actin. (f) Immunoprecipitation of SORL1 with immunoblotting for O-GlcNAc (top membrane), SORL1 (middle membrane), and OGT (bottom membrane). (g) Immunoprecipitation of Tmod2 with immunoblotting for O-GlcNAc (top membrane), Tmod2 (middle membrane), and OGT bottom (membrane). (n=6–7/group) * denotes P<0.05 from Non-epileptic plus saline controls. #denotes P<0.05 from Epileptic plus Thiamet-G. ^denotes P<0.10 from Non-epileptic plus saline controls. One-way ANOVA. Error bars are SEM.
Figure 5:
Figure 5:. Tissues from patients with TLE have significant deficits in O-GlcNAcylation and OGT
(a) Western blot membrane with TLE human tissue and post-mortem non-epileptic alternating from left to right. The top membrane was probed with CTD110.6 antibody to show O-GlcNAc levels between both groups. The middle membrane was stripped and probed with OGT and the bottom membrane represents the level of actin between both groups. (b) Desensitization of O-GlcNAc levels between control and TLE individuals were quantified and actin was used to normalize O-GlcNAc. (n=11–13 per group) (c) Desensitization of OGT levels between control and TLE where taken and normalized to actin. (n=11–13 per group). Immunoprecipitation of (d) SORL1 and (e) Tmod2 on resected TLE patients and postmortem tissue. Immunoblotting was performed with O-GlcNAc (top membrane), SORL1 (middle membrane), Tmod2 (middle membrane), and OGT (bottom membrane). Unpaired T-Test. **denotes P<0.01. Error bars are SEM.
Figure 6:
Figure 6:. Thiamet-G bath application on human resectedtissue reduced interictal-like activity and increased OGT, and OGA protein expression.
(a) Experimental outlined. Samples were taken from patients that had undergone temporal lobectomy. Samples were immediately placed in oxygenated ACSF and allowed to acclimate for 1hr. Baseline recording of activity was taken for 1hr followed by bath application of Thiamet-G. Samples were flash frozen and stored at −80°C. (b) Representative extracellular recording following Thiamet-G administration (c) Representative extracellular recording following Thiamet-G bath application. (d) Quantification of spiking events from tissue slices at baseline and following Thiamet-G administration. (e) Protein O-GlcNAcylation OGT and OGA representative western blots. (f) Quantification of western blots in Panel e where O-GlcNAc, OGT, and OGA were normalized to actin and compared to untreated controls (n=4/group). * denotes P<0.05. Fisher LSD test. Error bars are SEM.

References

    1. Liu XY, et al., Comparative proteomics and correlated signaling network of rat hippocampus in the pilocarpine model of temporal lobe epilepsy. Proteomics, 2008. 8(3): p. 582–603. - PubMed
    1. Meriaux C, et al., Human temporal lobe epilepsy analyses by tissue proteomics. Hippocampus, 2014. 24(6): p. 628–42. - PubMed
    1. Gass P, Kiessling M, and Bading H, Regionally selective stimulation of mitogen activated protein (MAP) kinase tyrosine phosphorylation after generalized seizures in the rat brain. Neurosci Lett, 1993. 162(1–2): p. 39–42. - PubMed
    1. Mielke K, et al., Activity and expression of JNK1, p38 and ERK kinases, c-Jun N-terminal phosphorylation, and c-jun promoter binding in the adult rat brain following kainate-induced seizures. Neuroscience, 1999. 91(2): p. 471–83. - PubMed
    1. Nateri AS, et al., ERK activation causes epilepsy by stimulating NMDA receptor activity. Embo j, 2007. 26(23): p. 4891–901. - PMC - PubMed

Publication types

Substances