

Characterization of the Hippocampal Neuroimmune Response to Binge-Like Ethanol Consumption in the Drinking in the Dark Model
- PMID: 30625475
- PMCID: PMC6389401
- DOI: 10.1159/000495210
Characterization of the Hippocampal Neuroimmune Response to Binge-Like Ethanol Consumption in the Drinking in the Dark Model
Abstract
Objectives: Alcohol dependence leads to dysregulation of the neuroimmune system, but the effects of excessive alcohol consumption on key players of the neuroimmune response after episodic binge drinking in nondependence has not been readily assessed. These studies seek to determine how the neuroimmune system within the hippocampus responds to binge-like consumption prior to dependence or evidence of brain damage.
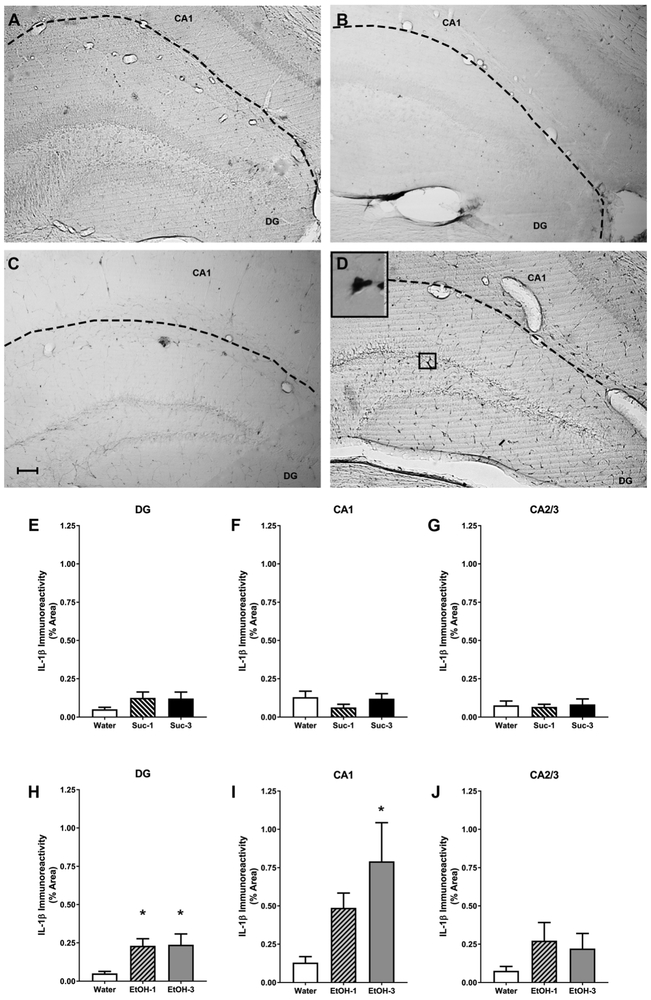
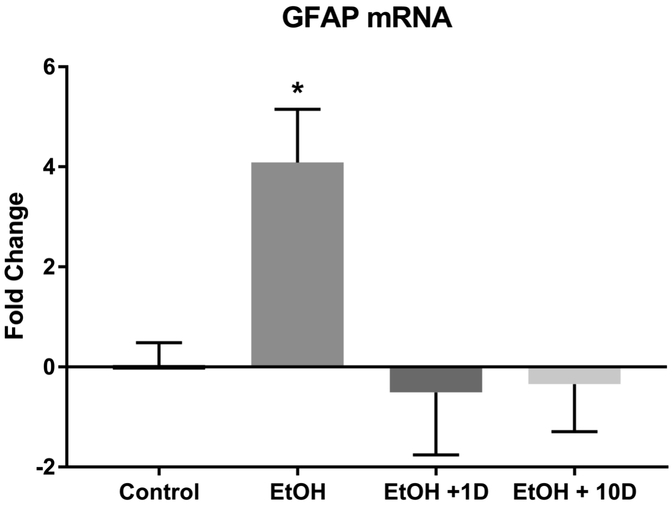
Methods: C57BL/6J mice underwent the drinking in the dark (DID) paradigm to recapitulate binge consumption. Immunohistochemical techniques were employed to determine the effects of ethanol on cytokine and astrocyte responses within the hippocampus. Astrocyte activation was also assessed using qRT-PCR.
Results: Our results indicated that binge-like ethanol consumption resulted in a 3.6-fold increase in the proinflammatory cytokine interleukin (IL)-1β immunoreactivity in various regions of the hippocampus. The opposite effect was seen in the anti-inflammatory cytokine IL-10. Binge-like consumption resulted in a 67% decrease in IL-10 immunoreactivity but had no effect on IL-4 or IL-6 compared with the water-drinking control group. Moreover, astrocyte activation occurred following ethanol exposure as GFAP immunoreactivity was increased over 120% in mice that experienced 3 cycles of ethanol binges. PCR analyses indicated that the mRNA increased by almost 4-fold after one cycle of DID, but this effect did not persist in abstinence.
Conclusions: Altogether, these findings suggest that binge-like ethanol drinking prior to dependence causes dysregulation to the neuroimmune system. This altered neuroimmune state may have an impact on behavior but could also result in a heightened neuroimmune response that is exacerbated from further ethanol exposure or other immune-modulating events.
Keywords: Alcohol abuse; Astrocyte activation; Binge drinking; Cytokine; Hippocampus; Neuroimmune.
© 2019 S. Karger AG, Basel.
Conflict of interest statement
Figures


Similar articles
-
Repetitive binge-like consumption based on the Drinking-in-the-Dark model alters the microglial population in the mouse hippocampus.J Integr Neurosci. 2021 Dec 30;20(4):933-943. doi: 10.31083/j.jin2004094. J Integr Neurosci. 2021. PMID: 34997716 Free PMC article.
-
IL-1 receptor signaling in the basolateral amygdala modulates binge-like ethanol consumption in male C57BL/6J mice.Brain Behav Immun. 2016 Jan;51:258-267. doi: 10.1016/j.bbi.2015.09.006. Epub 2015 Sep 10. Brain Behav Immun. 2016. PMID: 26365025 Free PMC article.
-
Modulation of Binge-like Ethanol Consumption by IL-10 Signaling in the Basolateral Amygdala.J Neuroimmune Pharmacol. 2017 Jun;12(2):249-259. doi: 10.1007/s11481-016-9709-2. Epub 2016 Sep 17. J Neuroimmune Pharmacol. 2017. PMID: 27640210 Free PMC article.
-
Role of the innate immune system in the neuropathological consequences induced by adolescent binge drinking.J Neurosci Res. 2018 May;96(5):765-780. doi: 10.1002/jnr.24203. Epub 2017 Dec 7. J Neurosci Res. 2018. PMID: 29214654 Review.
-
Impact of the Innate Immune Response in the Actions of Ethanol on the Central Nervous System.Alcohol Clin Exp Res. 2016 Nov;40(11):2260-2270. doi: 10.1111/acer.13208. Epub 2016 Sep 21. Alcohol Clin Exp Res. 2016. PMID: 27650785 Review.
Cited by
-
Repetitive binge-like consumption based on the Drinking-in-the-Dark model alters the microglial population in the mouse hippocampus.J Integr Neurosci. 2021 Dec 30;20(4):933-943. doi: 10.31083/j.jin2004094. J Integr Neurosci. 2021. PMID: 34997716 Free PMC article.
-
Chemogenetic manipulation of astrocytic signaling in the basolateral amygdala reduces binge-like alcohol consumption in male mice.J Neurosci Res. 2021 Aug;99(8):1957-1972. doi: 10.1002/jnr.24841. Epub 2021 Apr 12. J Neurosci Res. 2021. PMID: 33844860 Free PMC article.
-
Hippocampal ceRNA networks from chronic intermittent ethanol vapor-exposed male mice and functional analysis of top-ranked lncRNA genes for ethanol drinking phenotypes.Adv Drug Alcohol Res. 2022;2:10831. doi: 10.3389/adar.2022.10831. Epub 2022 Dec 5. Adv Drug Alcohol Res. 2022. PMID: 36908580 Free PMC article.
-
Donepezil Reverses Alcohol-Induced Changes in Hippocampal Neurogenic and Glial Responses Following Adolescent Intermittent Ethanol Exposure Into Adulthood in Female Rats.Hippocampus. 2025 Mar;35(2):e70001. doi: 10.1002/hipo.70001. Hippocampus. 2025. PMID: 39967057 Free PMC article.
-
Sex-specific effects of adolescent intermittent ethanol exposure-induced dysregulation of hippocampal glial cells in adulthood.Alcohol. 2022 May;100:31-39. doi: 10.1016/j.alcohol.2022.02.002. Epub 2022 Feb 17. Alcohol. 2022. PMID: 35182671 Free PMC article.
References
-
- Rehm J, Mathers C, Popova S, Thavorncharoensap M, Teerawattananon Y, Patra J: Global burden of disease and injury and economic cost attributable to alcohol use and alcohol-use disorders. Lancet 2009;373:2223–2233. - PubMed
-
- Bouchery EE, Harwood HJ, Sacks JJ, Simon CJ, Brewer RD: Economic costs of excessive alcohol consumption in the U.S., 2006. American journal of preventive medicine 2011;41:516–524. - PubMed
Publication types
MeSH terms
Substances
Grants and funding
LinkOut - more resources
Full Text Sources
Miscellaneous
