. 2019 Jan 8;7(1):2.
doi: 10.3390/proteomes7010002.

Challenges in Clinical Metaproteomics Highlighted by the Analysis of Acute Leukemia Patients with Gut Colonization by Multidrug-Resistant Enterobacteriaceae

Affiliations

Challenges in Clinical Metaproteomics Highlighted by the Analysis of Acute Leukemia Patients with Gut Colonization by Multidrug-Resistant Enterobacteriaceae

Julia Rechenberger et al. Proteomes. .

Abstract

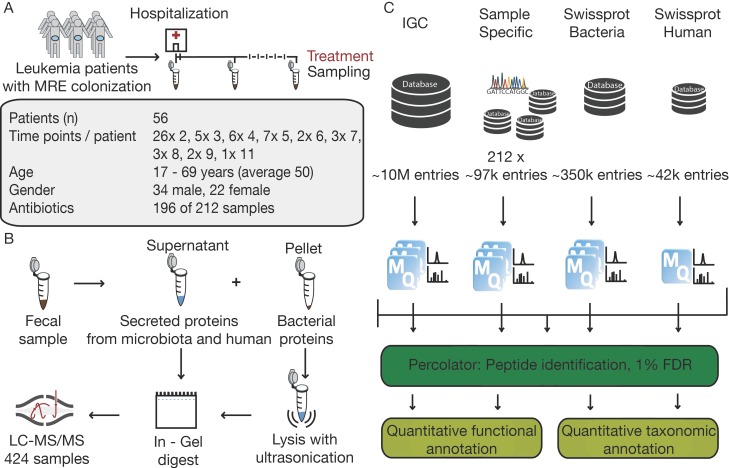
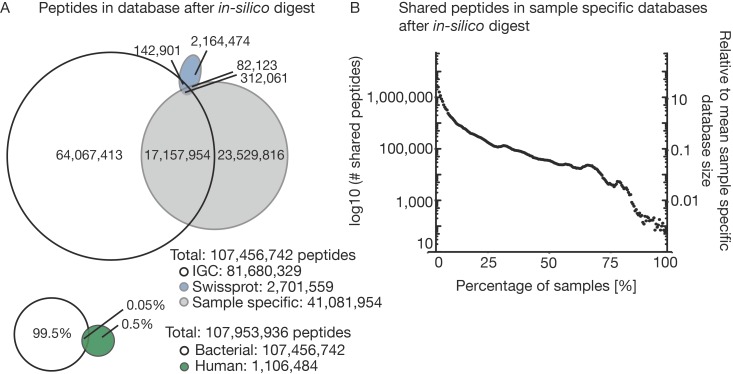
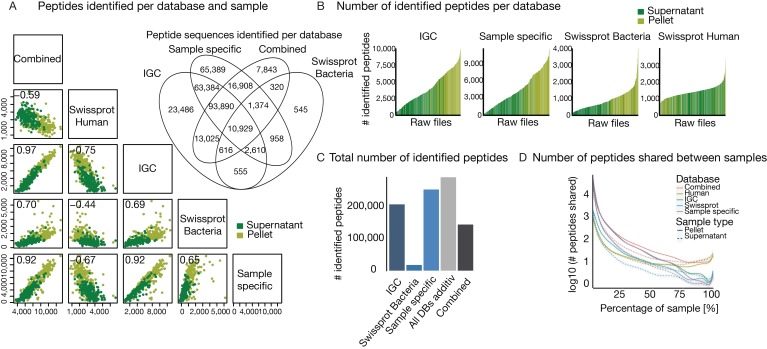
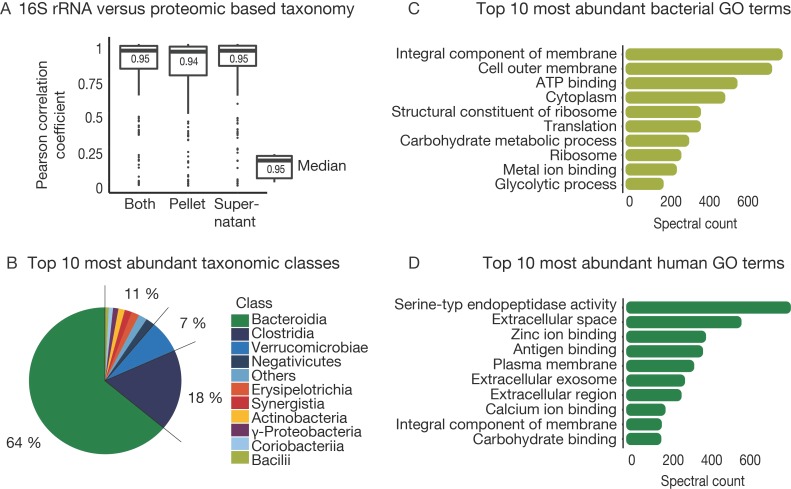
The microbiome has a strong impact on human health and disease and is, therefore, increasingly studied in a clinical context. Metaproteomics is also attracting considerable attention, and such data can be efficiently generated today owing to improvements in mass spectrometry-based proteomics. As we will discuss in this study, there are still major challenges notably in data analysis that need to be overcome. Here, we analyzed 212 fecal samples from 56 hospitalized acute leukemia patients with multidrug-resistant Enterobactericeae (MRE) gut colonization using metagenomics and metaproteomics. This is one of the largest clinical metaproteomic studies to date, and the first metaproteomic study addressing the gut microbiome in MRE colonized acute leukemia patients. Based on this substantial data set, we discuss major current limitations in clinical metaproteomic data analysis to provide guidance to researchers in the field. Notably, the results show that public metagenome databases are incomplete and that sample-specific metagenomes improve results. Furthermore, biological variation is tremendous which challenges clinical study designs and argues that longitudinal measurements of individual patients are a valuable future addition to the analysis of patient cohorts.

Keywords: clinical proteomics; data analysis; human gut microbiome; mass spectrometry; metaproteome; multi-omics; multidrug-resistant Enterobacteriaceae; proteomics.


Conflict of interest statement

B.K. and M.W. are founders and shareholders of OmicScouts. They have no operational role in the company. The company was not involved in this study. All other authors declare no conflict of interest. The founding sponsors had no role in the design of the study; in the collection, analyses, or interpretation of data; in the writing of the manuscript, and in the decision to publish the results.

Figures

Figure 1
Figure 1
Study design, proteomic workflow and data processing pipeline. (A) Acute Leukemia patients were sampled in weekly interval during the time of hospitalization. In total 212 fecal samples of 56 patients with MRE gut colonization were analyzed, providing additional information about age, gender, and treatment conditions. (B) For the protein extraction, fecal samples were divided in supernatant and pellet fractions. Bacterial cells in the pellet fraction were lysed with ultrasonication and for both samples’ proteins were digested in gel. Thereafter, samples were measured with LC-MS/MS. (C) Raw files were searched with four different databases in separate and combined MaxQuant searches and post-processed with Percolator and with quantitative functional and taxonomic annotation analyzed.
Figure 2
Figure 2
In silico comparison of four different databases. Four different databases (Integrated Genome Reference Catalog (IGC), SWISS-PROT bacteria, SWISS-PROT human and sample specific metagenome-based databases) were digested in silico, and the possible search space was compared. (A) Venn diagram of the resulting peptides after in silico digestion comparing the three bacterial databases and all bacterial databases combined versus the peptides from the in silico digested human database. (B) Number of shared peptides in the 212 sample specific databases against the percentage of samples. The right axis indicates to which the percentage of the average sample specific database the number of shared peptides corresponds.
Figure 3
Figure 3
Comparing the influence of database selection on peptide identification. (A) Multi-scatter plot of identified peptides at 1% PSM and peptide FDR for the four different databases and all databases combined. Identification for pellet and supernatant fraction of each sample is shown separately. Pearson correlation is shown in top left of each box (highest p value is 8.2 × 10⁻²¹). The Venn diagram shows the overlap of identified peptides over all samples for the three bacterial and the combination of all four databases. (B) Histogram of the number of identified peptides of supernatant or pellet for each sample. Raw files are sorted according to the number of identified peptides. (C) Bar plot of the number of total identified peptides over all samples per database. ‘All DBs additive’ shows the theoretical identification by summing up all unique peptides of the three bacterial database types. (D) Polynomial curve fit for the number of shared peptides across all samples for the different databases. Separated for supernatant and pellet fraction of the samples.
Figure 4
Figure 4
Description of the taxonomic and functional composition. (A) Box plot of Pearson correlation of taxonomic composition detected at the class level with 16S rRNA sequencing and proteomic analysis for each sample. Both: supernatant and pellet for each sample combined, Supernatant: only the supernatant fraction of each sample, Pellet: only the pellet fraction of each sample. (B) Pie chart shows the most abundant identified taxonomic classes over all samples. (C) Bar plot of average spectral counts for the 10 most abundant bacterial gene ontology (GO) term over all samples. (D) Bar plot of average spectral counts for the 10 most abundant human GO term over all samples.
Figure 5
Figure 5
Sample variability (A) Heatmap of Jaccard similarities based on the presence/absence of bacterial peptides for the top six patients with the most sampling time points. Dendrogram clustering is based on Pearson correlation of Jaccard distances. Bottom triangle for the supernatant fraction of the sample. Top triangle for pellet fraction of the sample. (B) Heatmap of Jaccard similarities based on the presence/absence of human peptides for the top six patients with the most sampling time points. Dendrogram clustering is based on Pearson correlation of Jaccard distances. Bottom triangle for the supernatant fraction of the sample. Top triangle for pellet fraction of the sample. (C) Boxplot of Jaccard similarities for bacterial peptides of paired samples with different time distances between sampling points. (D) Boxplot of Jaccard similarities for human peptides of paired samples with different time distances between sampling points.
Figure 6
Figure 6
Comparing taxonomic and functional data for longitudinal samples. Taxonomic class abundances retrieved from proteomic and 16S rRNA data as well as GO term abundances were compared for samples for two patients over time. In addition, antibiotic treatment at sampling time point and type of hospital admission (i.e., chemotherapy or transplantation) for the sampling time is indicated.

References

    1. Bäckhed F., Ley R.E., Sonnenburg J.L., Peterson D.A., Gordon J.I. Host-bacterial mutualism in the human intestine. Science. 2005;307:1915–1920. doi: 10.1126/science.1104816. - DOI - PubMed
    1. Yoon S.S., Kim E.K., Lee W.J. Functional genomic and metagenomic approaches to understanding gut microbiota-animal mutualism. Curr. Opin. Microbiol. 2015;24:38–46. doi: 10.1016/j.mib.2015.01.007. - DOI - PubMed
    1. Graham R.L.J., Graham C., McMullan G. Microbial proteomics: A mass spectrometry primer for biologists. Microb. Cell Fact. 2007;6:1–14. doi: 10.1186/1475-2859-6-26. - DOI - PMC - PubMed
    1. Wilmes P., Bond P.L. Metaproteomics: Studying functional gene expression in microbial ecosystems. Trends Microbiol. 2006;14:92–97. doi: 10.1016/j.tim.2005.12.006. - DOI - PubMed
    1. Rodríguez-Valera F. Environmental genomics, the big picture? FEMS Microbiol. Lett. 2004;231:153–158. doi: 10.1016/S0378-1097(04)00006-0. - DOI - PubMed