

Integration of enzymatic data in Bacillus subtilis genome-scale metabolic model improves phenotype predictions and enables in silico design of poly-γ-glutamic acid production strains
- PMID: 30626384
- PMCID: PMC6325765
- DOI: 10.1186/s12934-018-1052-2
Integration of enzymatic data in Bacillus subtilis genome-scale metabolic model improves phenotype predictions and enables in silico design of poly-γ-glutamic acid production strains
Abstract
Background: Genome-scale metabolic models (GEMs) allow predicting metabolic phenotypes from limited data on uptake and secretion fluxes by defining the space of all the feasible solutions and excluding physio-chemically and biologically unfeasible behaviors. The integration of additional biological information in genome-scale models, e.g., transcriptomic or proteomic profiles, has the potential to improve phenotype prediction accuracy. This is particularly important for metabolic engineering applications where more accurate model predictions can translate to more reliable model-based strain design.
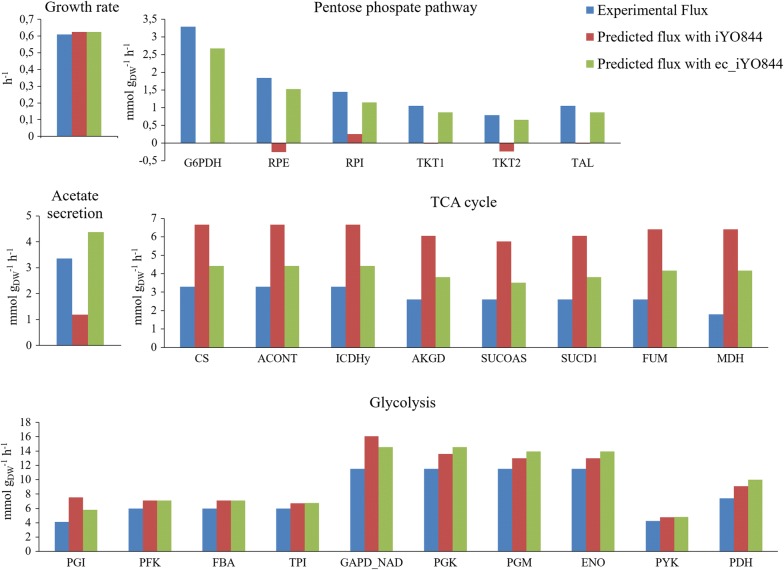
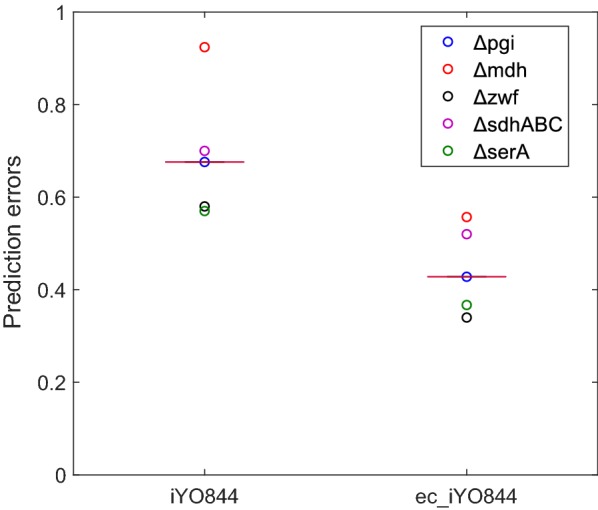
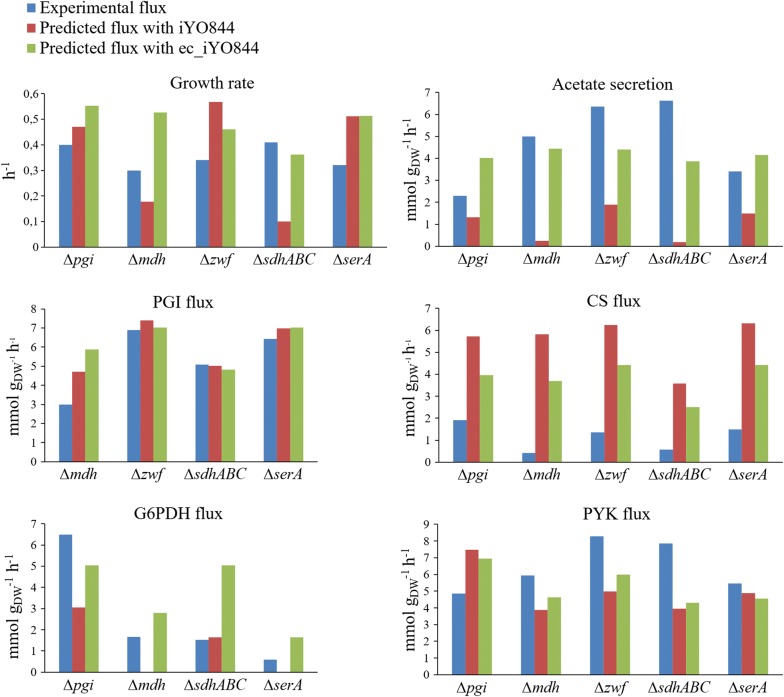
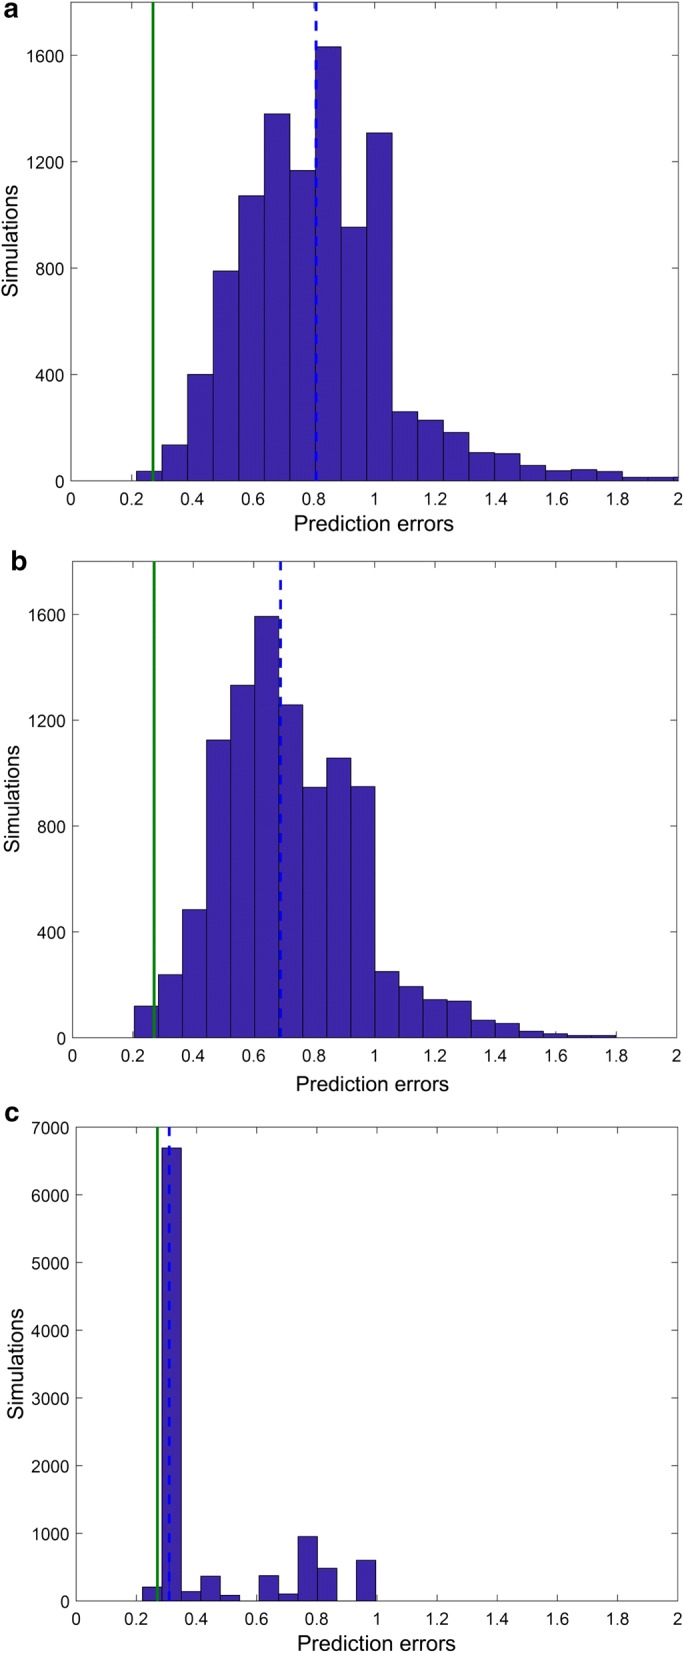
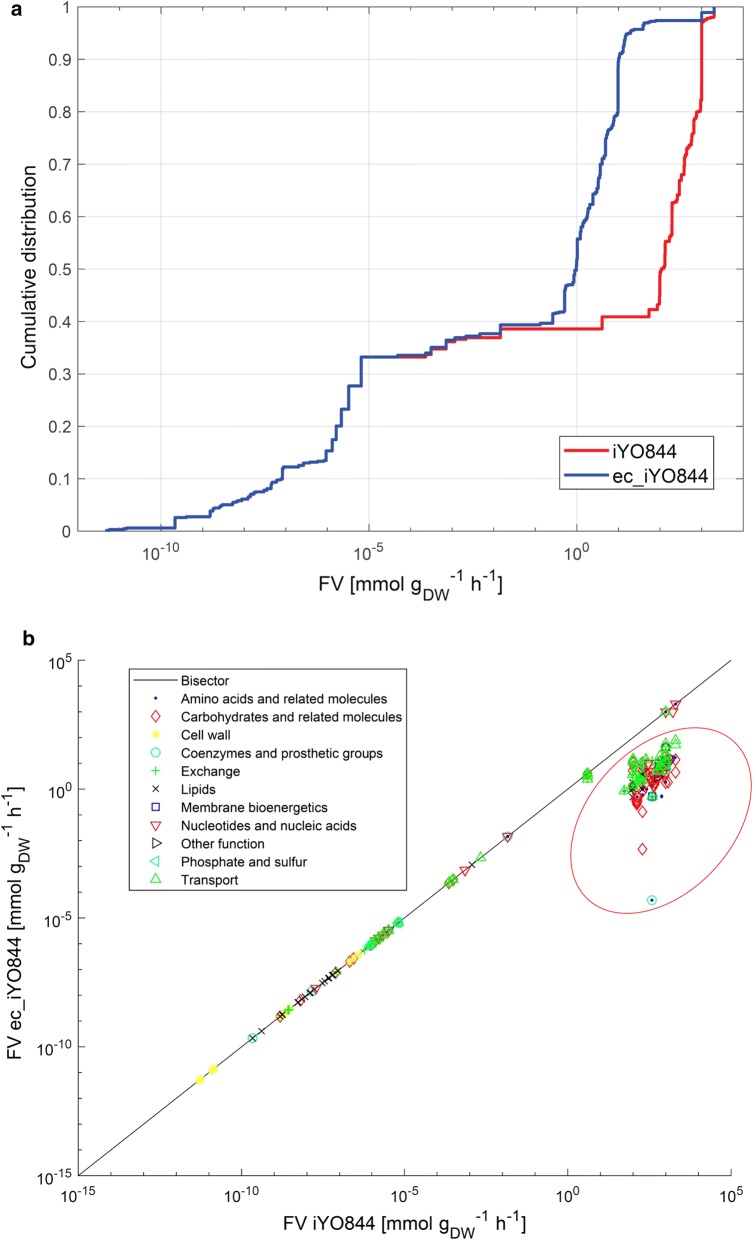
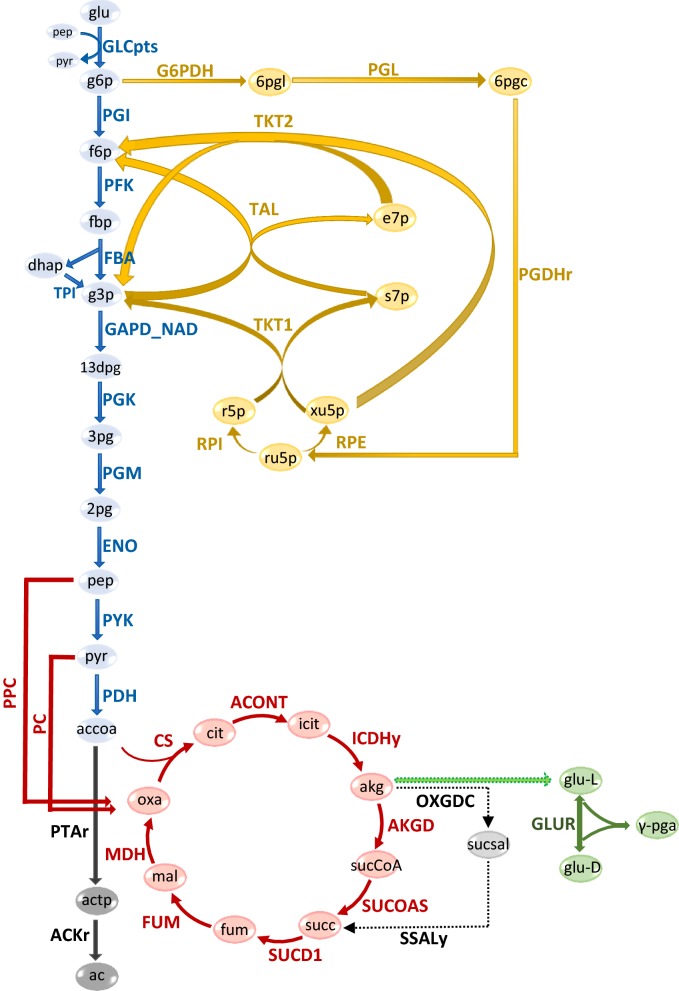
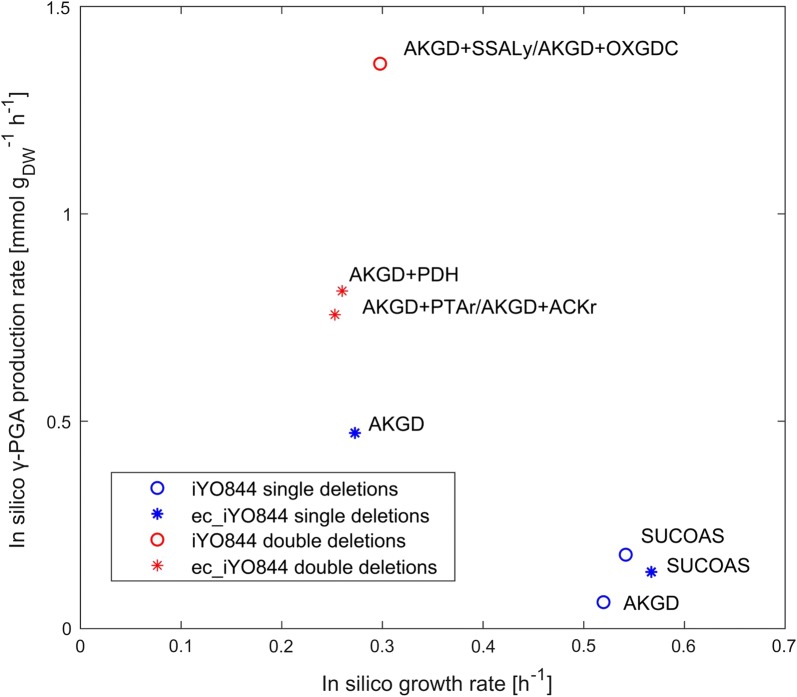
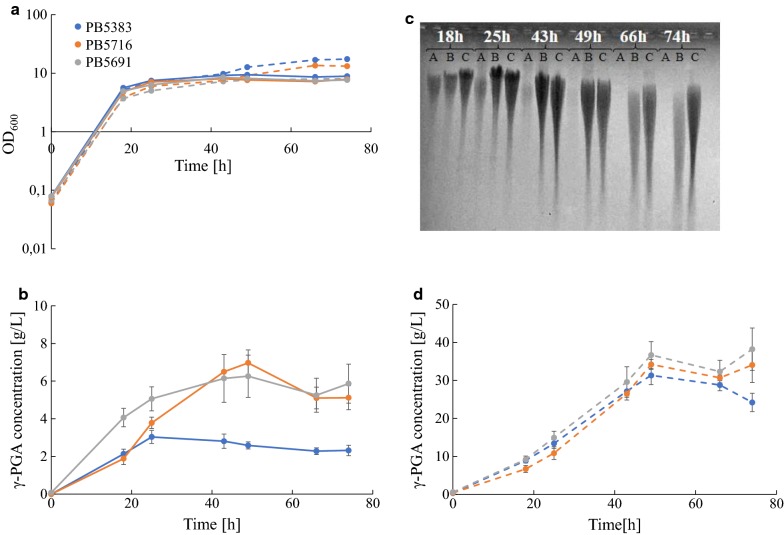
Results: Here we present a GEM with Enzymatic Constraints using Kinetic and Omics data (GECKO) model of Bacillus subtilis, which uses publicly available proteomic data and enzyme kinetic parameters for central carbon (CC) metabolic reactions to constrain the flux solution space. This model allows more accurate prediction of the flux distribution and growth rate of wild-type and single-gene/operon deletion strains compared to a standard genome-scale metabolic model. The flux prediction error decreased by 43% and 36% for wild-type and mutants respectively. The model additionally increased the number of correctly predicted essential genes in CC pathways by 2.5-fold and significantly decreased flux variability in more than 80% of the reactions with variable flux. Finally, the model was used to find new gene deletion targets to optimize the flux toward the biosynthesis of poly-γ-glutamic acid (γ-PGA) polymer in engineered B. subtilis. We implemented the single-reaction deletion targets identified by the model experimentally and showed that the new strains have a twofold higher γ-PGA concentration and production rate compared to the ancestral strain.
Conclusions: This work confirms that integration of enzyme constraints is a powerful tool to improve existing genome-scale models, and demonstrates the successful use of enzyme-constrained models in B. subtilis metabolic engineering. We expect that the new model can be used to guide future metabolic engineering efforts in the important industrial production host B. subtilis.
Keywords: Bacillus subtilis; Constraint-based methods; Enzymatic data; Genome-scale metabolic model; Poly-γ-glutamic acid.
Figures
Similar articles
-
Improvement of Bacillus subtilis for poly-γ-glutamic acid production by genome shuffling.Microb Biotechnol. 2016 Nov;9(6):824-833. doi: 10.1111/1751-7915.12405. Epub 2016 Aug 26. Microb Biotechnol. 2016. PMID: 27562078 Free PMC article.
-
Improvement of poly(gamma-glutamic acid) biosynthesis and redistribution of metabolic flux with the presence of different additives in Bacillus subtilis CGMCC 0833.Appl Microbiol Biotechnol. 2008 Jun;79(4):527-35. doi: 10.1007/s00253-008-1462-x. Epub 2008 Apr 29. Appl Microbiol Biotechnol. 2008. PMID: 18443783
-
The main byproducts and metabolic flux profiling of γ-PGA-producing strain B. subtilis ZJU-7 under different pH values.J Biotechnol. 2013 Mar 10;164(1):67-74. doi: 10.1016/j.jbiotec.2012.12.009. Epub 2012 Dec 27. J Biotechnol. 2013. PMID: 23275182
-
Genetic and metabolic engineering for microbial production of poly-γ-glutamic acid.Biotechnol Adv. 2018 Sep-Oct;36(5):1424-1433. doi: 10.1016/j.biotechadv.2018.05.006. Epub 2018 May 28. Biotechnol Adv. 2018. PMID: 29852203 Review.
-
New biological functions and applications of high-molecular-mass poly-gamma-glutamic acid.Chem Biodivers. 2010 Jun;7(6):1555-62. doi: 10.1002/cbdv.200900283. Chem Biodivers. 2010. PMID: 20564573 Review.
Cited by
-
Proteomics and constraint-based modelling reveal enzyme kinetic properties of Chlamydomonas reinhardtii on a genome scale.Nat Commun. 2023 Aug 8;14(1):4781. doi: 10.1038/s41467-023-40498-1. Nat Commun. 2023. PMID: 37553325 Free PMC article.
-
Genotype-specific germination behavior induced by sustainable priming techniques in response to water deprivation stress in rice.Front Plant Sci. 2024 Feb 8;15:1344383. doi: 10.3389/fpls.2024.1344383. eCollection 2024. Front Plant Sci. 2024. PMID: 38390302 Free PMC article.
-
Genome-scale metabolic modeling reveals metabolic trade-offs associated with lipid production in Rhodotorula toruloides.PLoS Comput Biol. 2023 Apr 26;19(4):e1011009. doi: 10.1371/journal.pcbi.1011009. eCollection 2023 Apr. PLoS Comput Biol. 2023. PMID: 37099621 Free PMC article.
-
Enhancing genome-scale metabolic models with kinetic data: resolving growth and citramalate production trade-offs in Escherichia coli.Bioinform Adv. 2025 Jul 12;5(1):vbaf166. doi: 10.1093/bioadv/vbaf166. eCollection 2025. Bioinform Adv. 2025. PMID: 40799493 Free PMC article.
-
Current State, Challenges, and Opportunities in Genome-Scale Resource Allocation Models: A Mathematical Perspective.Metabolites. 2024 Jun 28;14(7):365. doi: 10.3390/metabo14070365. Metabolites. 2024. PMID: 39057688 Free PMC article. Review.
References
-
- Kunst F, et al. The complete genome sequence of the Gram-positive bacterium Bacillus subtilis. Nature. 1997;390(6657):249–256. - PubMed
-
- Muntel J, Fromion V, Goelzer A, Maabeta S, Mader U, Buttner K, Hecker M, Becher D. Comprehensive absolute quantification of the cytosolic proteome of Bacillus subtilis by data independent, parallel fragmentation in liquid chromatography/mass spectrometry (LC/MSE) Mol Cell Proteom. 2014;13:1008–1019. - PMC - PubMed
-
- Nicolas P, Mäder U, Dervyn E, Rochat T, Leduc A, Pigeonneau N, et al. Condition-dependent transcriptome reveals high-level regulatory architecture in Bacillus subtilis. Science. 2012;335(6072):1103–1106. - PubMed
-
- Van Duy N, Mader U, Tran NP, Cavin JF, Tam LT, Albrecht D, Hecker M, Antelmann H. The proteome and transcriptome analysis of Bacillus subtilis in response to salicylic acid. Proteomics. 2007;7(5):698–710. - PubMed
MeSH terms
Substances
Grants and funding
LinkOut - more resources
Full Text Sources
Research Materials
