. 2019 Mar;9(3):416-435.
doi: 10.1158/2159-8290.CD-18-0567. Epub 2019 Jan 9.

Acetyl-CoA Metabolism Supports Multistep Pancreatic Tumorigenesis

Affiliations

Acetyl-CoA Metabolism Supports Multistep Pancreatic Tumorigenesis

Alessandro Carrer et al. Cancer Discov. 2019 Mar.

Erratum in

Abstract

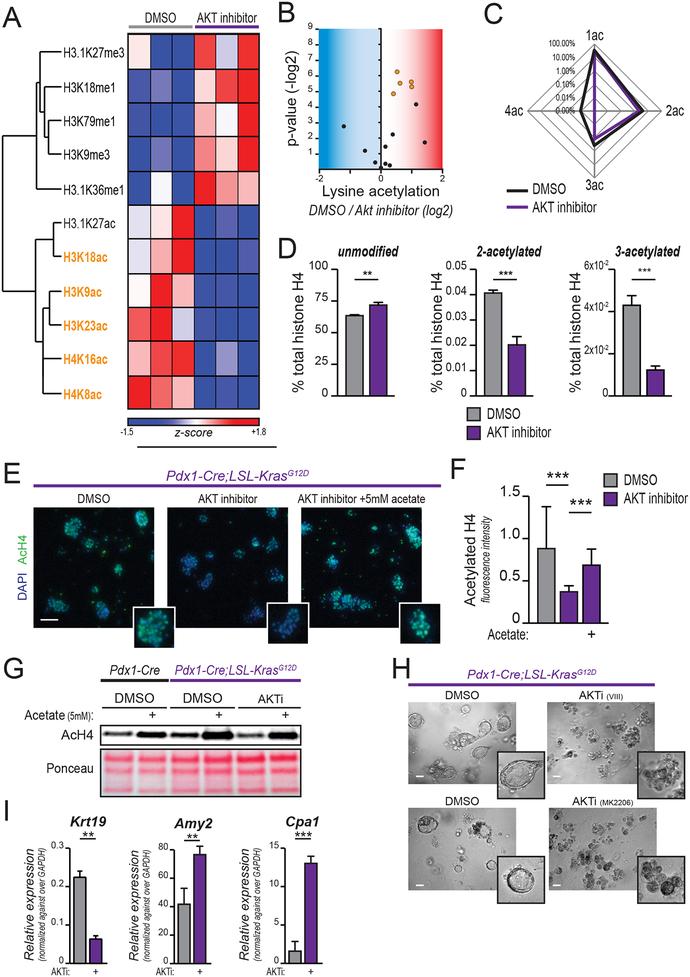
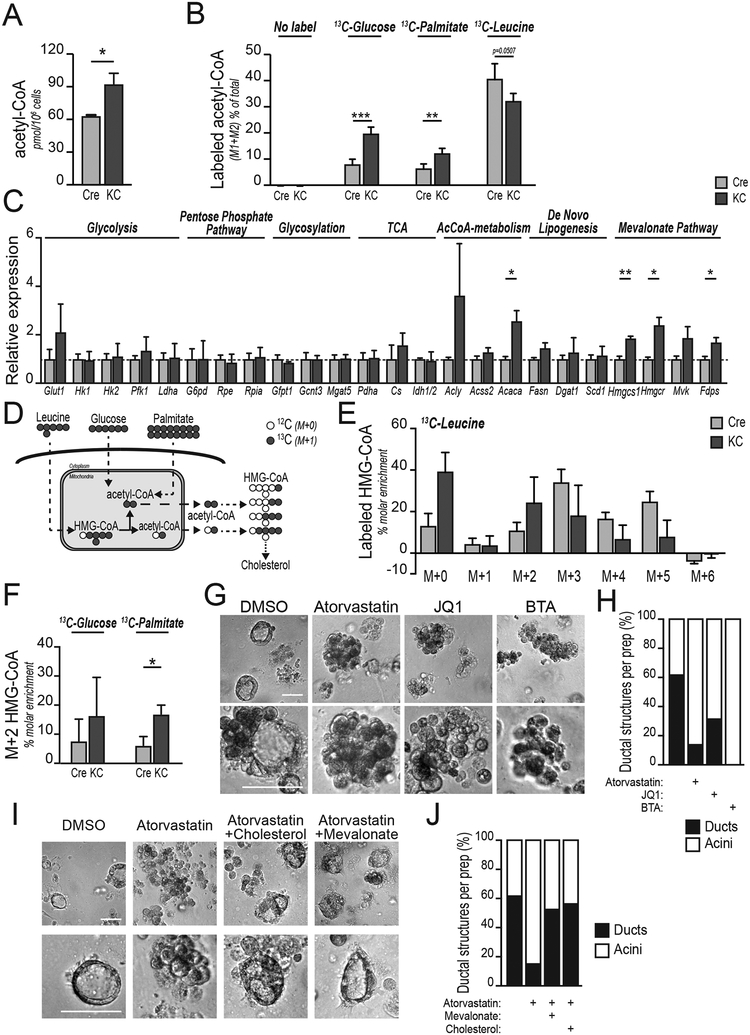
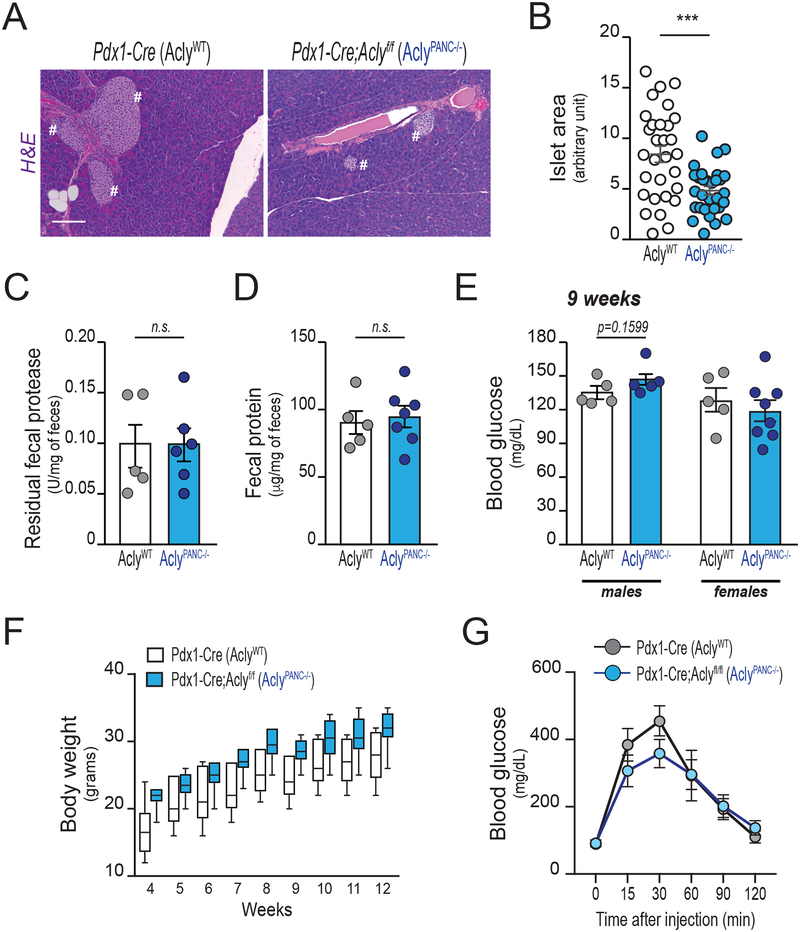
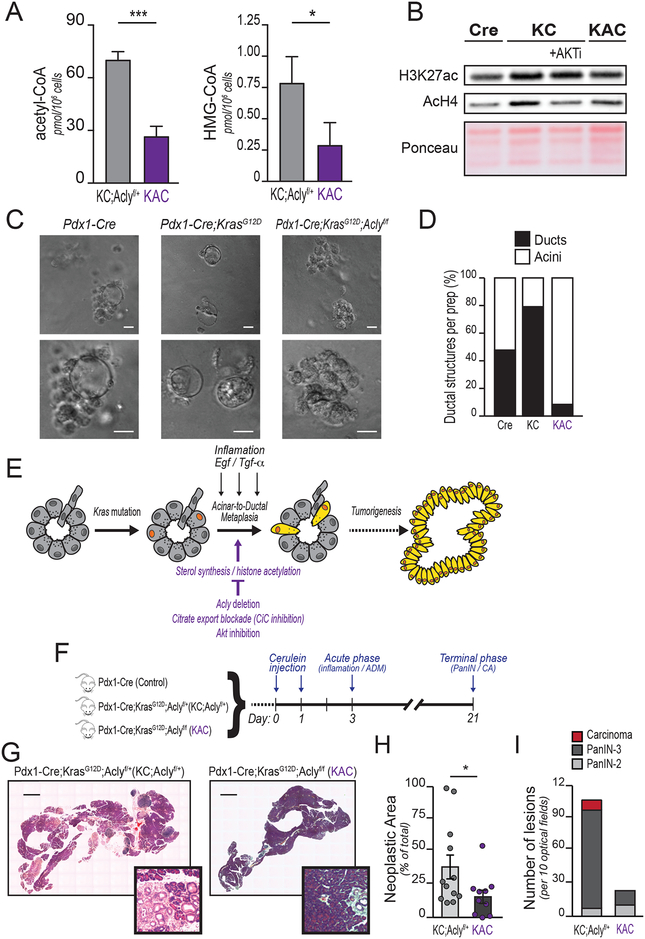
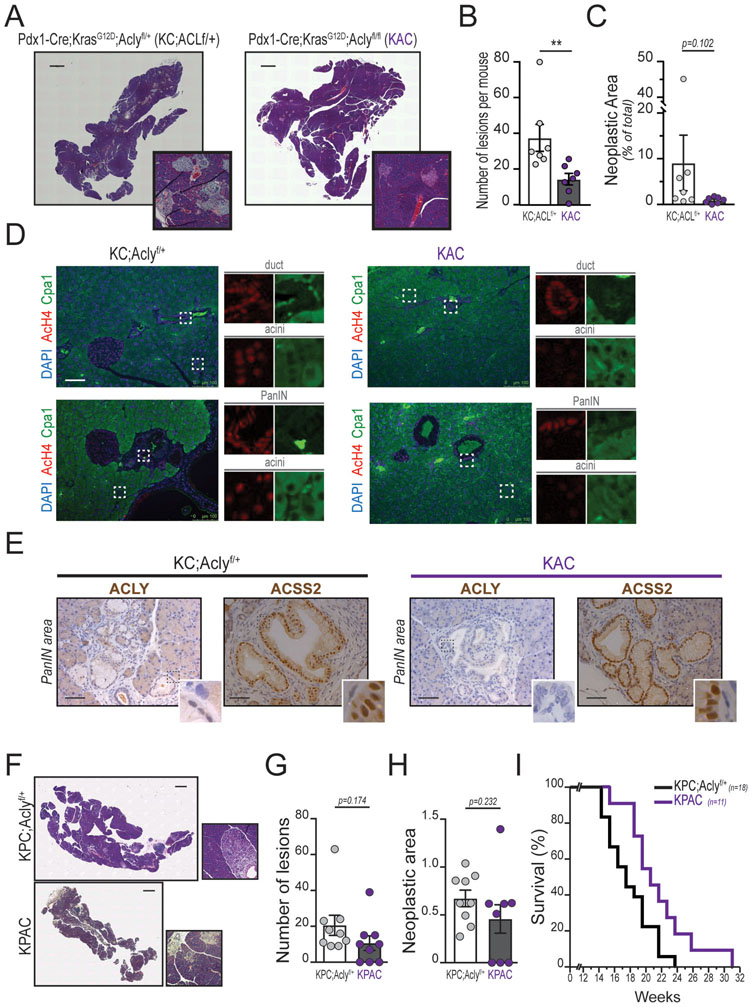
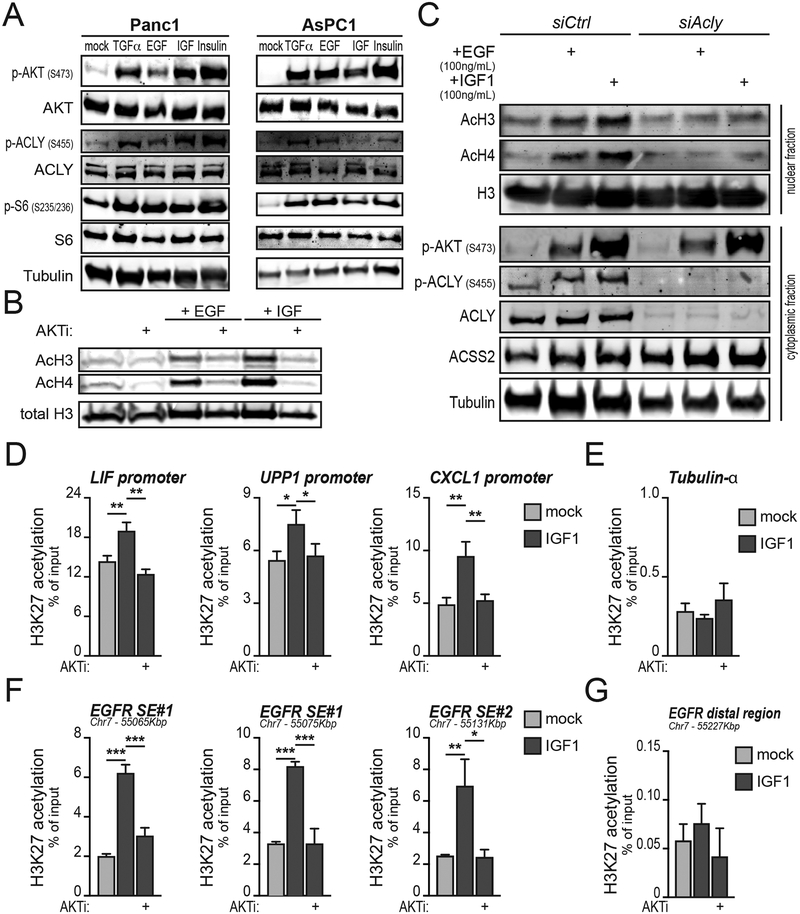
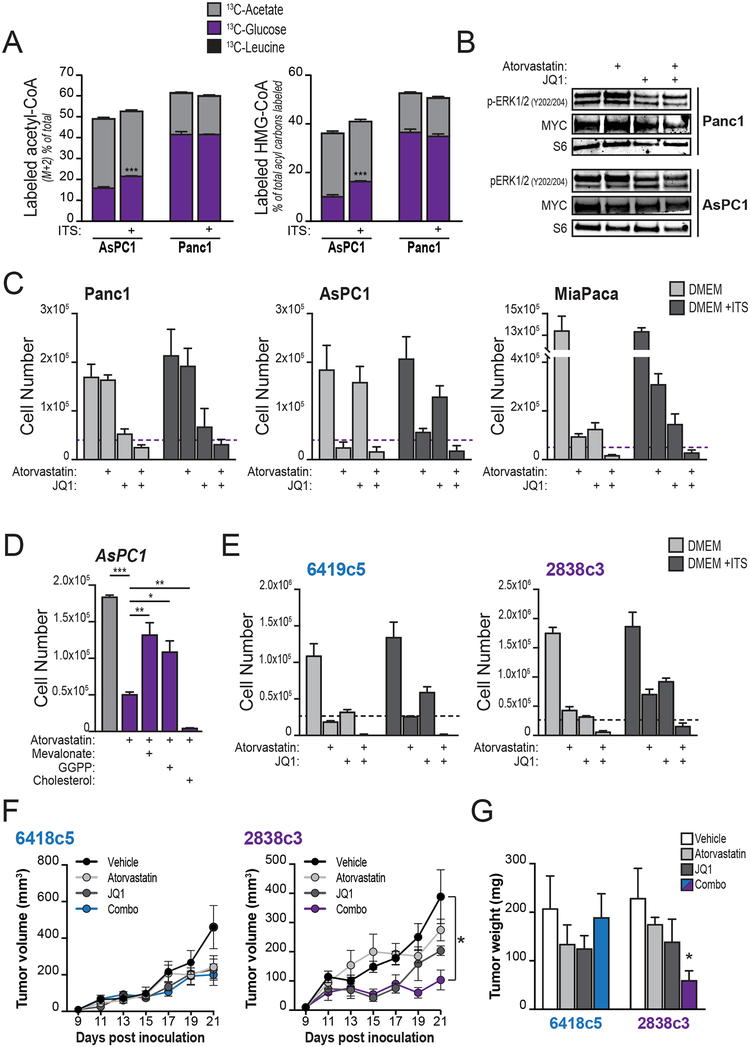
Pancreatic ductal adenocarcinoma (PDA) has a poor prognosis, and new strategies for prevention and treatment are urgently needed. We previously reported that histone H4 acetylation is elevated in pancreatic acinar cells harboring Kras mutations prior to the appearance of premalignant lesions. Because acetyl-CoA abundance regulates global histone acetylation, we hypothesized that altered acetyl-CoA metabolism might contribute to metabolic or epigenetic alterations that promote tumorigenesis. We found that acetyl-CoA abundance is elevated in KRAS-mutant acinar cells and that its use in the mevalonate pathway supports acinar-to-ductal metaplasia (ADM). Pancreas-specific loss of the acetyl-CoA-producing enzyme ATP-citrate lyase (ACLY) accordingly suppresses ADM and tumor formation. In PDA cells, growth factors promote AKT-ACLY signaling and histone acetylation, and both cell proliferation and tumor growth can be suppressed by concurrent BET inhibition and statin treatment. Thus, KRAS-driven metabolic alterations promote acinar cell plasticity and tumor development, and targeting acetyl-CoA-dependent processes exerts anticancer effects. SIGNIFICANCE: Pancreatic cancer is among the deadliest of human malignancies. We identify a key role for the metabolic enzyme ACLY, which produces acetyl-CoA, in pancreatic carcinogenesis. The data suggest that acetyl-CoA use for histone acetylation and in the mevalonate pathway facilitates cell plasticity and proliferation, suggesting potential to target these pathways.See related commentary by Halbrook et al., p. 326.This article is highlighted in the In This Issue feature, p. 305.


Conflict of interest statement

CONFLICT OF INTEREST: The authors claim no conflicts with the presented work.

Figures

Figure 1:
Figure 1:. AKT inhibition reduces histone acetylation in KRASG12D-expressing cells.
A-D, Mass spectrometry-based profiling of histone modifications in primary murine PanIN-derived cells treated with AKT inhibitor (CAS-612847-09-3, 10 μM) for 24 hours. A, Heatmap shows histone marks most strongly regulated (see Supplementary Figure S1A for heat map of full dataset). Columns show biological replicates (n=3, each treatment). Histone acetyl marks highlighted in orange are those reaching p<0.05 (H3.1K27ac p=0.057). Complete histone acetylome represented in B, volcano plot. Each dot represents an acetylated residue. Blue area contains downregulated marks with AKTi, red area represents upregulated marks. Orange dots represent those reaching p<0.05, as in part A. C, Spider graph shows percentage of 1-, 2-, 3-, 4-acetylated histone H4 (lysine residues 5, 8, 12, 16) over total histone H4. D, bar graphs depict abundance of indicated poly-acetylated H4 peptides, along with unmodified histone H4. E, AcH4 staining of acinar cells isolated from 6–8-week-old KC mice (n=3), embedded in Matrigel, and treated as indicated for 24 hours. Scale bar, 50 μm. F, quantification of E (25 optical fields acquired per experimental replicate). G, AcH4 western blot of acinar cells treated 24 hours in indicated conditions (AKT selective inhibitor VIII, 10 μM; acetate, 5 mM). H, morphology (scale bar, 50 μm) of Matrigel-embedded acinar cells after 48 hours culture in the presence or absence of indicated AKT inhibitors (VIII, upper panel; MK2206, lower panel). I, mRNA expression of indicated genes quantified by qPCR for cells in H. Bar graphs depict mean, +/− SD of triplicates (*, p<0.05; **, p<0.01; ***, p<0.001).
Figure 2:
Figure 2:. Acetyl-CoA abundance is elevated in KRAS mutant acinar cells and inhibition of acetyllysine reading or cholesterol synthesis impairs acinar-to-ductal metaplasia.
In all panels, pancreatic acinar cells were harvested from 6–8-week-old wild-type (Pdx1-Cre; Cre) or (Pdx1-Cre;KrasG12D; KC) mice. A, LC-MS quantification of acetyl-CoA in isolated acinar cells (n=3 mice, each group). B, isolated acinar cells (n=4 mice, each group) were cultured for 8 hours in the presence of the indicated 13C-labelled nutrient and acetyl-CoA labeling determined by LC-MS. C, mRNA expression of indicated genes in acinar cells after 48 hours culture in Matrigel, measured by qPCR (n=3 mice, each group). Mean value of each Cre column is equaled to 1, and data are normalized accordingly. Dashed blue line shows 1. D, schematic representation of acetyl-CoA and HMG-CoA labeling pattern from indicated, uniformly-labeled carbon sources. Compartmentalization also illustrated. E, HMG-CoA isotopologues after labeling of acinar cells (n=4 mice, each group) with 0.5 μM 13C-leucine for 8 hours. F, M+2 HMG-CoA in acinar cells labeled as in panel B. G, morphology of KC acinar cells embedded in collagen, treated with TGFα after 96 hours in the presence of the indicated inhibitors (n=3 mice, each group) Representative images shown. Scale bar, 50 μm. H, blinded quantification of ductal structures. Relative to Figure 2G. 35–50 images within 3 biological replicates were evaluated. I, collagen-embedded KC acinar cells after 96 hours treatment with atorvastatin, +/− mevalonate or cholesterol (n=3 mice, each group). Scale bar, 50 μm. J, blinded quantification of ductal structures. Relative to Figure 2E. 35–50 images within 3 biological replicates were evaluated. For all panels, columns show mean, +/− SD (*, p<0.05; **, p<0.01; ***, p<0.001).
Figure 3:
Figure 3:. Acly deficiency in the murine pancreas does not cause overt metabolic abnormalities.
All panels depict characterization of age-matched Pdx1-Cre (AclyWT) and Pdx1-Cre;Aclyf/f (AclyPANC−/−) littermate mice (n=12, each group, unless otherwise reported). A, Hematoxylyn and eosin (H&E) staining of pancreata at 13 weeks of age (Representative images). Pound signs denote islets of Langerhans. Scale bars, 100 μm. B, Langerhans’ islets size, manually measured using ImageJ (6 slices per pancreas, each 50 μm spaced, were analyzed; n=5 mice per group). Each dot shows average islet size for each section analyzed (30 slides per group). Error bars show mean +/− SEM (***, p<0.001). C-D, fecal matter was harvested at 10 weeks of age from individually housed mice (n=6, each group). Fecal protease activity (C) and total residual protein content (D), normalized against fecal weight, mean +/− SEM. Each dot represents 1 mouse. E, blood glucose levels in male (left) and female (right) mice after overnight fast, mean +/− SEM. Each dot represents 1 mouse. F, body weight from age 4–12 weeks in male mice (n=5, each group). Boxes show 75% CI, lines show median, minimum, maximum. Difference between genotypes is not significant (ANOVA with Tukey-Kramer adjustment for multiple comparisons; p=0.9962). See Supplementary Figure 3 for data from female mice. G, Glucose tolerance test (GTT) on 10-week-old male mice (n=5, each group), mean +/− SEM.
Figure 4:
Figure 4:. Acly deficiency impairs acinar-to-ductal metaplasia and tumor formation.
In vivo and ex vivo experiments were performed using Pdx1-Cre (Cre), Pdx1-Cre;KrasG12D (KC), Pdx1-Cre;KrasG12D;Aclyf/+ (KC;Aclyf/+) or Pdx1-Cre;KrasG12D;Aclyf/f (KAC) mice. A, LC-MS quantification of acetyl-CoA (left) and HMG-CoA (right) in isolated acinar cells (n=3 mice for KC;Aclyf/+, n=4 for KAC). Bars show mean +/− SD (***, p<0.001; *, p<0.05). B, Western blotting for acetylated histones of ex vivo acinar cells isolated from 8-week-old mice of the indicated genotypes, +/− AKTi (selective inhibitor VIII, 10 μM). Ponceau staining of acid-extracted histones is shown as a loading control. Representative of 3 independent biological repeats. C, acinar cell organoids were embedded in collagen and ADM induced with rTGFα (100 ng/mL). Images were acquired at day 5, representative images shown (n=3 independent repeat, each group). Scale bar, 20 μm. D, Day 5 organoids were scored as ductal-like (black) or acinar-like (white) in a blinded manner, according to morphology. 75 images over 3 independent experiments were evaluated. E, cartoon illustrating factors that promote ADM or restrict ADM. Kras mutant acinar cells (denoted by orange nuclei) undergo acinar-to-ductal metaplasia and become locked into a more undifferentiated morphology (cells highlighted in yellow), which eventually proliferate and evolve in carcinogenic lesions. F, Cerulein-injected mice were sacrificed at either Day 3 (inflammatory phase; n=3, each group) or Day 21 (terminal stage; n=12 KC;Aclyf/+, n=10 KAC). G, H&E staining of Day 21 pancreata. Representative images of whole tissue sections. Scale bar, 1 mm. PanIN-containing areas magnified in distinct panels. H, Total neoplastic area quantified. Each lesion’s area and whole organ surface were measured in ImageJ. Lesions areas were summed and denoted as “neoplastic area”. Percent of neoplastic area over total pancreas surface is shown. Each dot represents an animal. Error bars show mean +/− SD (*, p<0.05). I, Histopathological characterization. 10 high-power optical fields per mouse section were blindly analyzed by a veterinary pathologist. For all panels, columns show mean +/− SD (*, p<0.05; **, p<0.01; ***, p<0.001)
Figure 5:
Figure 5:. Pancreatic tumorigenesis is impaired in the absence of ACLY.
Aclyf/f mice were bred into a KC or KPC genotypes. A-E shows 4-month-old Pdx1-Cre;KrasG12D;Aclyf/+ (KC;Aclyf/+) or Pdx1-Cre;KrasG12D;Aclyflf (KAC) mice (n=7, each genotype). A, hematoxylin and eosin (H&E) staining transverse sections of whole pancreata. Scale bar, 1 mm. PanIN-containing areas magnified in distinct panels. Representative images shown. B, Neoplastic lesions were counted in each transverse section, and mean count per animal graphed. C, Each lesion’s area and whole organ surface were measured in ImageJ. Lesion areas were summed and denoted as “neoplastic area”. Percent of neoplastic area over total pancreas surface is shown. Each dot represents an animal, mean +/− SD (**, p<0.01). D, AcH4 immunofluorescence in pancreata of mice as in A. Whole organ sections were stained against Cpa1 (green), AcH4 (red); nuclei counterstained with DAPI. Split signals of relevant areas (denoted by white rectangles) are individually shown in distinct panels. Scale bar 100 μM. E, immunohistochemistry against ACLY and ACSS2. Nuclei counterstained with hematoxylin. Pictures show representative PanIN lesions. Scale bar 50 μM. F-I shows 9-week-old Pdx1-Cre;KrasG12D;p53L/+;Aclyf/+ (KPC;Aclyf/+) or Pdx1-Cre;KrasG12D; p53L/+;Aclyflf (KPAC) (n=9, each genotype). F, transverse sections (H&E) of whole pancreata. Magnifications of PanIN-containing areas are shown in distinct panels. Representative images shown. Scale bar 1 mm. G, Number of lesions and H, neoplastic area, assessed as in B, C. I, Kaplan-Meier survival curve. Logrank test was used to determine statistical significance (p=0.0246). Mice were sacrificed upon sudden weight loss (>15% body weight) or when showing signs of distress.
Figure 6:
Figure 6:. Environmental stimuli induce AKT-ACLY signaling and histone acetylation in PDA cells.
A, Panc1 or AsPC1 cells were serum-starved overnight and then treated with indicated growth factors for 1 hour and signaling analyzed by western blot. B, Western blotting of acetylated histones. AsPC1 cells were serum-starved overnight and then treated with either rEGF (100 ng/mL) or rIGF1 (100 ng/mL) for 24 hours, with or without AKTi VIII (10 μM), and histones acid-extracted. C, Western blotting of acetylated histones and selected cytoplasmic proteins. AsPC1 cells were transfected with siRNA targeting Acly or non-targeting control siRNA. After 56 hours, cells were treated with recombinant EGF or IGF as in B and histones acid-extracted. D-G, AsPC1 cells were treated as in B and H3K27ac ChIP was performed analyzing (D) stromal cell-regulated gene promoters (15), (E) a control gene promoter, (F) the EGFR superenhancer (SE) (35), or (G) a control (distal) region in the EFGR locus. Experiments are representative of 2 independent biological repeats. Columns show mean, +/− SD (*, p<0.05; **, p<0.01; ***, p<0.001).
Figure 7:
Figure 7:. Targeting acetyl-CoA-dependent processes can suppress PDA growth.
A, AsPC1 or Panc1 cells were cultured overnight in DMEM with or without ITS+ (insulin-based supplement, BD Biosciences) and then labeled for 2 hours with indicated substrates (n=3, each condition). Percent labeling of acetyl-CoA and HMG-CoA were determined by LC-MS. Stars denote statistically different labeling from glucose. B, Western blotting shows levels of MYC and ERK1/2 phosphorylation in AsPC1 and Panc1 cells treated with atorvastatin (20 μM) and/or JQ1 (500 nM) for 4 days. C, indicated cell lines were cultured in DMEM with or without ITS+ and treated with either atorvastatin (20 μM), JQ1 (500 nM), or both for 4 days. Graphs show final cell counts. Dashed purple lines denote starting cell number (counted at day 0). Experiments are representative of 2 independent biological repeats. D, AsPC1 cells were treated with atorvastatin (20 μM) and counted after 4 days. Effect of supplementation with mevalonate (100 μM), geranylgeranyl pyrophosphate (GGPP, 100 μM) or cholesterol (12.5 μg/mL) is shown. Cholesterol was tested over a range of concentrations from 5–100 μg/mL and in all cases failed to rescue proliferation in the presence of atorvastatin (only 12.5 μg/mL data is shown). E, KPCY-derived mouse cell lines were cultured in DMEM with or without ITS+ and treated with either atorvastatin (20 μM), JQ1 (500 nM), or both for 4 days. Graphs show final cell counts. Dashed purple lines denote starting cell number (counted at day 0). Experiments are representative of 2 independent biological repeats. F, growth of two KPCY-derived tumor cell clones (6419c5, left; 2838c3, right) implanted subcutaneously into immune-competent C57Bl6/J mice and treated with either atorvastatin (10 mg/Kg), JQ1 (50 mg/Kg), or both, once a day after tumors became palpable (day 9 post-inoculation). G, tumor mass weight (same in F) after excision post-mortem. For panels A-E, bars show mean, +/− SD; for panels F-G, bars show mean +/− SEM (*, p<0.05; **, p<0.01; ***, p<0.001).

Comment in

References

    1. Borazanci E, Dang CV, Robey RW, Bates SE, Chabot JA, Von Hoff DD. Pancreatic Cancer: “A Riddle Wrapped in a Mystery inside an Enigma”. Clin Cancer Res. 2017;23:1629–1637. Available from: http://clincancerres.aacrjournals.org/content/23/7/1629.abstract - PubMed
    1. Rhim AD, Mirek ET, Aiello NM, Maitra A, Bailey JM, McAllister F, et al. EMT and dissemination precede pancreatic tumor formation. Cell. Elsevier Inc; 2012;148:349–61. Available from: 10.1016/j.cell.2011.11.025 - DOI - PMC - PubMed
    1. Noone AM, Howlander N, Krapcho M, Miller D, Brest A, et al. , SEER Cancer Statistics Review, 1975–2015, National Cancer Institute. Bethesda, MD: Available from: https://seer.cancer.gov/csr/1975_2015/, based on November 2017 SEER data submission, posted to the SEER web site, April 2018.
    1. Ying H, Kimmelman AC, Lyssiotis CA, Hua S, Chu GC, Fletcher-Sananikone E, et al. Oncogenic kras maintains pancreatic tumors through regulation of anabolic glucose metabolism. Cell. Elsevier Inc; 2012;149:656–70. Available from: 10.1016/j.cell.2012.01.058 - DOI - PMC - PubMed
    1. Halbrook CJ, Lyssiotis CA. Employing Metabolism to Improve the Diagnosis and Treatment of Pancreatic Cancer. Cancer Cell. Elsevier; 2017. page 5–19. - PubMed

Publication types

MeSH terms

LinkOut - more resources