

Association of body mass index and waist-to-hip ratio with brain structure: UK Biobank study
- PMID: 30626649
- PMCID: PMC8093082
- DOI: 10.1212/WNL.0000000000006879
Association of body mass index and waist-to-hip ratio with brain structure: UK Biobank study
Abstract
Objective: To examine the association of body mass index (BMI) and waist-to-hip ratio (WHR) with brain volume.
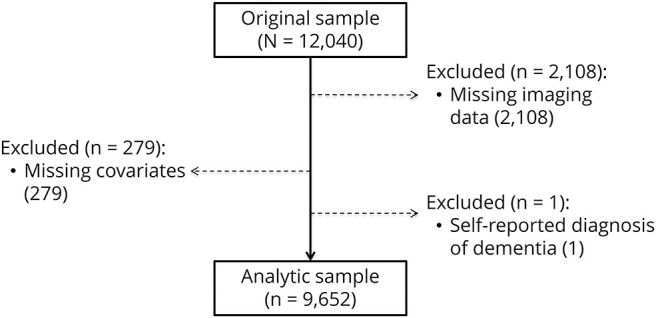
Methods: We used cross-sectional data from the UK Biobank study (n = 9,652, age 55.4 ± 7.5 years, 47.9% men). Measures included BMI, WHR, and total fat mass as ascertained from bioimpedance. Brain images were produced with structural MRI.
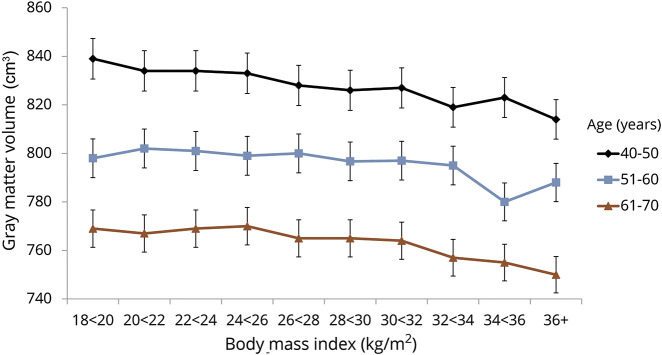
Results: After adjustment for a range of covariates, higher levels of all obesity measures were related to lower gray matter volume: BMI per 1 SD (β coefficient -4,113, 95% confidence interval [CI] -4,862 to -3,364), WHR (β coefficient -4,272, 95% CI -5,280 to -3,264), and fat mass (β coefficient -4,590, 95% CI -5,386 to -3,793). The combination of overall obesity (BMI ≥30 kg/m2) and central obesity (WHR >0.85 for women, >0.90 for men) was associated with the lowest gray matter compared with that in lean adults. In hypothesis-free testing with a Bonferroni correction, obesity was also related to various regional brain volumes, including caudate, putamen, pallidum, and nucleus accumbens. No associations between obesity and white matter were apparent.
Conclusion: The combination of heightened BMI and WHR may be an important risk factor for gray matter atrophy.
© 2019 American Academy of Neurology.
Figures

References
-
- Anstey KJ, Cherbuin N, Budge M, Young J. Body mass index in midlife and late-life as a risk factor for dementia: a meta-analysis of prospective studies. Obes Rev 2011;12:e426–e437. - PubMed
-
- Emmerzaal TL, Kiliaan AJ, Gustafson DR. 2003-2013: A decade of body mass index, Alzheimer's disease, and dementia. J Alzheimers Dis 2015;43:739–755. - PubMed
-
- Qizilbash N, Gregson J, Johnson ME, et al. BMI and risk of dementia in two million people over two decades: a retrospective cohort study. Lancet Diabetes Endocrinol 2015;3:431–436. - PubMed
Publication types
MeSH terms
Grants and funding
LinkOut - more resources
Full Text Sources