. 2019 Mar 5;93(6):e02051-18.
doi: 10.1128/JVI.02051-18. Print 2019 Mar 15.

Establishment of a Novel Humanized Mouse Model To Investigate In Vivo Activation and Depletion of Patient-Derived HIV Latent Reservoirs

Affiliations

Establishment of a Novel Humanized Mouse Model To Investigate In Vivo Activation and Depletion of Patient-Derived HIV Latent Reservoirs

Nina C Flerin et al. J Virol. .

Abstract

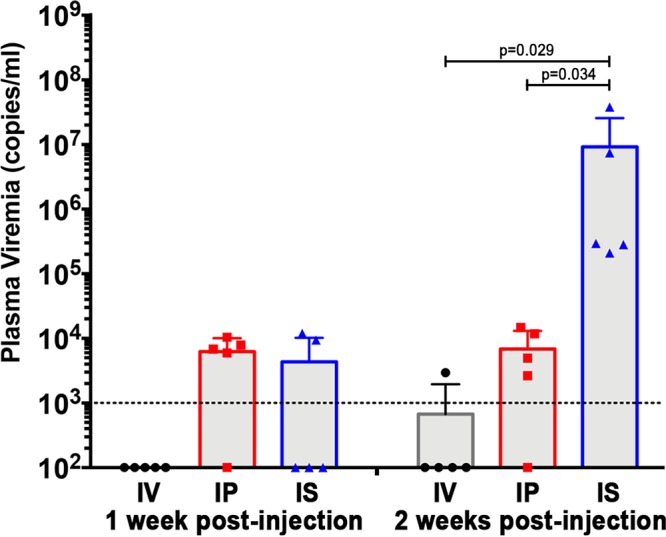
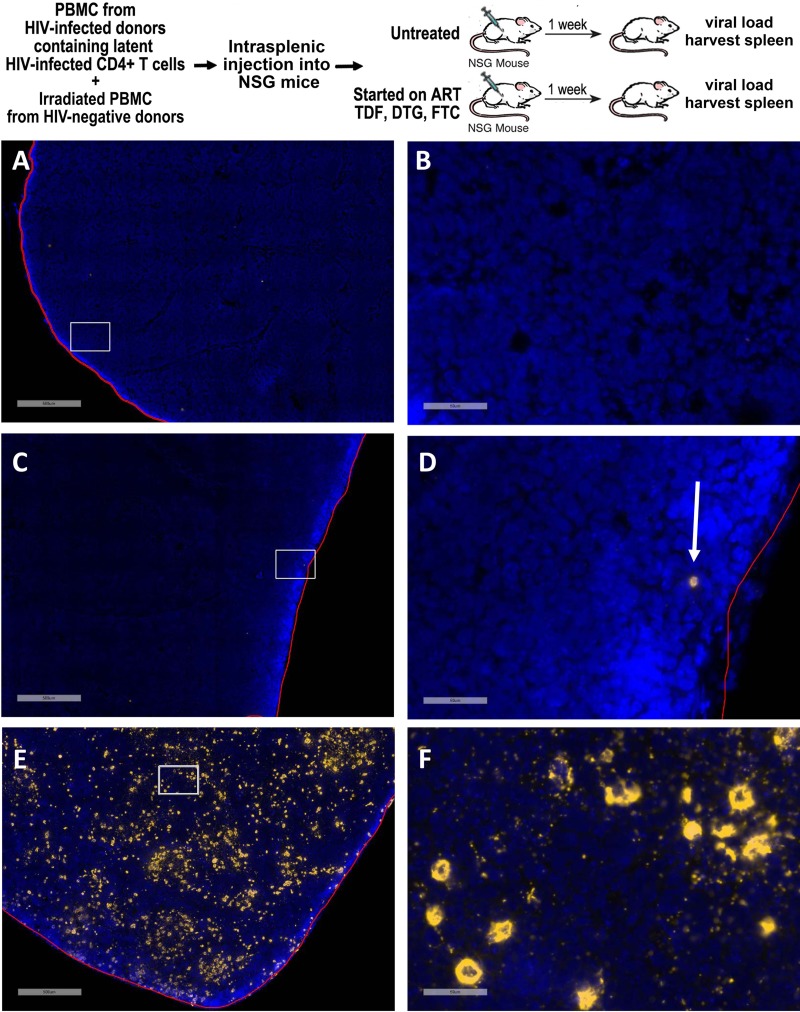
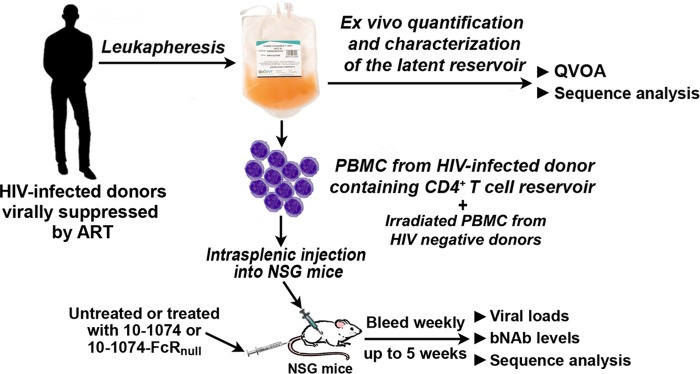
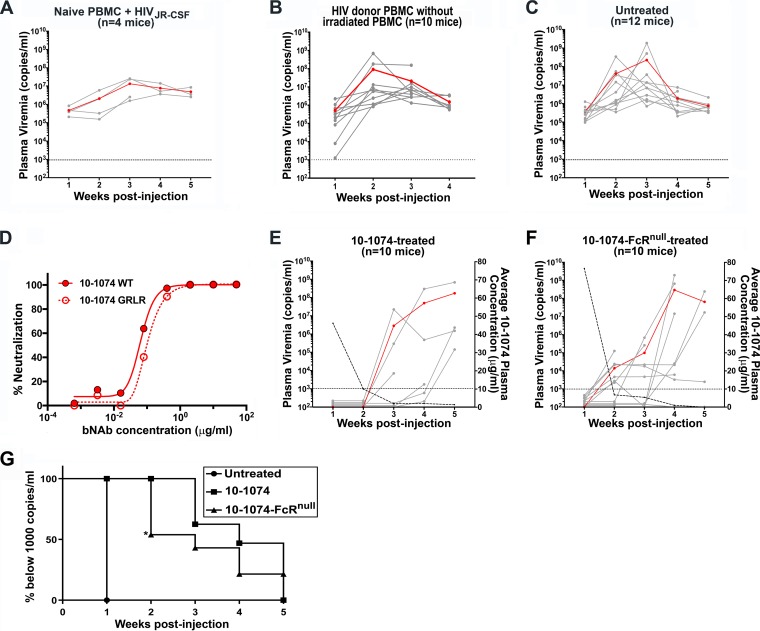
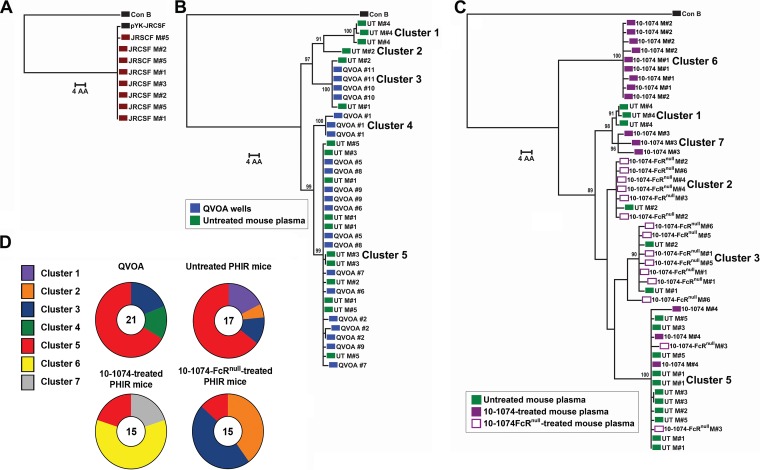
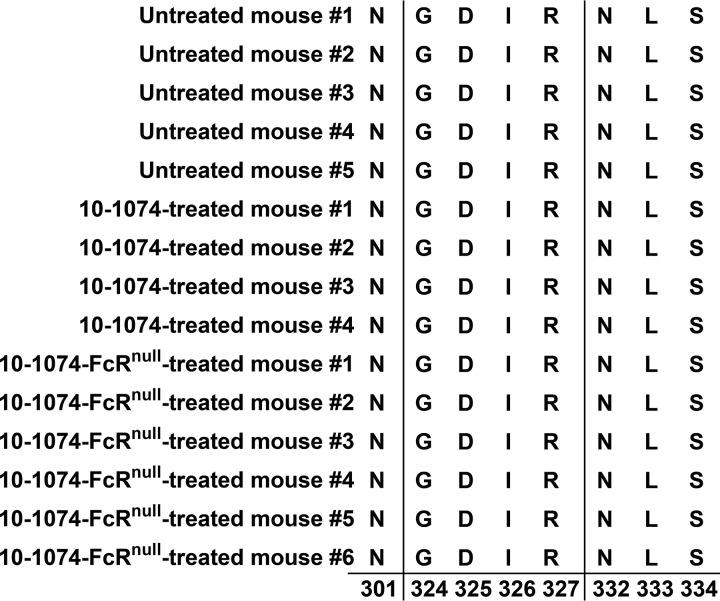
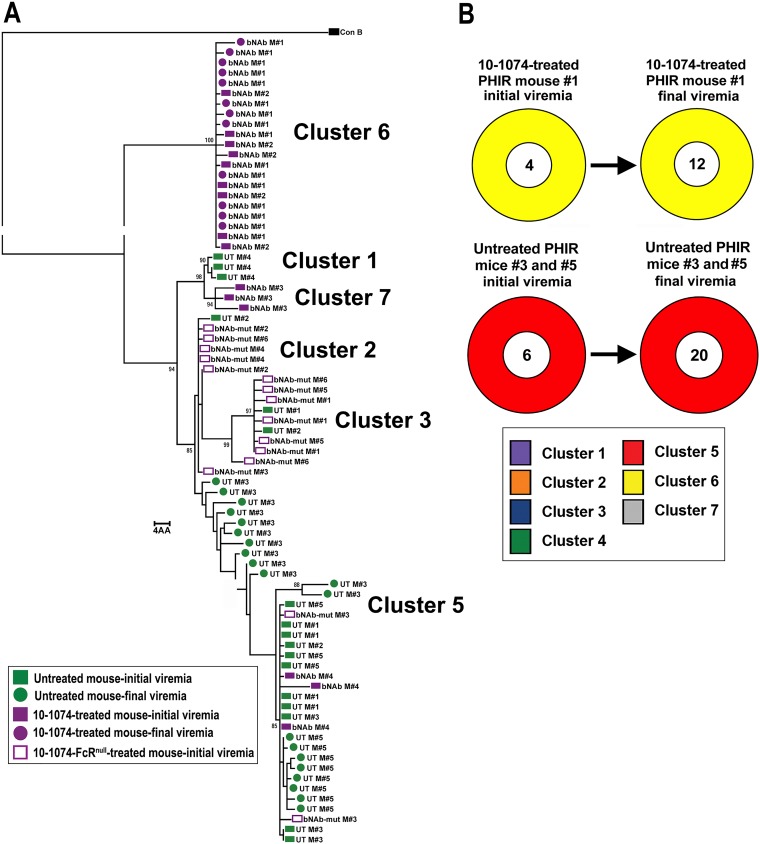
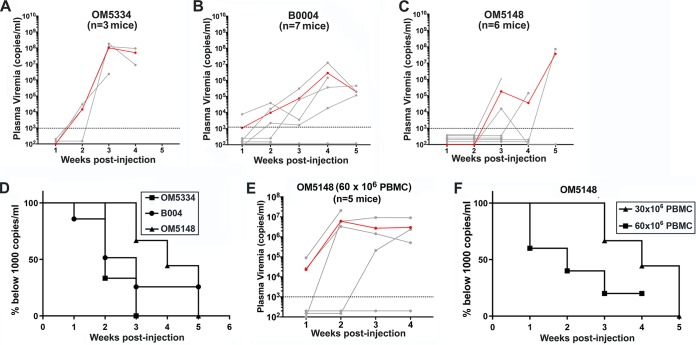
Curing HIV infection has been thwarted by the persistent reservoir of latently infected CD4+ T cells, which reinitiate systemic infection after antiretroviral therapy (ART) interruption. To evaluate reservoir depletion strategies, we developed a novel preclinical in vivo model consisting of immunodeficient mice intrasplenically injected with peripheral blood mononuclear cells (PBMC) from long-term ART-suppressed HIV-infected donors. In the absence of ART, these mice developed rebound viremia which, 2 weeks after PBMC injection, was 1,000-fold higher (mean = 9,229,281 HIV copies/ml) in mice injected intrasplenically than in mice injected intraperitoneally (mean = 6,838 HIV copies/ml) or intravenously (mean = 591 HIV copies/ml). One week after intrasplenic PBMC injection, in situ hybridization of the spleen demonstrated extensive disseminated HIV infection, likely initiated from in vivo-reactivated primary latently infected cells. The time to viremia was delayed significantly by treatment with a broadly neutralizing antibody, 10-1074, compared to treatment with 10-1074-FcRnull, suggesting that 10-1074 mobilized Fc-mediated effector mechanisms to deplete the replication-competent reservoir. This was supported by phylogenetic analysis of Env sequences from viral-outgrowth cultures and untreated, 10-1074-treated, or 10-1074-FcRnull-treated mice. The predominant sequence cluster detected in viral-outgrowth cultures and untreated mouse plasma was significantly reduced in the plasma of 10-1074-treated mice, whereas two new clusters emerged that were not detected in viral-outgrowth cultures or plasma from untreated mice. These new clusters lacked mutations associated with 10-1074 resistance. Taken together, these data indicated that 10-1074 treatment depletes the reservoir of latently infected cells harboring replication competent HIV. Furthermore, this mouse model represents a new in vivo approach for the preclinical evaluation of new HIV cure strategies.IMPORTANCE Sustained remission of HIV infection is prevented by a persistent reservoir of latently infected cells capable of reinitiating systemic infection and viremia. To evaluate strategies to reactivate and deplete this reservoir, we developed and characterized a new humanized mouse model consisting of highly immunodeficient mice intrasplenically injected with peripheral blood mononuclear cells from long-term ART-suppressed HIV-infected donors. Reactivation and dissemination of HIV infection was visualized in the mouse spleens in parallel with the onset of viremia. The applicability of this model for evaluating reservoir depletion treatments was demonstrated by establishing, through delayed time to viremia and phylogenetic analysis of plasma virus, that treatment of these humanized mice with a broadly neutralizing antibody, 10-1074, depleted the patient-derived population of latently infected cells. This mouse model represents a new in vivo approach for the preclinical evaluation of new HIV cure strategies.

Keywords: HIV; latent infection; reservoir.


Figures

FIG 1
FIG 1
Comparison of the onset of viremia after intrasplenic, intraperitoneal, and intravenous injection of HIV+ donor PBMC into NSG mice. The viral loads in the plasma of NSG mice (n = 5 mice/group) 1 week and 2 weeks after coinjection of PBMC from an ART-suppressed HIV+ donor (30 × 106 cells) and irradiated allogeneic PBMC (6 × 106 cells) by either intrasplenic, intraperitoneal, or intravenous injection. The data are presented as a dot plot graph of the viral load for each mouse, and the group means ± the standard deviations (SD) for each group and time point are shown. The dotted line represents the detection limit of 1,000 copies/ml.
FIG 2
FIG 2
Visualization of latency reactivation and spread of infection in the SPHIR mouse spleens. The experimental protocol is summarized in the top panel. OM5001 SPHIR mice generated by intrasplenic injection of NSG mice with OM5001 PBMC (30 × 106) and irradiated allogeneic PMBC (6 × 106) were either treated with daily intraperitoneal injections of tenofovir disoproxil fumarate, emtricitabine, and dolutegravir (n = 2 mice) or left untreated (n = 1 mouse). One week later, spleen sections were analyzed by using RNAscope for HIV RNA expression (gold) and counterstained with DAPI (blue). (A to F) Representative images of a control NSG mouse spleen at ×4 magnification (A), with the highlighted box shown at ×40 magnification (B); an ART-treated OM5001 SPHIR mouse spleen at ×4 magnification (C), with the highlighted box shown at ×40 magnification and with an HIV RNA-positive cell indicated by an arrow (D); and an untreated OM5001 NSG mouse spleen at ×4 magnification (E), with the highlighted box shown at ×40 magnification (F). Scale bars: A, C, and E, 500 μm; B, D, and F, 50 μm.
FIG 3
FIG 3
Experimental protocol for construction of SPHIR mice and treatment studies. PBMC from HIV-infected donors virally suppressed by ART (<50 copies/ml) for >20 months were obtained by leukapheresis and intrasplenically injected into NSG mice with irradiated allogeneic PBMC from HIV-naive donors. Some mice were intravenously injected with bNAb 10-1074 or bNAb 10-1074-FcRnull at the time of intrasplenic injection (0.5 mg/mouse). The mice were bled weekly for viral load quantification and sequence analysis.
FIG 4
FIG 4
Construction of SPHIR mice and treatment with 10-1074 or 10-1074-FcRnull. (A) Plasma HIV RNA levels (copies/ml) in individual NSG mice were measured at weekly intervals after intrasplenic coinjection of irradiated allogeneic PBMC (6 × 106 cells) and 30 × 106 of HIV-naive PBMC and HIVJR-CSF (∼1 × 106 IU/3 × 107 PBMC). (B and C) NSG mice were intrasplenically injected with OM5001 PBMC (30 × 106) with either no added irradiated allogeneic PMBCs (B) or coinjected with irradiated allogeneic PMBCs (6 × 106) from three HIV-naive donors (C). HIV loads in the plasma were measured in weekly bleeds and are indicated by solid gray lines, with the geometric mean of plasma viremia indicated by a red line (scale on the left axis). The dotted line represents detection limit of 1,000 copies/ml. (D) The neutralization activity of 10-1074 and 10-1074-FcRnull was evaluated by ex vivo neutralization of infection of TZM-bl cells with a 10-1074-sensitive subtype B virus, X2278, with the indicated concentrations of 10-1074 and 10-1074-FcRnull. (E and F) Mice were intrasplenically coinjected with OM5001 PBMC (30 × 106) with irradiated allogeneic PMBC (6 × 106) from three HIV-naive donors and intravenously treated with one dose (0.5 mg) of either unmodified 10-1074 (E) or 10-1074-FcRnull (F). The mice were bled weekly to measure HIV loads in the plasma and the 10-1074 or 10-1074-FcRnull plasma concentrations. The plasma viral loads of individual mice are indicated by solid gray lines, with the geometric mean of plasma viremia indicated by a red line (scale on left axis), and the dotted line represents detection limit of 1,000 copies/ml. The average plasma antibody concentration in the mice is indicated by the dashed line (scale on the right axis). (G) Kaplan-Meier plots summarizing the time-to-viremia data. The percentage of mice with undetectable viremia after intrasplenic injection with OM5001 PBMC and irradiated allogeneic PMBC with no treatment (C) or treated with 10-1074 (E) or 10-1074-FcRnull (F) is displayed on the y axis, and the time when viremia was first detected is displayed on the x axis. The indicated level of statistical significance (*) at week 2 comparing 10-1074-treated and 10-1074-FcRnull-treated mice was P = 0.0195 and was determined by a log-rank test and chi-square analysis with df = 1 for comparing the survival probability between two groups.
FIG 5
FIG 5
Phylogenetic Env trees on initial viremia sequences. A maximum-likelihood phylogenetic tree of gp160 Env protein sequences aligned to consensus subtype B sequence and midpoint rooted for visualization is shown. Bootstrap values over 85 for dominant branches are presented. (A) Comparison to the pYK-JRCSF plasmid sequence of eight plasma sequences from four mice 1 week after injection with HIV-naive PBMC and clonal HIV-1JR-CSF. (B) Comparison of 21 sequences from nine OM5001 QVOA culture wells to 17 sequences from the plasma of five untreated SPHIR mice obtained 1 week after intrasplenic injection of OM5001 PBMC (UT). (C) Comparison of the 17 HIV plasma sequences from the untreated OM5001-SPHIR mice (UT) shown in panel B to 15 HIV plasma sequences from four 10-1074-treated OM5001-SPHIR mice (10-1074) and 15 HIV plasma sequences from six 10-1074-FcRnull-treated OM5001-SPHIR mice (10-1074-FcRnull) obtained from the first weekly bleed with detectible viremia. Each colored symbol indicates one sequence, and all are labeled by the individual QVOA well number or mouse number. (D) Fraction of sequence from each cluster determined by phylogenetic analysis (see panels B and C) from QVOA culture wells and plasma from untreated, 10-1074-treated, or 10-1074-FcRnull-treated OM5001 SPHIR mice. The number in the center of each ring indicates the total number of sequences analyzed.
FIG 6
FIG 6
Absence of mutations in the V3 Env region associated with 10-1074 resistance. Amino acid alignment of HxB2 Env positions 301, 324 to 327, and 332 to 334 of SGS sequences from RNA extracted from circulating HIV at the initial detection of viremia in the plasma of untreated (n = 5 mice), 10-1074-treated (n = 4 mice), and 10-1074null-treated OM5001 PHIR mice (n = 6 mice). These include the potential N-linked glycosylation sites at N301 and at N332 and the 324G(D/N)IR327 motif at the base of the V3 loop.
FIG 7
FIG 7
Phylogenetic Env trees comparing initial viremia to final viremia sequences. A maximum-likelihood phylogenetic tree of gp160 Env protein sequences aligned to consensus subtype B sequence and midpoint rooted for visualization is shown. Bootstraps over 85 for dominant branches are also shown. (A) Comparison of the 17 HIV plasma sequences from five untreated OM5001-SPHIR mice at initial viremia (UT), 20 HIV plasma sequences from two untreated OM5001-SPHIR mice at final viremia (UT M#3 and M#5), 15 HIV plasma sequences from four 10-1074-treated OM5001-SPHIR mice at initial viremia (bNAb), 12 HIV plasma sequences from one 10-1074-treated OM5001-SPHIR mouse (bNAb M#1) at final viremia, and 15 HIV plasma sequences from six 10-1074-FcRnull-treated OM5001-SPHIR mice (bNAb-mut). Each colored symbol indicates one sequence, and all are labeled by the individual QVOA well number or mouse number. Initial bleeds are indicated by a square and final bleed by a circle. (B) Comparison of the fraction of sequence from each cluster determined by phylogenetic analysis from untreated M#3 and M#5 initial viremia to final viremia and from 10-1074-treated M#1 initial viremia to final viremia. The number in the center of each ring indicates the total number of sequences analyzed.
FIG 8
FIG 8
In vivo reactivation of latently HIV-infected donor cells results in plasma viremia. Plasma HIV RNA levels (copies/ml) in individual NSG mice were measured at weekly intervals after intrasplenic coinjection of irradiated allogeneic PBMC (6 × 106 cells) and 30 × 106 of OM5334 donor PBMC (A), B004 donor PBMC (B), or OM5148 donor PBMC (C). The geometric mean plasma viremia (red line) and the detection limit of 1,000 copies/ml (dotted line) are shown. (D) Kaplan-Meier plots summarizing the time-to-viremia data. The percentages of mice with undetectable viremia (<1,000 copies/ml) after intrasplenic injection with 30 × 106 PBMC from either donor OM5334, B004, or OM5148 shown in panels A, B, and C are displayed on the y axis, and the times when viremia was first detected are displayed on the x axis. (E) The viral loads in the plasma of NSG mice after intrasplenic coinjection of OM5148 PBMC (60 × 106 cells) and irradiated allogeneic PBMC (12 × 106 cells). The red line indicates the geometric mean of plasma viremia. The dotted line represents detection limit of 1,000 copies/ml. (F) Kaplan-Meier plots summarizing the time-to-viremia data. The percentages of mice with undetectable viremia (<1,000 copies/ml) after intrasplenic injection with OM5148 PBMC (60 × 106 cells) shown in panel E compared to OM5148 PBMC (30 × 106 cells) shown in panel C are displayed on the y axis, and the times when viremia was first detected are displayed on the x axis.

Similar articles

Cited by

References

    1. Ho YC, Shan L, Hosmane NN, Wang J, Laskey SB, Rosenbloom DI, Lai J, Blankson JN, Siliciano JD, Siliciano RF. 2013. Replication-competent noninduced proviruses in the latent reservoir increase barrier to HIV-1 cure. Cell 155:540–551. doi:10.1016/j.cell.2013.09.020. - DOI - PMC - PubMed
    1. Siliciano JD, Kajdas J, Finzi D, Quinn TC, Chadwick K, Margolick JB, Kovacs C, Gange SJ, Siliciano RF. 2003. Long-term follow-up studies confirm the stability of the latent reservoir for HIV-1 in resting CD4+ T cells. Nat Med 9:727–728. doi:10.1038/nm880. - DOI - PubMed
    1. Barouch DH, Deeks SG. 2014. Immunologic strategies for HIV-1 remission and eradication. Science 345:169–174. doi:10.1126/science.1255512. - DOI - PMC - PubMed
    1. Crooks AM, Bateson R, Cope AB, Dahl NP, Griggs MK, Kuruc JD, Gay CL, Eron JJ, Margolis DM, Bosch RJ, Archin NM. 2015. Precise quantitation of the latent HIV-1 reservoir: implications for eradication strategies. J Infect Dis 212:1361–1365. doi:10.1093/infdis/jiv218. - DOI - PMC - PubMed
    1. Laird GM, Eisele EE, Rabi SA, Lai J, Chioma S, Blankson JN, Siliciano JD, Siliciano RF. 2013. Rapid quantification of the latent reservoir for HIV-1 using a viral outgrowth assay. PLoS Pathog 9:e1003398. doi:10.1371/journal.ppat.1003398. - DOI - PMC - PubMed

Publication types

MeSH terms

Substances