. 2019 Jan 10;4(1):e124002.
doi: 10.1172/jci.insight.124002.

Metabolic and microstructural alterations in the SLE brain correlate with cognitive impairment

Affiliations

Metabolic and microstructural alterations in the SLE brain correlate with cognitive impairment

Meggan Mackay et al. JCI Insight. .

Abstract

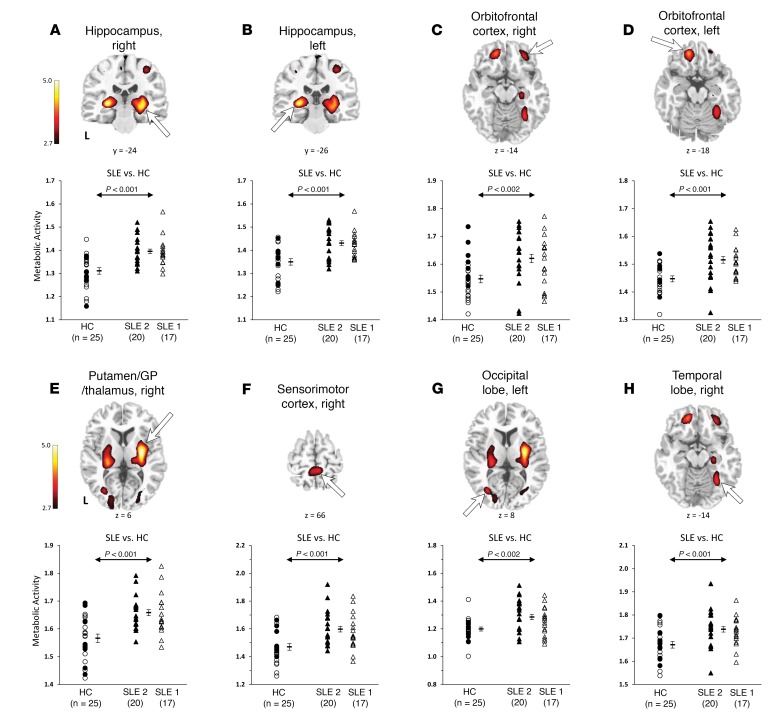
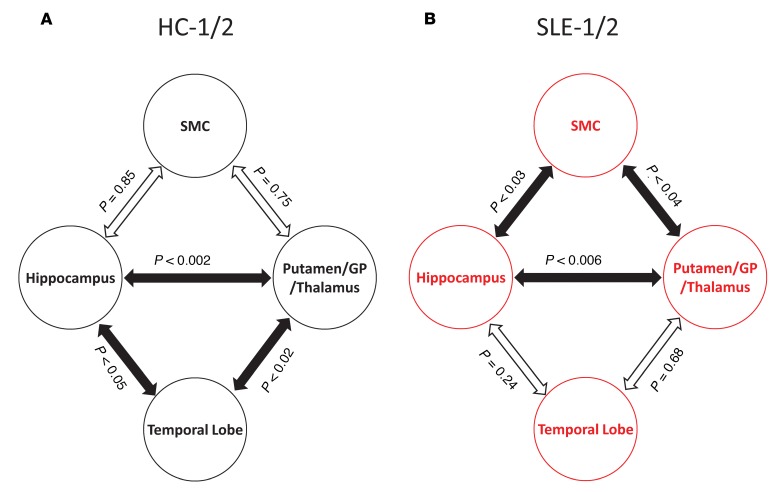
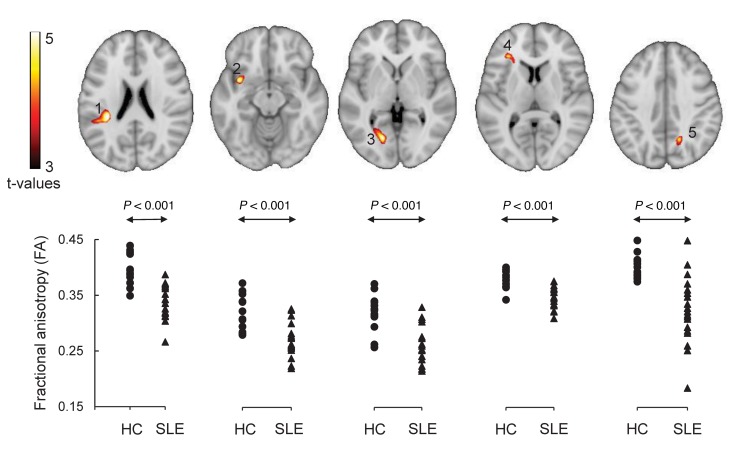
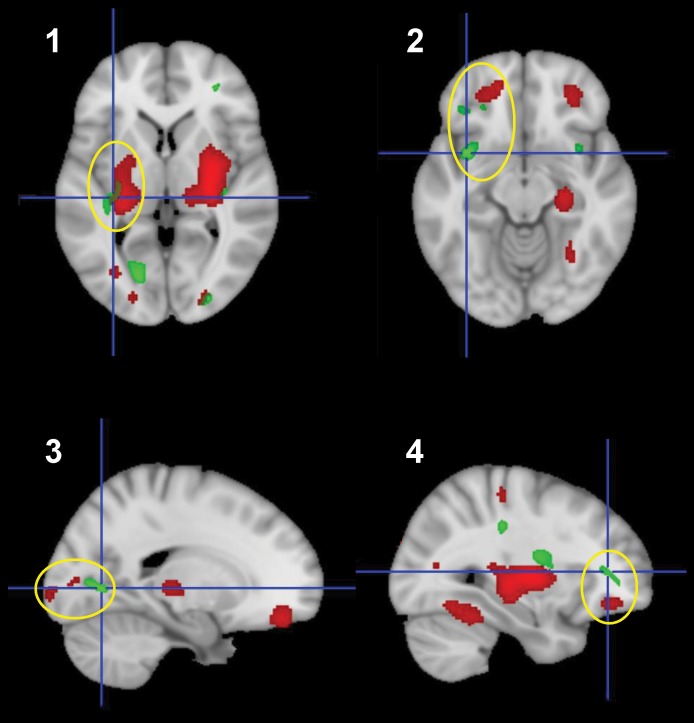
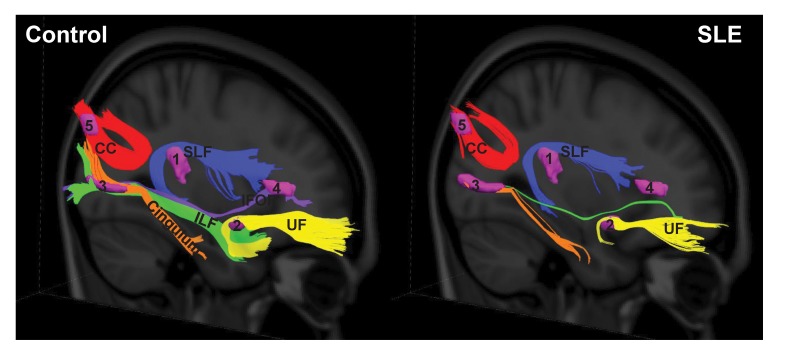
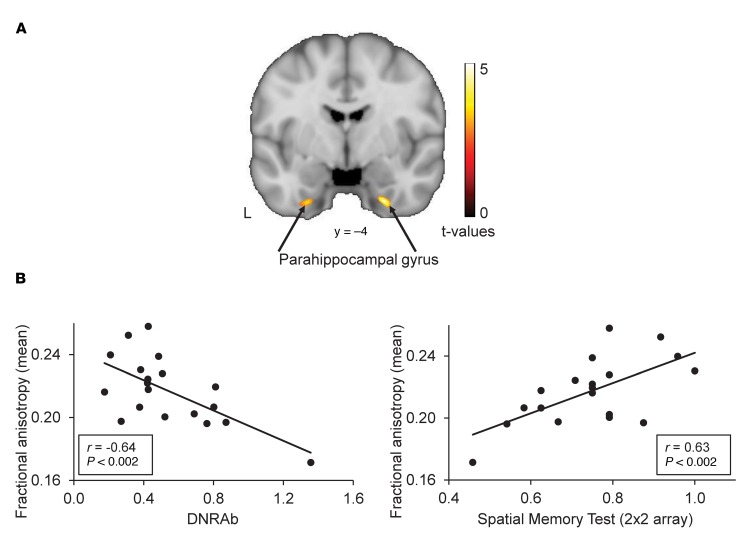
To address challenges in the diagnosis of cognitive dysfunction (CD) related to systemic lupus erythematosus-associated (SLE-associated) autoimmune mechanisms rather than confounding factors, we employed an integrated approach, using resting-state functional (FDG-PET) and structural (diffusion tensor imaging [DTI]) neuroimaging techniques and cognitive testing, in adult SLE patients with quiescent disease and no history of neuropsychiatric illness. We identified resting hypermetabolism in the sensorimotor cortex, occipital lobe, and temporal lobe of SLE subjects, in addition to validation of previously published resting hypermetabolism in the hippocampus, orbitofrontal cortex, and putamen/GP/thalamus. Regional hypermetabolism demonstrated abnormal interregional metabolic correlations, associated with impaired cognitive performance, and was stable over 15 months. DTI analyses demonstrated 4 clusters of decreased microstructural integrity in white matter tracts adjacent to hypermetabolic regions and significantly diminished connecting tracts in SLE subjects. Decreased microstructural integrity in the parahippocampal gyrus correlated with impaired spatial memory and increased serum titers of DNRAb, a neurotoxic autoantibody associated with neuropsychiatric lupus. These findings of regional hypermetabolism, associated with decreased microstructural integrity and poor cognitive performance and not associated with disease duration, disease activity, medications, or comorbid disease, suggest that this is a reproducible, stable marker for SLE-associated CD that may be may be used for early disease detection and to discriminate between groups, evaluate response to treatment strategies, or assess disease progression.

Keywords: Autoimmune diseases; Autoimmunity; Neuroimaging; Neuroscience.


Conflict of interest statement

Conflict of interest: The authors have declared that no conflict of interest exists.

Figures

Figure 1
Figure 1. Abnormal hypermetabolic regions in SLE.
Top: Voxel-wise comparison of the FDG-PET scans between the combined SLE-1/2 cohorts (n = 37) and healthy controls (HCs; n = 25) revealed significant increases in resting glucose metabolism in SLE subjects in the hippocampus (A and B), orbitofrontal cortex (BA 11) (C and D), and putamen/GP/thalamus (E), the same regions independently identified in SLE-1 (1) and SLE-2 (Supplemental Data). Three new hypermetabolic regions identified in the SLE-1/2 subjects include the SMC (F), occipital lobe (BA 19) (G), and temporal lobe (BA 37) (H). (Peak voxel of each cluster was significant at P < 0.001, uncorrected. Clusters for the hippocampus, putamen/GP/thalamus, and SMC were also significant at P < 0.05, corrected for cluster extent [Table 3]. Clusters were displayed using a red-yellow scale thresholded at P < 0.005 superimposed on a MRI template.). Bottom: Metabolism in these regions was significantly higher (P < 0.002) in the SLE-1/2 subjects (triangles) than in the healthy controls (circles) but not different between the SLE-1 (white triangles) and SLE-2 (black triangles) subjects (P > 0.41). (Error bar represents standard error of the mean. Arrow represents Student’s t test of SLE-1/2 subjects vs. HCs.)
Figure 2
Figure 2. Altered pattern of interregional metabolic correlations between abnormal hypermetabolic regions in SLE.
(A) Healthy controls (HC) demonstrate a normal pattern of interregional metabolic correlations such that resting metabolism among the hippocampus, putamen/GP/thalamus, and temporal lobe are all significantly correlated (filled arrows; P < 0.05). (B) In contrast, while the significant hippocampal-putamen/GP/thalamic metabolic relationship (P < 0.006) is preserved in SLE, other significant metabolic correlations shift away from the temporal lobe to include the SMC (P < 0.04).
Figure 3
Figure 3. Regions with abnormal microstructure in SLE subjects.
Significant reductions (P < 0.001) in FA were present in the following brain areas (top): 1, white matter tracts in the parietal lobe, a part of the superior longitudinal fasciculus (SLF); 2, white matter tracts in the vicinity of the insular, a part of the uncinate fasciculus (UF); 3, white matter tracts in the occipital lobe/cingulum (hippocampus); 4, white matter tracts in the frontal lobe, a part of the inferior frontal occipital fasciculus (IFOF); and 5, white matter tracts in the parietal lobe, a part of the splenium of corpus callosum (CC). Individual cluster fractional anisotropy (FA) values for the SLE and control groups were plotted (bottom). All group differences were highly significant (P < 0.001). The details of these brain regions were presented in Table 4.
Figure 4
Figure 4. Spatial proximity of white matter regions with abnormal reductions in fractional anisotropy in SLE-2 patients and areas of increased metabolic activity in adjacent gray matter.
White matter regions with abnormal reductions in fractional anisotropy are represented in green (clusters 1–4, see Figure 3 and Table 4); areas of increased metabolic activity in adjacent gray matter are represented in red (see Figure 1 and Table 3. Adjacent gray and white matter regions are encompassed by yellow ellipses. (Clusters represent areas with significant differences in local fractional anisotropy [FA] or metabolic activity in SLE vs. healthy control subjects [thresholded at T = 3.0, P < 0.005], overlaid on the MNI152 T1 MRI template.).
Figure 5
Figure 5. White matter pathways associated with the abnormal SLE-related regions visualized with group tractography.
The superior longitudinal fasciculus (temporal part) (SLF) (noted as 1), uncinate fasciculus (UF) (noted as 2), cingulum (hippocampus part) and inferior longitudinal fasciculus (ILF) (noted as 3), inferior frontal occipital fasciculus (IFOF) (noted as 4), and the splenium of the corpus callosum (CC) (noted as 5) pathways reconstructed in the healthy control (left) and SLE (right) groups. Fewer tracts were visualized in the SLE group relative to the controls in the SLF (temporal part) (−74%), UF (−86%), cingulum (hippocampus part) (−82%), ILF (–99.5%), IFOF (–100%), and splenium CC (−48%).
Figure 6
Figure 6. Microstructural integrity (FA) in the parahippocampus regions correlates with serum DNRAb titers and performance on a spatial memory test in SLE subjects.
(A) Regression analysis of voxel-wise correlations between FA maps and serum DNRAb titers revealed a significant inverse correlation between FA values in the bilateral parahippocampal gyrus (BA 36/BA 20; yellow/red areas) and serum DNRAb titers. (B) Mean microstructural integrity in the bilateral parahippocampal gyrus exhibited a negative correlation with serum DNRAb titers (r = –0.64, P < 0.002, left). Mean microstructural integrity in the bilateral parahippocampal gyrus also exhibited a positive correlation with performance on a spatial memory test (r = 063, P < 0.002, right). Pearson’s product-moment correlation coefficient was used to evaluate the correlations between FA values and serum DNRAb titers and 2x2SMT scores.

References

    1. Ainiala H, Loukkola J, Peltola J, Korpela M, Hietaharju A. The prevalence of neuropsychiatric syndromes in systemic lupus erythematosus. Neurology. 2001;57(3):496–500. doi: 10.1212/WNL.57.3.496. - DOI - PubMed
    1. Brey RL, et al. Neuropsychiatric syndromes in lupus: prevalence using standardized definitions. Neurology. 2002;58(8):1214–1220. doi: 10.1212/WNL.58.8.1214. - DOI - PubMed
    1. Appenzeller S, Cendes F, Costallat LT. Cognitive impairment and employment status in systemic lupus erythematosus: a prospective longitudinal study. Arthritis Rheum. 2009;61(5):680–687. doi: 10.1002/art.24346. - DOI - PubMed
    1. Calderón J, et al. Impact of cognitive impairment, depression, disease activity, and disease damage on quality of life in women with systemic lupus erythematosus. Scand J Rheumatol. 2017;46(4):273–280. doi: 10.1080/03009742.2016.1206617. - DOI - PubMed
    1. Jönsen A, Bengtsson AA, Nived O, Ryberg B, Sturfelt G. Outcome of neuropsychiatric systemic lupus erythematosus within a defined Swedish population: increased morbidity but low mortality. Rheumatology (Oxford) 2002;41(11):1308–1312. doi: 10.1093/rheumatology/41.11.1308. - DOI - PubMed