. 2019 Jan;565(7738):186-191.
doi: 10.1038/s41586-018-0830-7. Epub 2019 Jan 9.

De novo design of potent and selective mimics of IL-2 and IL-15

Affiliations

De novo design of potent and selective mimics of IL-2 and IL-15

Daniel-Adriano Silva et al. Nature. 2019 Jan.

Abstract

We describe a de novo computational approach for designing proteins that recapitulate the binding sites of natural cytokines, but are otherwise unrelated in topology or amino acid sequence. We use this strategy to design mimics of the central immune cytokine interleukin-2 (IL-2) that bind to the IL-2 receptor βγc heterodimer (IL-2Rβγc) but have no binding site for IL-2Rα (also called CD25) or IL-15Rα (also known as CD215). The designs are hyper-stable, bind human and mouse IL-2Rβγc with higher affinity than the natural cytokines, and elicit downstream cell signalling independently of IL-2Rα and IL-15Rα. Crystal structures of the optimized design neoleukin-2/15 (Neo-2/15), both alone and in complex with IL-2Rβγc, are very similar to the designed model. Neo-2/15 has superior therapeutic activity to IL-2 in mouse models of melanoma and colon cancer, with reduced toxicity and undetectable immunogenicity. Our strategy for building hyper-stable de novo mimetics could be applied generally to signalling proteins, enabling the creation of superior therapeutic candidates.


Figures

Figure E1.
Figure E1.. Therapeutic effect of Neo-2/15 on colon cancer.
a) BALB/C mice were inoculated with CT26 tumors. Starting on day 9 and ending on day 14, mice were treated daily with i.p. injection of mIL-2 or Neo-2/15 at the specified concentrations (n = 4 per group), or were left untreated (n=6 per group). Tumor growth curves (top) show data only for surviving mice and stop if a mice/group fell below 50% of the initial number of subjects. Survival curves (bottom). Mice were euthanized when weight loss exceeded 10% of initial weight or when tumor size reached 1,300 mm3. The experiments were performed twice with similar results. b-d) The bar-plots compare the T cell populations for BALB/C mice (n=3 per group) that were inoculated with CT26 tumors and treated starting from day 6 with by daily i.p. injection of 10μg of Neo-2/15 or 10μg mIL-2 or no-treatment (No Tx). On day 14 the percentage of Treg cells (CD4+ CD45+ FoxP3+, top graph) and CD8:Treg cell ratio ((CD45+ CD3+ CD8+ )/ Treg, bottom graph) was assessed in: b) tumors, c) neighboring inguinal lymph node (LN), and d) spleen. Whiskers represent ∓1-standard deviation and are centered in the mean. Results were analyzed by one-way ANOVA (95% confidence interval), except for survival curves that were assessed using the Mantel-cox test (95% confidence interval). The experiments performed twice with similar results. In all cases, whiskers are centered on the mean and in bar plots represent ∓1-standard deviation, while in growth curves represent ∓1-standard error of the mean. Results were analyzed by one-way ANOVA (95% confidence interval), except for survival curves that were assessed using the Mantel-cox test (95% confidence interval).
Figure E2.
Figure E2.. Therapeutic effect of Neo-2/15 on melanoma.
Survival curves (top) and tumor growth curves (bottom) for C57BL/6 mice that were inoculated with B16 tumors (as in Fig. 4a) and treated with low (1 μg/mice/day) or high doses of Neo-2/15 (10 μg/mice/day). a) Starting on day 1, mice (n = 5 per group) were treated daily with i.p. injection of left: single agent Neo-2/15 at 1 μg/mice or equimolar mIL-2, or right: the same treatments in combination a twice-weekly treatment with TA99 (started on day 5). Mice were euthanized when tumor size reached 2,000 mm3. Tumor growth curves show data only for surviving mice and stop if a mice/group fell below 50% of the initial number of subjects. The experiments were performed twice with similar results; b) similar to “a”, but starting on day 4, mice (n = 5 per group) were treated daily with i.p. injection of left: single agent Neo-2/15 at 10 μg/mice or equimolar mIL-2; right: the same treatments in combination a twice-weekly treatment with TA99 (started on day 4). Mice were euthanized when tumor size reached 1,000 mm3. The therapeutic effect of Neo-2/15 is dose-dependent (higher doses are better) and is potentiated in the presence of the antibody TA99. Tumor growth curves show data only for surviving mice and stop if a mice/group fell below 50% of the initial number of subjects. The experiments were performed twice with similar results; c) C57BL/6 mice were immunized with 500 μg K.O. Neo-2/15 in complete Freund’s adjuvant and boosted on days 7 and 15 with 500 μg K.O. Neo-2/15 in incomplete Freund’s adjuvant. Reactivity against K.O. Neo-2/15 and native Neo-2/15 and cross-reactivity with mIL-2 were determined by incubation of serum (diluted 1:1000 in PBS) with plate-bound K.O. Neo-2/15, Neo-2/15, or mIL-2 as indicated. Serum binding was detected using an anti-mouse secondary antibody conjugated to HRP followed by incubation with TMB. Data are reported as optical density at 450 nm. Top: naive mouse serum; bottom: immunized serum. The experiments were performed once. In all the growth curves the whiskers represent ∓1-standard error of the mean. Results were analyzed by one-way ANOVA (95% confidence interval), except for survival curves that were assessed using the Mantel-cox test (95% confidence interval).
Figure E3.
Figure E3.. Single disulfide-stapled variants of Neo-2/15 with higher thermal stability.
Structural models of disulfide-stabilized variants of Neo-2/15 (gray) are shown superposed on the ternary crystal structure of Neo-2/15 (red) with mutated residues highlighted in magenta and the disulfide bond shown in gold. Two strategies were used to generate the disulfide stapled variants: a) (top) internal placement of the disulfide linking residues 38 and 75. The plot at the (bottom) is the experimental CD spectra of the design at 25°C, 95°C and then cooled back to 25°C, complete ellipticity-spectra recovery (full reversibility) upon cooling was observed; b) (top) for the terminal disulfide variant, three residues were added to each terminus in order to allow the disulfide to be formed without generating distortions to Neo-2/15’s structure. The plot at the (bottom) is the experimental CD spectra of the design at 25°C, 95°C and then cooled back to 25°C, complete ellipticity-spectra recovery (full reversibility) upon cooling was observed; c) thermal melts of each disulfide variant in panel “a) and b)” were followed by its circular dichroism signal (222 nm) from 25°C to 95°C (heating rate ~2°C/min). Each of the disulfide-stapled variants shows improved stability relative native Neo-2/15; d) the binding strength of each disulfide variant was measured by biolayer interferometry, showing that the introduction of the disulfide bonds does not disrupt binding. Furthermore, both disulfide variants exhibit an improvement in binding IL-2Rβγc (Kd ~ 1.3 ± 0.49 and 1.8 ± 0.26 nM, for the internal and external disulfide-staples, respectively), compared to Neo-2/15 (Kd ~ 6.9 ± 0.61 nM for) under the same experimental conditions. These results are consistent with the expected effect of disulfide-induced stabilization on a de novo protein binding site. Thermal denaturation experiments performed 3 times with similar results, and binding experiments were performed once.
Figure E4.
Figure E4.. The stimulatory effect of Neo-2/15 on human CAR-T cells.
a) Anti-CD3/CD28 stimulated or b) unstimulated human primary CD4 (top) or CD8 (bottom) T cells were cultured in indicated concentrations of human IL-2 or Neo-2/15. T cell proliferation is measured as fold change over T cells cultured without IL-2 supplement. The experiments were performed 3 times with similar results. Whiskers represent ∓1-standard deviation and are centered in the mean; c) NSG mice inoculated with 0.5×10^6 RAJI tumor cells were treated with 0.8×10^6 anti-CD19 CAR-T cells 7 days post tumor inoculation. Tumor growth was analyzed by bioluminescence imaging. The experiment was performed once.
Figure E5.
Figure E5.. Immunogenicity of Neo-2/15 in healthy naive mice.
a) Naive C57BL/6 mice were treated daily with Neo-2/15 (n = 10), K.O. Neo-2/15 (n = 5), mIL-2 (n = 5) or left untreated (n = 5). After 28 days, blood was drawn and analyzed. IgG against Neo-2/15, mIL-2, hIL-2, K.O. Neo-2/15, and ovalbumin were detected in treated-mouse sera diluted 1:100 by ELISA. 10% fetal bovine serum was used as a negative control. Polyclonal antibody against Neo-2/15 was used as a positive control. All statistical comparisons between sera from treated mice and negative control serum were not significant (two-way ANOVA with a 95% confidence interval). All statistical comparisons between Neo-2/15 and mIL-2 treated mice serum were not significant (two-way ANOVA with a 95% confidence interval). The experiments were performed once. b) After 14 days, immune cell populations in the blood of treated mice were quantified by flow cytometry. B : T cell ratio (top right) was calculated by dividing the percentage of B220+ cells by the percentage of CD3+ cells. CD8+ : CD4+ cell ratio (top left) was calculated by dividing the percentage of CD3+ cells that were CD8+ by those that were CD4+. NK cells (bottom left) were identified by their expression of NK1.1. Results were analyzed by one-way ANOVA (95% confidence interval). The experiments were performed once. In all cases, whiskers represent ∓1-standard deviation and are centered in the mean.
Figure E6.
Figure E6.. Kinetics of phosphorylation of STAT5 with Neo-2/15 treatment.
Naive C57BL/6 mice were treated once with 13 μg mIL-2 (n = 5) or 10 μg Neo-2/15 (n = 5), or were left untreated (n = 5). Phosphorylation of STAT5 was measured in peripheral blood at the indicated time points by flow cytometry using an anti-pSTAT5 antibody (eBioscience). Mean fluorescence intensity (MFI) is reported at each time point for TCRβ+ CD8+ cells (top) and TCRβ- B220+ cells (bottom). Whiskers represent ∓1-standard deviation and are centered in the mean. Results were analyzed by one-way ANOVA (75% confidence interval). The experiments were performed once.
Figure E7.
Figure E7.. Conformational flexibility of Neo-2/15 in MD simulations.
a) MD simulations started from the computational model of Neo-2/15 (top) converged into structures similar to the crystal conformation. Apo-Neo-2/15 is shown in red thick tubes (chain A from PDBid: 6GD6) and 45 (randomly selected) MD conformations from 5-independent MD simulations are shown in thin grey tubes; (bottom) the plot shows the r.m.s.d. along 5-independent MD simulations (avg r.m.s.d.= 1.93 Å); b) similar to “a)” but for (control) MD simulations started from the crystallographic structure of hIL-2. (Top) The crystal conformation of hIL-2 (chain A from PDBid: 2B5I) is shown in blue thick tubes and 45 (randomly selected) MD conformations from 5-independent simulations are shown in thin grey tubes (avg r.m.s.d.= 2.02 Å); c) (top) similar to “a-b” shows MD structures for simulations started from the computational model of Neo-2/15 bound to the hIL-2RβƔc; (middle-top) the plot shows the r.m.s.d. along 5-independent MD simulations (avg r.m.s.d. to apo-Neo-2/15 (model)= 1.28 Å); (middle-bottom) shows the nearest conformation (to the Apo-Neo-2/15 computational model) that were sampled on each of the 5-independent MD simulations performed (structures from the first 50ns of MD simulation were not considered); (bottom) shows a 2d-scatter plot (and the underlying density plot, where yellow, blue, green and purple colors represent decreasing densities) that compares the r.m.s.d. (after discarding the first 50ns of MD simulation) for Apo-Neo-2/15 (computational model) versus the r.m.s.d. for the holo-crystal structure of Neo-2/15 (in complex with the murine receptor). The conformations sampled by Neo-2/15 when in complex with the hIL-2RβƔc are more similar to the Apo-Neo-2/15 structure (computational model) than to the Neo-2/15 conformation observed in complex with the mIL-2RβƔc receptor. d) (top, middle-top and middle-bottom) analogous to “c)” but for MD simulations started from the computational model of Apo-Neo-2/15 in complex with the crystallographic structure of the mIL-2RβƔc. The model of Apo-Neo-2/15 was initially placed by simply aligning (TMalign) the ternary computational model of Neo-2/15 with hIL-2RβƔc (from “c)”) into the crystallographic structure of the mIL-2RβƔc (PDBid: 6GD5), avg r.m.s.d. to holo-Neo-2/15 (murine) = 1.43 Å. (bottom) shows a 2d-scatter plot (and the underlying density plot, where yellow, blue, green and purple colors represent decreasing densities) that compares the r.m.s.d. (after discarding the first 50ns of MD simulation) for Apo-Neo-2/15 (computational model) versus the r.m.s.d. for the holo-crystal structure of Neo-2/15 (in complex with the murine receptor). Different to what is observed in “c)”, the conformations sampled by Neo-2/15 when in complex with the mIL-2RβƔc are more similar to the Neo-2/15 conformation observed in the crystallographic structure of the ternary complex of Neo-2/15 with the mIL-2RβƔc receptor (see Figure 3). For clarity, all the r.m.s.d. plots were filtered (running average filter, 5-frames = 100 ps), and the dots in the 2d scatter plots were subsampled every 25-conformations (i.e. 500 ps), however the density plot corresponds to all the conformations analyzed (i.e. the last 40ns × 5 MD simulations were analyzed, and conformations were recorded each 20ps).
Figure E8.
Figure E8.. Overall sequence conservation in terms of binding for each of the 4-common helices combining the information from three different de novo designed IL-2 mimics.
The sequence logos (WebLogo) were generated using the combined data from in vitro binding experiments (against the heterodimeric mIL-2Rβγc, see Methods) from 3 independent SSM mutagenesis libraries for G2_neo2_40_1F_seq27, G2_neo2_40_1F_seq29 and G2_neo2_40_1F_seq36 (SI Figs. S8–10). All of these proteins are functional high-affinity mimetics of mice and human IL-2 (see SI Figures S6–11), some with different topologies than Neo-2/15, but all containing the four Helices H1, H3, H2’ and H4. The logos show the combined information for each helix independently. Below each logo, a line graph shows the probability score (higher is more conserved) for each amino acid in the Neo-2/15 sequence. A red line in these line graphs highlights positions where the Neo-2/15 amino acid has a probability score ≥ 30% (i.e. these amino acids contribute more significantly to receptor binding as they are generally more enriched in the binding populations of all of the tested mimics). The helix represented by EACH logo is shown to the left of each logo in terms of its topological position in Neo-2/15. The sequences of the Neo-2/15 helices and those of the corresponding helices (structurally aligned) for natural hIL-2 (interleukin-2) and hIL-15 (interleukin-15) are shown below the graphs, demonstrating the unique character of Neo-2/15’s helices and binding interfaces.
Figure 1.
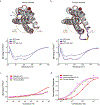
Figure 1.. Computational design of de novo cytokine mimics.
a) Structure of hIL-2 (cartoon representation) in complex with the hIL-2RαβƔc (surface representation) (PDB ID: 2B5I), b) The designed mimics have four helices; three (blue, yellow and red) mimic IL-2 interactions with hIL-2RβƔc, while the fourth (green) holds the first three in place. Top-first generation: each of the core elements of IL-2 (helices H1-H4) were independently idealized using fragment-assembly from a clustered ideal 4 residue fragment database; bottom-second generation: the core elements were built using parametric equations that recapitulate the shape of each disembodied helix, allowing changes in the length of each helix by +/− 8 a.a. ; c) Pairs of helices were reconnected using ideal loop fragments, representative examples are shown with the newly built elements connecting each pair of helices in magenta; d) Combination of helix hairpins in (c) to generate fully connected protein backbones; e) Rosetta flexible backbone sequence design. f) Binding and activity of selected designs (solid symbols), the green arrow originates at the parent of Neo2–15. (see Table E1).
Figure 2.
Figure 2.. Characterization of Neo-2/15.
a) Receptor subunit binding assessed by SPR: Neoleukin-2–15 (red) does not bind IL-2Rα (top row), but binds more tightly than IL-2 (light blue) and Super-2 (dark blue) to IL-2β (second row) and IL-2βƔc (bottom row) (Kd values in extended table E1; experiments performed 3 times with similar results); b) Neoleukin-2/15 stimulates STAT5 phosphorylation more potently than IL-2 in cells expressing IL2Rbg but not IL2Ra (CD25-) in both (in vitro) human NK, (n=3; experiments performed 3 times with similar results) and murine CD4+ T cells (n=4; data is from a pool of 3 independent experiments). c) Top: Neo-2/15 can be incubated for 2 hours at 80°C without loss of binding against hIL-2RβƔc, whereas hIL-2 and Super-2 quickly lose activity (immobilized hIL-2RƔc with in-solution hIL-2Rβ at 500 nM; experiment performed once); Bottom: Following incubation at 95°C for 1 hour, Neo-2/15 still drives cell survival effectively (with ~70% luminescence remaining at 10 ng/ml relative to cells treated with non-heat incubated Neo 2/15), whereas mIL2 and Super-2 are inactivated (n=3; experiment performed 3 times with similar results). In all plots, the whiskers represent ∓1-standard deviation and are centered in the mean.
Figure 3.
Figure 3.. Structure of Neo-2/15 and its ternary complex with mIL-2RβƔc.
a) Top: structural alignment of Neo-2/15 chain A (orange) with the design model (grey, r.m.s.d 1.11 Å for 100 Cα atoms); Bottom: detail of interface helices H1, H3 and H4 (numbered according to hIL-2, Fig. 1). The interface side chains are shown in sticks ; b) crystal structure of the ternary complex of Neo-2/15 (red) with mIL-2Rβ (wheat) and γc (pink), aligned to the design model against hIL-2Rβγc (grey, r.m.s.d 1.27 Å for the 93 modeled Cα atoms of Neo-2/15 in the ternary complex); c) structural alignment of monomeric Neo-2/15 (chain A, orange) with Neo-2/15 in the ternary complex (red, r.m.s.d 1.71 Å for the 93 modeled Cα atoms in the ternary complex), highlighting an ~4.0 Å shift of helix H4 in the ternary-complex structure compared to the monomeric crystal structure (green double-headed arrow); d) comparison of the crystallographic structures of left: hIL-2 (cartoon representation in blue) and right: Neo-2/15 from the ternary complex in “b)” (cartoon representation in red). The regions that interact with the IL-2Rβ and γc are indicated. Topology diagrams are at the bottom. The loop-rich region from hIL-2 that interacts with hIL-2Rα does not exist in the de novo mimic Neo-2/15. ; e-f) comparison of the binding interfaces of Neo-2/15 and hIL-2 with mIL-2Rβ and mIL-2Rγc, respectively. Interfacial amino acids are shown as sticks, and those that differ between hIL-2 and Neo-2/15 are denoted with labels.
Figure 4.
Figure 4.. In vivo characterization of Neo-2/15.
a) mIL-2 but not Neo-2/15 enhances CD4+ Treg expansion in naive mice T cells; b) In a mice airway inflammation model (20 μg/day/mouse, 7 days), Neo-2/15 does not increase the frequency of antigen-specific CD4+ Foxp3+ Tregs in the lymphoid organs (SLO). c) Neo-2/15 does not have detectable immunogenicity. Mice were immunized with Neo-2/15 (red) or mIL-2 (grey) (14 days of daily i.p. injection, 10 μg/day), IgG was detected by ELISA. Anti-Neo-2/15 pAb was used as a positive control and did not cross-react with mIL-2 or hIL2; d) Neo-2/15 is more effective than mIL-2 in a colorectal cancer model (CT26). Starting on day 6, mice were i.p. treated daily with mIL-2 or Neo-2/15 (10 μg), or were left untreated. Tumor growth curves (top) show only surviving mice and stop if a group fell below 50% of the initial n. Survival curves (bottom). Mice were euthanized if weight loss exceeded 10%, or tumor size reached 1000 mm3; e) In a melanoma model (B16F10), combination of mAb TA99 with Neo-2/15 is more effective than with mIL-2. Starting on day 1, mice were i.p. treated daily with Neo-2/15 (10 μg) or equimolar mIL-2. Twice-weekly treatment with TA99 added on day 3. Tumor growth curves (left). Survival curve (top right), inset shows average weight change. Quantification of the cause of death (bottom right). f) Neo2/15 elicits a higher CD8+ : Treg ratio than mIL-2. Whiskers are ∓1-standard deviation centered on the mean, except in growth curves they are ∓1-standard error of the mean. Results analyzed by one-way ANOVA (95% confidence interval), except survival curves were assessed using the Mantel-cox test (95% confidence interval). All experiments were performed twice with similar results, except b) shows data pooled from 3 independent experiments.

Comment in

References

    1. Akdis M et al. Interleukins, from 1 to 37, and interferon-γ: receptors, functions, and roles in diseases. J. Allergy Clin. Immunol 127, 701–21.e1– 70 (2011). - PubMed
    1. Smyth MJ, Cretney E, Kershaw MH & Hayakawa Y Cytokines in cancer immunity and immunotherapy. Immunol. Rev 202, 275–293 (2004). - PubMed
    1. Lotze MT et al. In vivo administration of purified human interleukin 2. II. Half life, immunologic effects, and expansion of peripheral lymphoid cells in vivo with recombinant IL 2. J. Immunol 135, 2865–2875 (1985). - PubMed
    1. Moraga I et al. Synthekines are surrogate cytokine and growth factor agonists that compel signaling through non-natural receptor dimers. Elife 6, (2017). - PMC - PubMed
    1. Vazquez-Lombardi R et al. Potent antitumour activity of interleukin-2-Fc fusion proteins requires Fc-mediated depletion of regulatory T-cells. Nat. Commun 8, 15373 (2017). - PMC - PubMed

Methods References

    1. Fleishman SJ et al. Computational design of proteins targeting the conserved stem region of influenza hemagglutinin. Science 332, 816–821 (2011). - PMC - PubMed
    1. Chang HC et al. A general method for facilitating heterodimeric pairing between two proteins: application to expression of alpha and beta T-cell receptor extracellular segments. Proc. Natl. Acad. Sci. U. S. A 91, 11408–11412 (1994). - PMC - PubMed
    1. Yodoi J et al. TCGF (IL 2)-receptor inducing factor(s). I. Regulation of IL 2 receptor on a natural killer-like cell line (YT cells). J. Immunol 134, 1623–1630 (1985). - PubMed
    1. Kuziel WA, Ju G, Grdina TA & Greene WC Unexpected effects of the IL-2 receptor alpha subunit on high affinity IL-2 receptor assembly and function detected with a mutant IL-2 analog. J. Immunol 150, 3357–3365 (1993). - PubMed
    1. Silva D-A, Stewart L, Lam K-H, Jin R & Baker D Structures and disulfide cross-linking of de novo designed therapeutic mini-proteins. FEBS J (2018). doi:10.1111/febs.14394 - DOI - PMC - PubMed

Publication types

MeSH terms