. 2019 Jan;565(7740):495-499.
doi: 10.1038/s41586-018-0846-z. Epub 2019 Jan 9.

Mitochondrial complex III is essential for suppressive function of regulatory T cells

Affiliations

Mitochondrial complex III is essential for suppressive function of regulatory T cells

Samuel E Weinberg et al. Nature. 2019 Jan.

Abstract

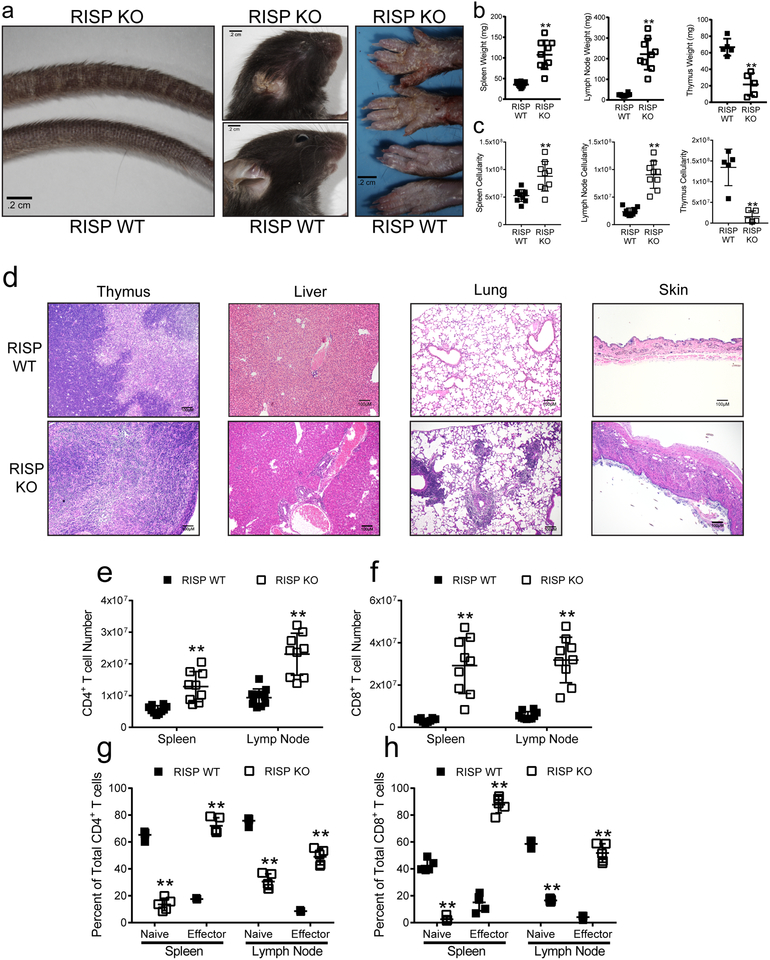
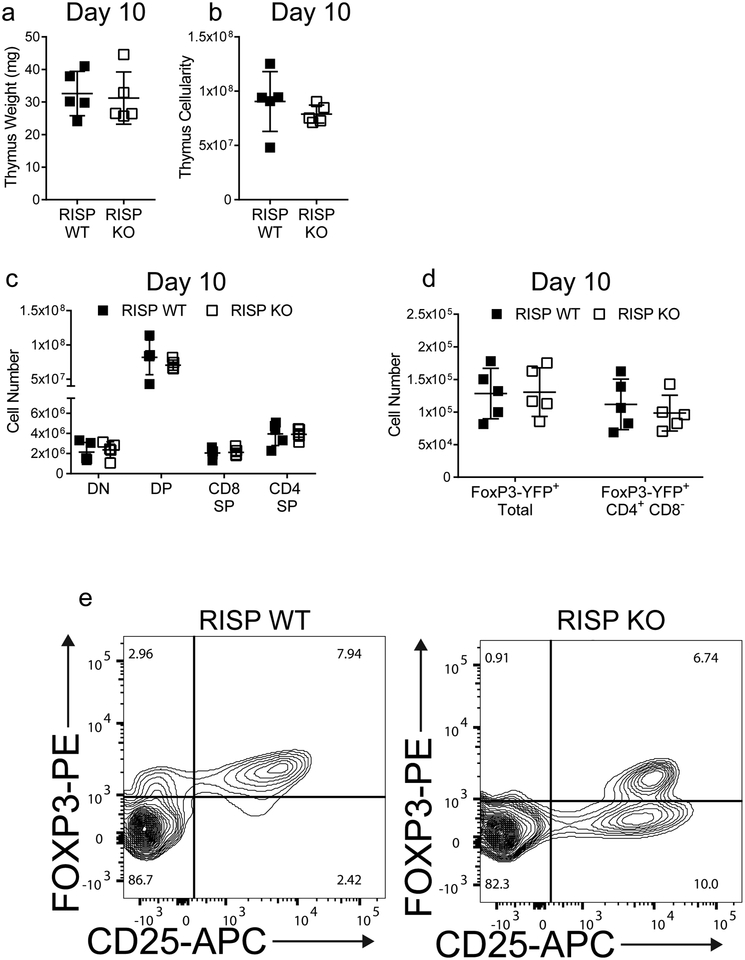
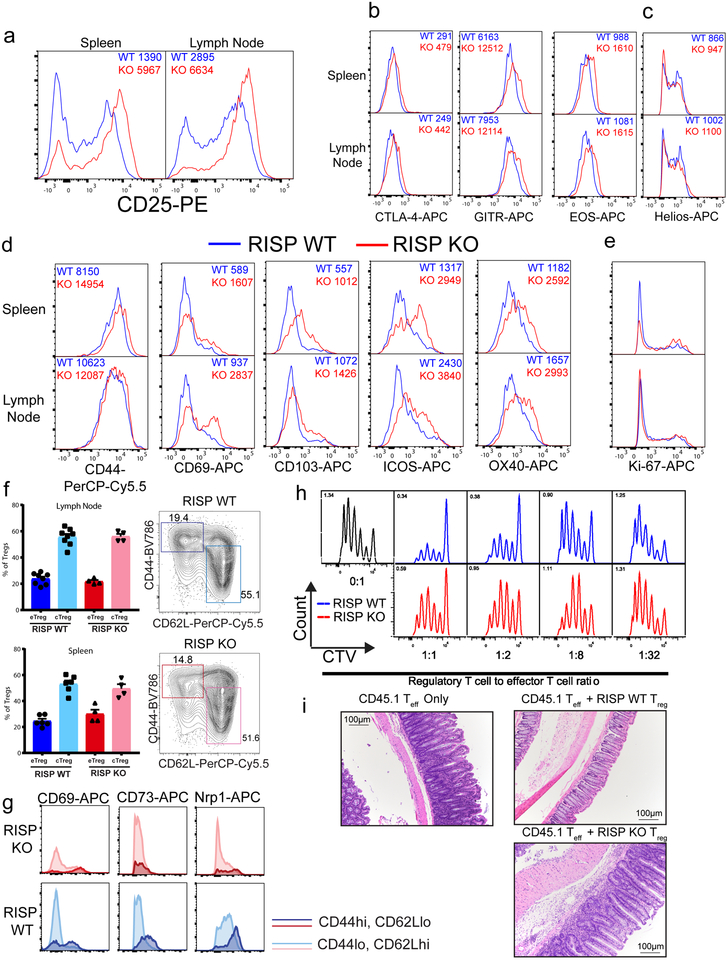
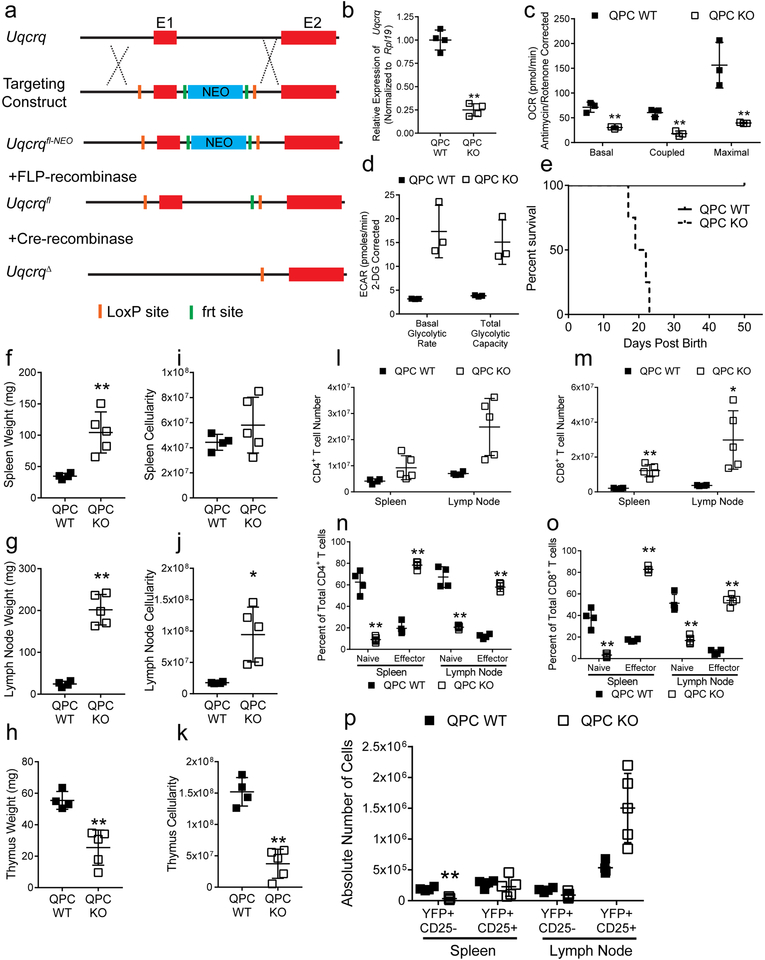
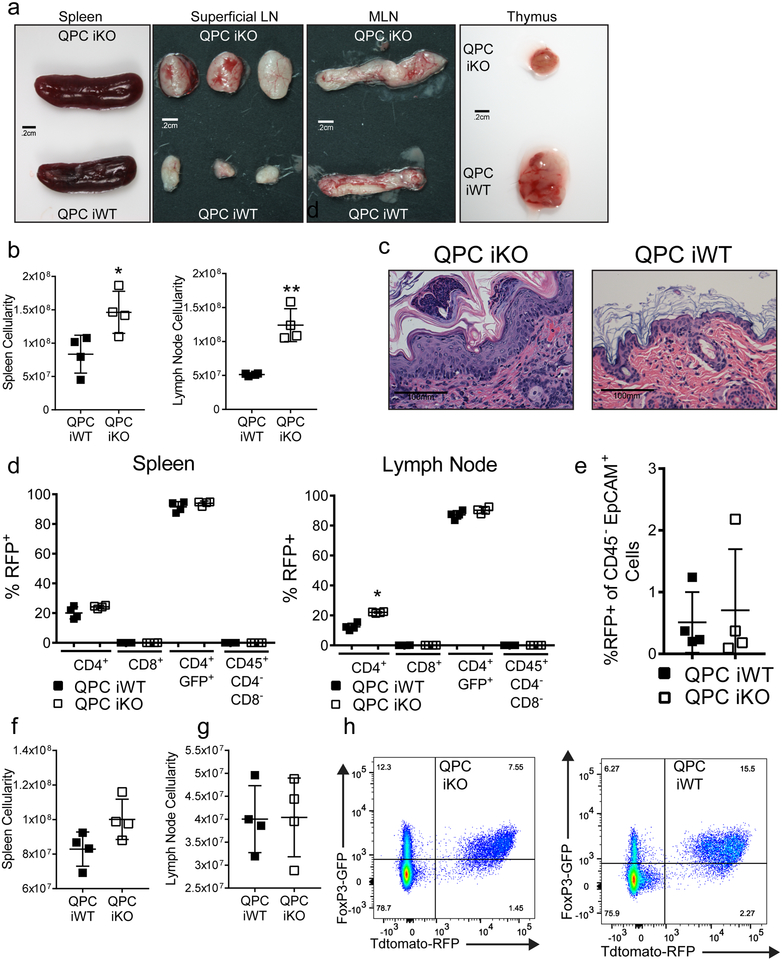
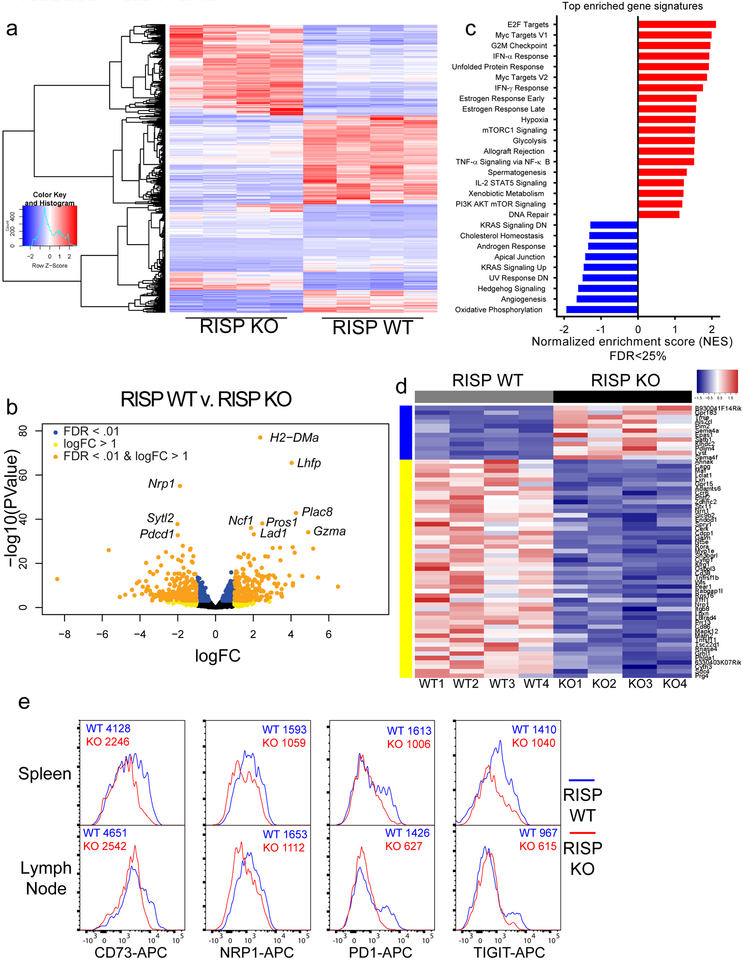
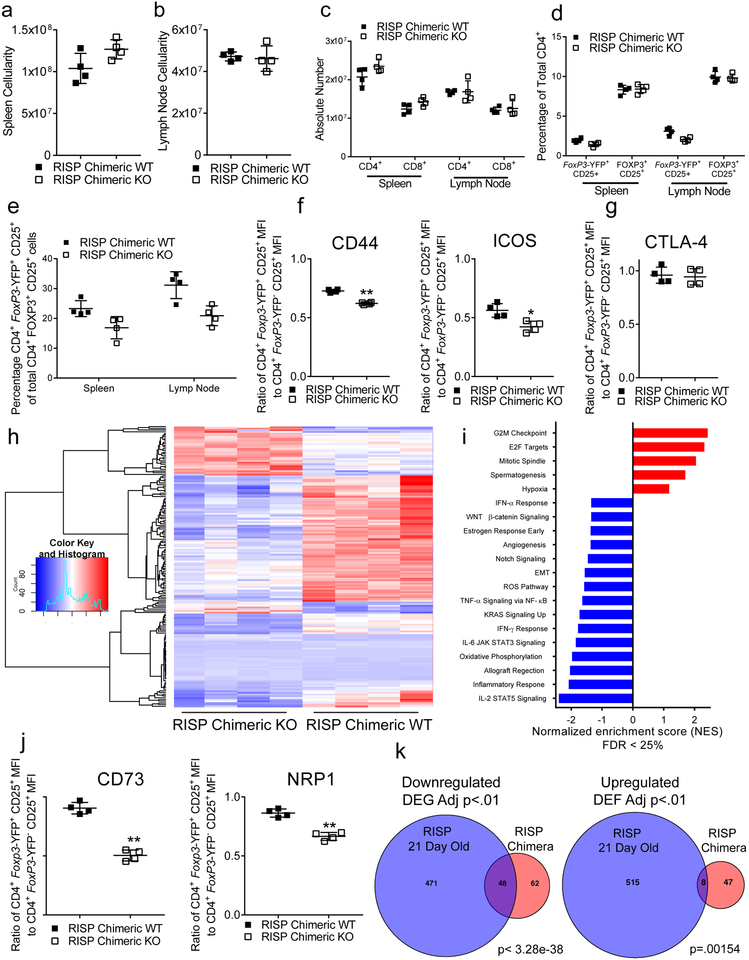
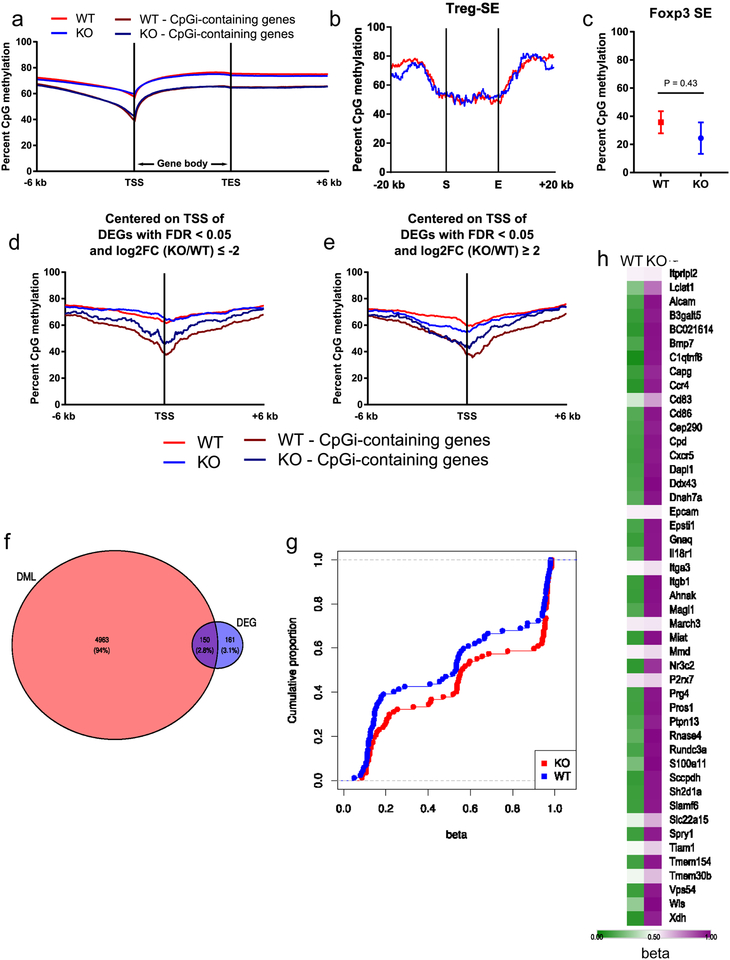
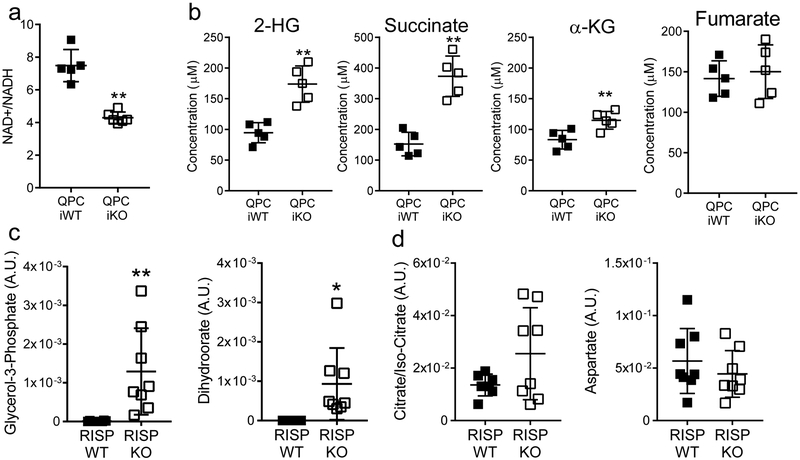
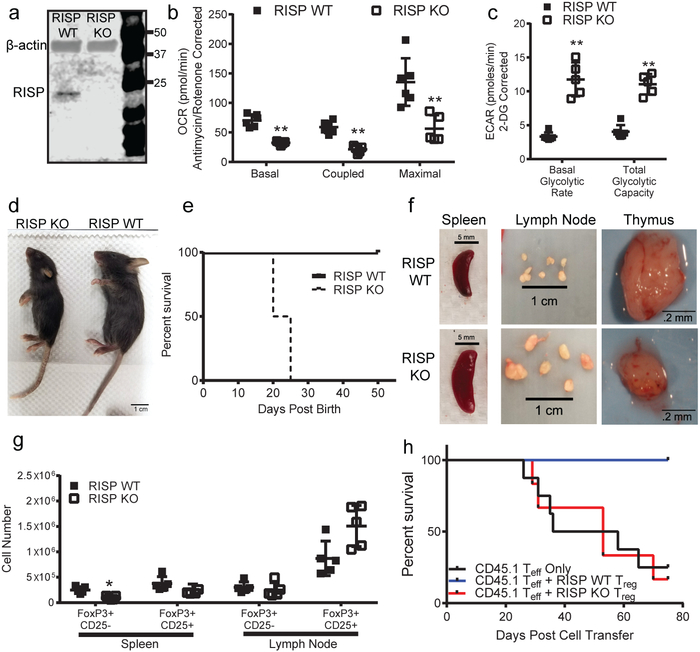
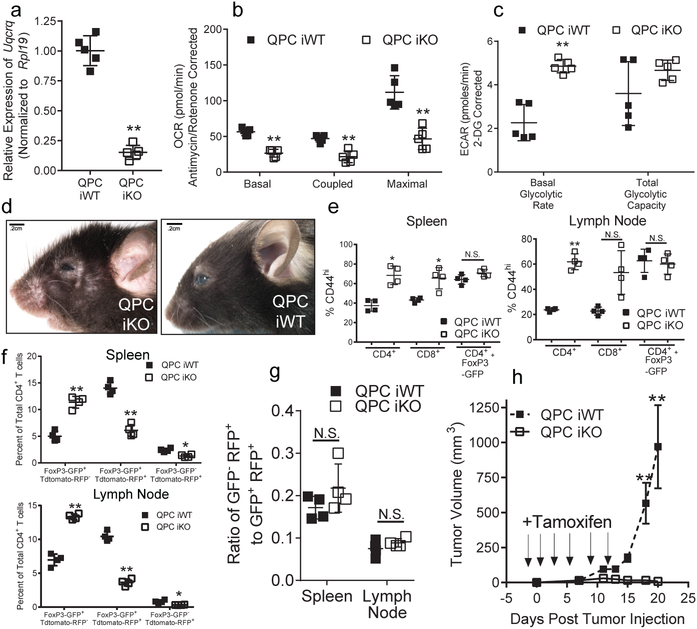
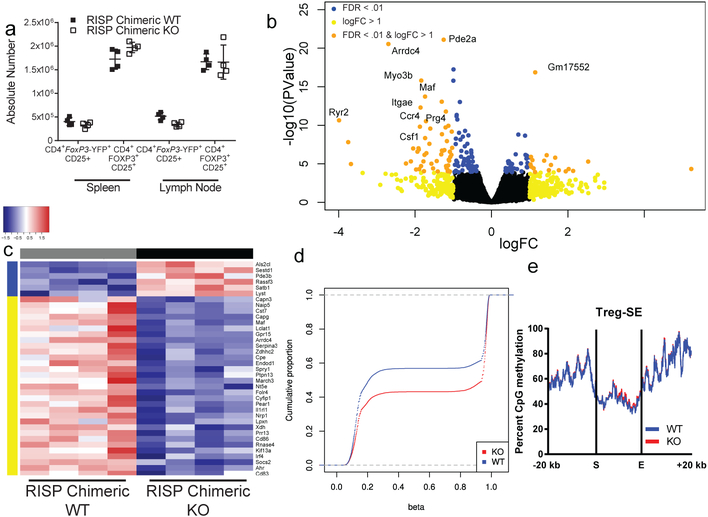
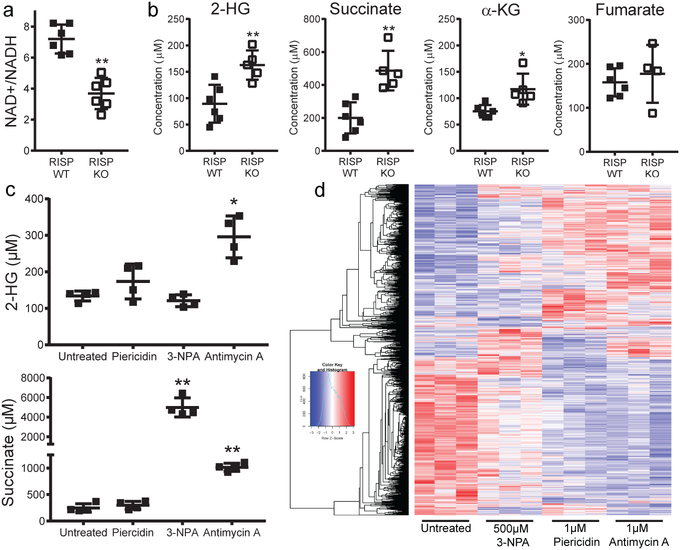
Regulatory T cells (Treg cells), a distinct subset of CD4+ T cells, are necessary for the maintenance of immune self-tolerance and homeostasis1,2. Recent studies have demonstrated that Treg cells exhibit a unique metabolic profile, characterized by an increase in mitochondrial metabolism relative to other CD4+ effector subsets3,4. Furthermore, the Treg cell lineage-defining transcription factor, Foxp3, has been shown to promote respiration5,6; however, it remains unknown whether the mitochondrial respiratory chain is required for the T cell-suppression capacity, stability and survival of Treg cells. Here we report that Treg cell-specific ablation of mitochondrial respiratory chain complex III in mice results in the development of fatal inflammatory disease early in life, without affecting Treg cell number. Mice that lack mitochondrial complex III specifically in Treg cells displayed a loss of T cell-suppression capacity without altering Treg cell proliferation and survival. Treg cells deficient in complex III showed decreased expression of genes associated with Treg function, whereas Foxp3 expression remained stable. Loss of complex III in Treg cells increased DNA methylation as well as the metabolites 2-hydroxyglutarate (2-HG) and succinate that inhibit the ten-eleven translocation (TET) family of DNA demethylases7. Thus, Treg cells require mitochondrial complex III to maintain immune regulatory gene expression and suppressive function.


Figures

Extended Data Figure 1:
Extended Data Figure 1:. Loss of RISP in Treg cells results in T cell proliferation, activation and immune infiltration into multiple organs.
a, Representative images of skin changes observed in RISP KO (top) animals compared to RISP WT. b,c, Weight (b) and total cellularity (c) of the spleen (RISP WT n=10, RISP KO n=9), lymph nodes (RISP WT n=10, RISP KO n=9), and thymus (RISP WT n=5, RISP KO n=5) in RISP WT and KO mice at 3 weeks of age. d, Representative 10X-images from 3-week-old RISP WT and KO animals. The RISP KO thymuses show thinning of the thymic cortex secondary to lymphoid depletion. Significant perivascular inflammation can be observed in the lung and liver, while dermal thickening and profound inflammation was seen in the skin. e, f, CD4+ (e, RISP WT n=10, RISP KO n=9) and CD8+ (f, RISP WT n=10, RISP KO n=9) T cell numbers in the spleen and lymph nodes in 3-week-old mice. g, h, Percentage of naïve (CD62L+ CD44) and effector (CD62L CD44+) cells of the total CD4+ (g, RISP WT n=5, RISP KO n=5) and CD8+ (h, RISP WT n=5, RISP KO n=5) T cells. Images are representative of at least three mice harvested on independent days. Data represent mean ± SD and were analyzed with (b, c) two-tailed t-test (**p<.001, specific p-values displayed in supplemental source data) or with (e-h) multiple two-tailed t-tests using a two-stage linear step-up procedure of Benjamini, Krieger and Yekutieli, with Q = 1%. Each cell type was analyzed individually, without assuming a consistent SD (**q<.001, specific q-values displayed in supplemental source data). All data points on graphs represent individual animals isolated and analyzed on at least 2 separate days.
Extended Data Figure 2:
Extended Data Figure 2:. Mice with regulatory T cells deficient in RISP do not display thymic dysfunction early in life.
a, b, Thymic weight (a) and total thymocyte number (b) observed from 10-day-old RISP KO (n=5) and WT (n=5) mice. c, Absolute cell numbers of double-negative (CD4 CD8, DN), double-positive (CD4+ CD8+, DP), CD8 single-positive (CD4 CD8+, CD8 SP), and CD4 single-positive (CD4+ CD8, CD4 SP) populations from the thymuses of 10-day old RISP KO (n=5) and WT (n=5) mice. d, Foxp3-YFP+ and Foxp3-YFP+ CD4 SP absolute cell numbers in the thymuses of 10-day old RISP KO (n=5) and WT (n=5) animals..e, Representative contour plot of the Treg cell compartment in the superficial lymph nodes at 3 weeks of age. Contour plots are representative of at least three independent experiments totaling at least 5 mice. Numbers in dot plot quadrants indicate percentage of cells. Images are representative of at least three mice harvested on independent days. Data represent mean ± SD and were analyzed with (a, b) two-tailed t-test (specific p-values displayed in supplemental source data) or with (c, d) multiple two-tailed t-tests using a two-stage linear step-up procedure of Benjamini, Krieger and Yekutieli, with Q = 1%. Each cell type was analyzed individually, without assuming a consistent SD (specific q-values displayed in supplemental source data). All data points on graphs represent individual animals isolated and analyzed on at least 2 separate days.
Extended Data Figure 3:
Extended Data Figure 3:. Loss of RISP does not significantly impair expression of classic Treg cell markers, activation markers and proliferation, but impairs Treg suppressive function.
a, Expression of CD25 on CD4+ Foxp3-YFP+ cells isolated from the spleen and lymph nodes of 21-day-old RISP KO and RISP WT animals. b, Surface expression of CTLA-4 and GITR on CD4+ Foxp3-YFP+ CD25+ cells from 3-week-old RISP KO and WT mice. c, Cellular expression of EOS and Helios from CD4+ Foxp3+ CD25+ cells isolated from the spleen and lymph nodes. d, Surface expression of activation makers CD44, CD69, CD103, ICOS, and OX40 on CD4+ Foxp3-YFP+ CD25+ cells isolated from the spleen and lymph nodes. e, Ki-67 expression in CD4+ Foxp3+ CD25+ from the spleen and lymph nodes. f, Percentage of central (cTreg) verses effector Treg (eTreg) cells in the spleen and lymph nodes of 3-week-old RISP KO (n=4 for both tissues) and RISP WT (spleen n=6, LN n=8) mice with representative contour plot. g, Representative histograms of CD69, CD73, and Nrp1 expression on cTreg and eTreg cells isolated from lymph nodes of 3-week-old RISP KO and RISP WT mice. h, Cell trace violet (CTV) dilution in CD8+ effector T cells stimulated to proliferate with varying ratios of RISP WT and RISP KO CD4+ Foxp3-YFP+ CD25+ cells isolated from the lymph nodes of 3-week old mice. i, Representative images of the colons from Rag1-null mice 1 month following adoptive transfer. Images are representative of at least three mice harvested on independent days. Contour plots are representative at least three independent experiments totaling at least 4 mice. Numbers in dot plot quadrants indicate percentage of cells. Histograms are representative of at least three independent experiments totaling at least five mice (WT=Blue, KO=Red). Numbers on histograms represent mean fluorescence intensity (MFI) of depicted samples. Y-axis of all histograms represents % of max. Data in panel (f) analyzed with multiple two-tailed t-tests using a two-stage linear step-up procedure of Benjamini, Krieger and Yekutieli, with Q = 1%. Each cell type was analyzed individually, without assuming a consistent SD (specific q-values displayed in supplemental source data). All data points on graphs represent individual animals isolated and analyzed on at least 2 separate days.
Extended Data Figure 4:
Extended Data Figure 4:. Loss of complex III subunit QPC in Treg cells gives rise to a lethal inflammatory disorder.
a, Scheme illustrating the strategy utilized to generate Uqcrq floxed and excised alleles. b, Expression of Uqcrq mRNA in CD4+ Foxp3-YFP+ CD25+ cells from 21-day-old QPC KO (n=4) relative to QPC WT (n=4) mice. Uqcrq expression was normalized to expression of Rpl19. c,d, Oxygen consumption rate (OCR) (c) and extracellular acidification rate (ECAR) (d) of CD4+ Foxp3-YFP+ CD25+ cells isolated from 3-week-old QPC WT (n=3) and QPC KO (n=3) mice e, Survival of QPC WT (n=8) and QPC KO (n=9) animals (p=.0002 using one-sided log-rank test). f-h, Weights of spleens (f), lymph nodes (g), and thymuses (g) from 3-week-old QPC WT (n=4) and KO (n=5) mice. i-j, Total cellularity of the spleen (i), lymph nodes (j), and thymuses (k) from 3-week-old QPC WT (n=4) and KO (n=5) mice. l,m, CD4+ (l) and CD8+ (m) T cell numbers in the spleen and lymph nodes in 3-week-old QPC WT (n=4) and QPC KO (n=5) animals. n,o, Percentage of naïve (CD62L+ CD44) and effector (CD62L CD44+) cells of the total CD4+ (n) and CD8+ (o) T cells in 3-week-old QPC WT (n=4) and QPC KO (n=5) animals. p, Absolute number of Treg cells in the spleen and lymph nodes from 3-week-old QPC WT (n=4) and KO (n=5) animals. Data represent mean ± SD and were analyzed with (b, f-k) two-tailed t-test (*p<.01, **p<.001, specific p-values displayed in supplemental source data) or with (c,d, l-p) multiple two-tailed t-tests using a two-stage linear step-up procedure of Benjamini, Krieger and Yekutieli, with Q = 1%. Each cell type was analyzed individually, without assuming a consistent SD (*q<.01, **q<.001, specific q-values displayed in supplemental source data). All data points on graphs represent individual animals isolated and analyzed on at least 2 separate days.
Extended Data Figure 5:
Extended Data Figure 5:. Loss of QPC in Treg cells impairs suppressive function without altering Foxp3 expression.
a, Representative images of the spleen, superficial lymph nodes, mesenteric lymph nodes, and thymuses from QPC iKO animals compared to QPC iWT treated with tamoxifen for 28 days. b, c, Cellularity of the spleen (b) and lymph nodes (c) from QPC iWT (n=4) and QPC iKO (n=4) mice treated with tamoxifen for 28 days. d, 40X histological images of the skin from QPC iKO and QPC iWT animals. e, Percentage of CD4+ T cells (CD45+ CD4+), CD8+ T cells (CD45+ CD8+), Treg cells (CD45+ CD4+ Foxp3-GFP+) and non-T leukocytes (CD45+ CD4 CD8) from the spleen and lymph nodes of QPC iWT (n=4) and QPC iKO (n=4) expressing tdTomato-RFP after 2 weeks of tamoxifen treatment every third day. f, Percentage of thymic epithelial cells (CD45 EpCAM+) expressing tdTomato-RFP after 2 weeks of tamoxifen treatment every third day from QPC iWT (n=4) and QPC iKO (n=4). g, h, Total cellularity of the spleen (g) and lymph nodes (h) 3 months after 3 doses of tamoxifen from QPC iWT (n=4) and QPC iKO (n=4) animals. i, Representative dot plots of the splenic Treg cell compartment in QPC iKO and QPC iWT at 3 months after tamoxifen treatment. Images are representative of at least three mice collected on 3 different days. (f) Numbers in quadrants indicate percentage of cells. (b,c,e-h) Data represent mean ± SD and were analyzed with (b,c,f-h) two-tailed t-test (*P˂.05, **P˂.01, specific p-values displayed in supplemental source data) or (e) multiple two-tailed t-tests using a two-stage linear step-up procedure of Benjamini, Krieger and Yekutieli, with Q = 1%. Each cell type was analyzed individually, without assuming a consistent SD (**q<.001, specific q-values displayed in supplemental source data). All data points on graphs represent individual animals isolated and analyzed on at least 2 separate days.
Extended Data Figure 6:
Extended Data Figure 6:. Loss of RISP in Treg cells results in major alterations in gene expression including downregulation of known Treg cell suppressive genes in 21-day-old mice.
a, Hierarchical clustering showing changes in gene expression in CD4+ Foxp3-YFP+ CD25+ cells isolated from 3-week-old RISP KO (n=4) and RISP WT (n=4) mice. b, Volcano plot showing differential gene expression in CD4+ Foxp3-YFP+ CD25+ cells isolated from 3-week-old RISP KO (n=4) and RISP WT (n=4) mice. Uqcrsf1 (gene encoding for RISP) not shown on plot (logFC=−4.83, −log10(p-value)=203). c, Normalized enrichment scores from gene set enrichment analysis from the hallmark gene set in the molecular signatures database v6.0 comparing gene-set generated from panel a. d, Heat map of Treg cell signatures genes that are differentially expressed (adj. P<.01) in RISP KO (n=4) versus RISP WT (n=4) animals. e, Surface expression of CD73, Nrp1, PD1, and Tigit on CD4+ Foxp3-YFP+ CD25+ cells isolated from the spleen and lymph nodes of 3-week-old RISP KO and RISP WT animals. Histograms are representative at least two independent experiments totaling at least 4 mice. Numbers above histograms represent mean fluorescence intensity (MFI) of depicted samples. Data in panels a-d, are from one RNA sequencing experiment. CD4+ Foxp3-YFP+ CD25+ cells from RISP WT (n=4) and RISP KO (n=4) animals were isolated on different days. cDNA library production and sequencing was performed only one time and all 8 RNA samples were prepared together.
Extended Data Figure 7:
Extended Data Figure 7:. Mice that contain a Treg cell compartment with chimeric RISP-loss do not develop an inflammatory disease but do display a cell autonomous impairment in expression of a Treg-specific transcription profile.
a,b, Total number of cells in the spleen (a) and lymph nodes (b) of adult (8–12 weeks) RISP chimeric KO (n=4) and chimeric WT (n=4) mice. c, CD4+ and CD8+ T cell numbers in the spleen and lymph nodes of adult RISP chimeric KO (n=4) and chimeric WT (n=4) mice. d, Percentage of total CD4+ cells that are either CD4+ Foxp3-YFP+ CD25+ (chimeric Treg cells) and CD4+ Foxp3+ CD25+ (total Treg cells) from adult RISP chimeric KO (n=4) and RISP chimeric WT (n=4) mice. e, Percentage of chimeric Treg cells of all Treg cells present in adult RISP chimeric KO (n=4) and chimeric WT (n=4) animals. f,g, Ratio of surface expression of CD44, ICOS (d) and CTLA-4 (e) on chimeric Treg cells (CD4+ Foxp3-YFP+ CD25+) relative to CD4+ Foxp3-YFP CD25+ (wild-type Treg cells) cells from pooled samples of the spleen and lymph node in adult RISP chimeric KO (n=4) and RISP chimeric WT mice (n=4). h, Hierarchical clustering showing changes in gene expression in CD4+ Foxp3-YFP+ CD25+ cells isolated from adult RISP chimeric KO (n=4) and chimeric WT mice (n=4). i, Normalized enrichment scores from gene set enrichment analysis from the hallmark gene set in the molecular signatures database v6.0 on data set shown in panel h. j, Ratio of surface expression of CD73 and Nrp1, on chimeric Treg cells relative wild-type Treg cells from pooled samples of the spleen and lymph node in adult RISP chimeric KO (n=4) and RISP chimeric WT (n=4) mice. k, Venn-diagram displaying overlap of differential expressed genes (adj. p<.01) from Treg cells (CD4+ Foxp3-YFP+ CD25+) isolated from 21-day-old RISP KO (n=4) and RISP WT (n=4) animals (RISP 21-day-old) versus chimeric Treg cells (CD4+ Foxp3-YFP+ CD25+) isolated from adult RISP chimeric KO (n=4) and RISP chimeric WT (n=4) mice. P values were calculated using hypergeometric similarity measure. (a-f,g,j) Data represent mean ± SD and were analyzed with (a,b,f,g,j) two-tailed t-test (*P˂.05, ** P˂.01, specific p-values displayed in supplemental source data) or (c,d,e) multiple two-tailed t-tests using a two-stage linear step-up procedure of Benjamini, Krieger and Yekutieli, with Q = 1%. Each cell type was analyzed individually, without assuming a consistent SD (**q<.001, specific q-values displayed in supplemental source data). All data points on graphs represent individual animals isolated and analyzed on at least 2 separate days. Data in panels h,i are from one RNA sequencing experiment. CD4+ Foxp3-YFP+ CD25+ cells from RISP chimeric WT (n=4) and RISP chimeric KO (n=4) animals were isolated on different days. cDNA library production and sequencing was performed only one time and all 8 RNA samples were prepared together.
Extended Data Figure 8:
Extended Data Figure 8:. Loss of RISP in Treg cells alters DNA methylation without affecting the Foxp3 locus in 3-week-old mice.
a, b, CpG methylation around the transcriptional start site (TSS) and transcriptional end site (TES) (a) and the start (S) and end (E) of Treg cell-specific super-enhancer elements with 20 kb of flanking sequence (b) in CD4+ Foxp3-YFP+ CD25+ cells from 3-week-old RISP KO (n=4) and RISP WT (n=4) animals. c, DNA methylation status of the super-enhancer associated with the Foxp3 locus in RISP KO and RISP WT Treg cells. d,e, Percentage of methylated CpGs around the TSS of differentially downregulated (d) and upregulated (e) genes (log2FC≥2, FDR q-value<.05) from Extended Data Figure 6. (a,d,e) mRRBS data were smoothed with sliding window size of 20 CpGs and a step of 10 CpGs for sites with >5X coverage. (b) Treg cell-specific super-enhancer data were normalized over 1-kb windows. Average CpG methylation of n=3 biological replicates per group is shown. f, Venn diagram analysis partitioning differentially methylated loci (DML) and differentially expressed genes (DEG). g, Cumulative distribution function of differentially methylated CpGs within 100 kilobases of 87 DEG that were down-regulated (log2 fold-change≤0) in chimeric KO Treg cells. Data points represent average methylation at each gene locus. h, Heatmap displaying the methylation state (beta) of differentially methylated CpGs at gene loci that were both hypermethylated and differentially down-regulated (adj-p<.01) in the chimeric KO Treg cells. (c) Data represent mean ± SEM and were analyzed with two-tailed t-test. (a-e) CD4+ Foxp3-YFP+ CD25+ cells from RISP WT (n=3) and RISP KO (n=3) animals were isolated on different days. Further processing and sequencing was performed with all 6 samples together. (f-h) CD4+ Foxp3-YFP+ CD25+ cells from RISP chimeric WT (n=4) and RISP chimeric KO (n=4) animals were isolated on different days. Further processing and sequencing was performed with all 8 samples together.
Extended Data Figure 9:
Extended Data Figure 9:. Metabolite alterations in complex III-deficient Treg cells.
a, The ratio of NAD+/NADH in Treg (CD4+ Foxp3-GFP+ tdTomato-RFP+) cells isolated from QPC iWT (n=5) or QPC iKO (n=6) 6 weeks after receiving 3 doses of tamoxifen. b, Calculated intracellular concentration of 2-HG, succinate, α-KG, and fumarate in Treg (CD4+ Foxp3-GFP+ tdTomato-RFP+) cells isolated from QPC iWT (5) or QPC iKO (5) 6 weeks after receiving 3 doses of tamoxifen. c,d, LC-MS quantified levels of specific complex III dependent (c), and TCA cycle (d) metabolites in CD4+ Foxp3-YFP+ CD25+ cells isolated from 3-week-old RISP KO and WT mice. Data represent mean ± SD and were analyzed by (a,b) two-tailed t-test (**p˂.01, respectively; specific p-values displayed in supplemental source data) or (c,d) multiple two-tailed t-tests using a two-stage linear step-up procedure of Benjamini, Krieger and Yekutieli, with Q = 1%. Each metabolite was analyzed individually, without assuming a consistent SD (*Q<.01, **Q<.001; specific q-values displayed in supplemental source data). All data points on graphs represent individual animals isolated and analyzed on at least 2 separate days.
Extended Data Figure 10:
Extended Data Figure 10:. Elevated glycolytic flux does not phenocopy complex III inhibition in regulatory T cells.
a, Venn diagram displaying overlap of differentially expressed genes (adj. p<.01) from Treg cells (CD4+ Foxp3-YFP+ CD25+) isolated from 8-to-12-week-old RISP chimeric KO and RISP chimeric WT mice Treg cells (CD4+ Foxp3-YFP+ CD25+) verses Treg cells overexpressing GLUT1 isolated from adult animals. P values were calculated using hypergeometric similarity measure. b, Oxygen consumption rate (OCR) of Treg (CD4+ Foxp3-YFP+ CD25+) cells treated with 1μM Piericidin, 500μM 3-NPA, or 1μM antimycin A for 4 hours. Data represent mean ± SD and were analyzed 1-way ANOVA with Dunnett’s test for multiple comparisons (*adj-p<.05 **adj-p˂.01, respectively; specific p-values displayed in supplemental source data). All data points on graphs represent individual animals isolated and analyzed on at least 2 separate days.
Figure 1:
Figure 1:. Loss of complex III in Treg cells results in a lethal inflammatory disorder and loss of Treg cell suppressive function.
a, RISP and β-actin protein expression in CD4+ Foxp3-YFP+ CD25+ cells isolated from 3-week-old RISP WT and RISP KO mice. b,c, (b) Oxygen consumption rate (OCR) and (c) extracellular acidification rate (ECAR) of CD4+ Foxp3-YFP+ CD25+ cells isolated from 3-week old RISP WT (n=6) and RISP KO mice (n=5). d, Representative image of 3-week-old RISP WT and RISP KO mice. e, Survival of RISP WT (n=8) and RISP KO (n=11) animals (p=.0009 using one-sided log-rank test). f, Representative images of spleens, lymph nodes, and thymuses from 3-week-old animals. g, Number of Treg cells in the spleen and lymph nodes in 3-week-old RISP KO (n=5) and RISP WT (n=5) mice. h, Survival of Rag1-deficient mice following adoptive transfer of CD4+ CD45rbhi CD25 cells (Teff) alone (n=8) or with CD4+ Foxp3-YFP+ CD25+ cells isolated from 3-week-old RISP WT (n=6) and RISP KO mice (n=6). Animals were removed from the experiment after losing 20% of their pre-transfer body weights (p=.0156 using one-sided log-rank test). Images are representative of at least three mice harvested on independent days. Data (b,c,g) represent mean ± SD and were analyzed with multiple two-tailed t-tests using a two-stage linear step-up procedure of Benjamini, Krieger and Yekutieli, with Q = 1% unless otherwise stated. Each cell type was analyzed individually, without assuming a consistent SD (*Q<.01, **Q<.001, specific q-values displayed in supplemental source data). All data points on graphs represent individual animals isolated and analyzed on at least 2 separate days.
Figure 2:
Figure 2:. Loss of complex III in Treg cells impairs suppressive function without altering Foxp3 expression.
a-c, Uqcrq mRNA expression (a), OCR (b) and ECAR (c) of CD4+ Foxp3-GFP+ TdTomato-RFP+ cells isolated from QPC iKO (n=5) and QPC iWT (n=5) mice 6-weeks after 3 doses of tamoxifen. d, Representative images of QPC iKO animals compared to QPC iWT treated with tamoxifen for 28 days. e, Percentage of CD4+, CD8+, and CD4+ Foxp3-GFP+ in the spleen and lymph nodes expressing high levels of CD44 from QPC iWT (n=4) and QPC iKO (n=4) mice treated with tamoxifen. f, Percentage of post-tamoxifen generated (Foxp3-GFP+ tdTomato-RFP) Treg cells, pre-tamoxifen generated stable (Foxp3-GFP+ tdTomato-RFP+) Treg cells, and previously expressing Foxp3+ (Foxp3-GFP tdTomato-RFP+) T cells of the total CD4+ T cell compartment from QPC iWT (n=4) and iKO (n=4) mice 3 months after 3 doses of tamoxifen. g, Ratio of Foxp3-GFP tdTomato-RFP+ to Foxp3-GFP+ tdTomato-RFP+ cells from QPC iWT (n=4) and QPC iKO (n=4) mice 3 months after tamoxifen. h, Growth of B16 melanoma cells in QPC iWT and QPC iKO mice (n=10 for both groups). Tamoxifen was administered on day −1, 1, 3, 6, 9, and 12 post tumor injection. Images are representative of at least three mice collected on 3 different days. Data represent mean ± SD and were analyzed with (a) two-tailed t-test (** P˂.001, specific p-values displayed in supplemental source data), with (b,c,e-g) multiple two-tailed t-tests using a two-stage linear step-up procedure of Benjamini, Krieger and Yekutieli, with Q = 1%. Each cell type was analyzed individually, without assuming a consistent SD (*Q<.01, **Q<.001, specific q-values displayed in supplemental source data) Data in panel h was analyzed with two-way ANOVA with a Turkey test for multiple comparisons (** Adj-p˂.0001, specific p-values displayed in supplemental source data). All data points on graphs represent individual animals isolated and analyzed on at least 2 separate days
Figure 3:
Figure 3:. Complex III deficiency in Treg cells results in a cell autonomous impairment in expression of genes associated with Treg cell suppressive function along with DNA hypermethylation.
a, The absolute number of CD4+ Foxp3-YFP+ CD25+ (chimeric Treg cells) and CD4+ Foxp3+ CD25+ (total Treg cells) from adult RISP chimeric KO (n=4) and RISP chimeric WT (n=4) mice. b, Volcano plot showing differential gene expression in CD4+ Foxp3-YFP+ CD25+ cells isolated from adult RISP chimeric KO (n=4) and RISP chimeric WT (n=4) mice. c, Heat map of Treg cell signatures genes that are differentially expressed (adj. P<.01) in RISP chimeric KO (n=4) versus RISP chimeric WT (n=4) animals. d, Cumulative distribution function of 17,588 differentially methylated CpGs comparing chimeric Treg cells from RISP chimeric WT (n=4) and Treg-specific RISP-deficient chimeric KO (n=4) mice. Estimated CpG methylation is expressed as beta scores with 0 being unmethylated and 1 fully methylated. e, Metagene analysis of Treg cell-specific super-enhancer methylation from dataset in panel d. Data (a) represent mean ± SD and were analyzed with multiple two-tailed t-tests using a two-stage linear step-up procedure of Benjamini, Krieger and Yekutieli, with Q = 1%. Each cell type was analyzed individually, without assuming a consistent SD (Specific q-values displayed in supplemental source data). Data points on graphs represent individual animals isolated and analyzed on at least 2 separate days. Data in panels b-e are from one RNA sequencing (b,c) and one mRRBS (d,e) experiment respectively. CD4+ Foxp3-YFP+ CD25+ cells from RISP chimeric WT (n=4) and RISP chimeric KO (n=4) animals were isolated on different days. Further processing and sequencing was performed with all 8 samples together.
Figure 4:
Figure 4:. Inhibition of different electron transport chain complexes in regulatory T cells results in distinct alterations in metabolites and gene expression.
a, The ratio of NAD+/NADH in Treg cells isolated from 21-day-old RISP WT (n=6) or RISP KO (n=6) mice. b, Calculated intracellular concentration of 2-HG, succinate, α-KG, and fumarate in Treg cells isolated from 21-day-old RISP WT (n=6) or RISP KO (n=5, n=4 for fumarate) mice. c, Calculated intracellular concentration of 2-hydroxyglutarate (2-HG) and succinate in untreated Treg cells (n=4) or treated with 1μM Piericidin (n=4), 500μM 3-NPA (n=4), or 1μM antimycin A (n=4) for 24 hours in vitro. d, Hierarchical clustering showing changes in gene expression (adj-p<.01) in CD4+ Foxp3-YFP+ CD25+ cells treated with mitochondrial inhibitors for 24 hours. Data represent mean ± SD (a-c) and were analyzed with (a,b) two-tailed t-test (*p<.05 **p˂.01, respectively; specific p-values displayed in supplemental source data), with (c) 1-way ANOVA with Dunnett’s test for multiple comparisons (*adj-p<.05 **adj-p˂.01, respectively; specific p-values displayed in supplemental source data). All data points on graphs represent individual animals isolated and analyzed on at least 2 separate days. Data in panels d is from one RNA sequencing experiment. CD4+ Foxp3-YFP+ CD25+ cells from RISP WT (n=4) animals were isolated and treated with inhibitors on two different days. cDNA library production and sequencing was performed only one time and all 16 RNA samples were prepared together.

Comment in

References

    1. Lu L, Barbi J & Pan F The regulation of immune tolerance by FOXP3. Nat. Rev. Immunol (2017). doi:10.1038/nri.2017.75 - DOI - PMC - PubMed
    1. Josefowicz SZ, Lu L-F & Rudensky AY Regulatory T Cells: Mechanisms of Differentiation and Function. Annu. Rev. Immunol 30, 531–564 (2012). - PMC - PubMed
    1. Gerriets VA et al. Metabolic programming and PDHK1 control CD4+ T cell subsets and inflammation. J. Clin. Invest 125, 194–207 (2014). - PMC - PubMed
    1. Michalek RD et al. Cutting edge: distinct glycolytic and lipid oxidative metabolic programs are essential for effector and regulatory CD4+ T cell subsets. J. Immunol 186, 3299–303 (2011). - PMC - PubMed
    1. Gerriets VA et al. Foxp3 and Toll-like receptor signaling balance Treg cell anabolic metabolism for suppression. Nat. Immunol 17, 1459–1466 (2016). - PMC - PubMed

Publication types

MeSH terms