. 2019 Jan;565(7740):448-453.
doi: 10.1038/s41586-018-0845-0. Epub 2019 Jan 9.

LHX2- and LDB1-mediated trans interactions regulate olfactory receptor choice

Affiliations

LHX2- and LDB1-mediated trans interactions regulate olfactory receptor choice

Kevin Monahan et al. Nature. 2019 Jan.

Abstract

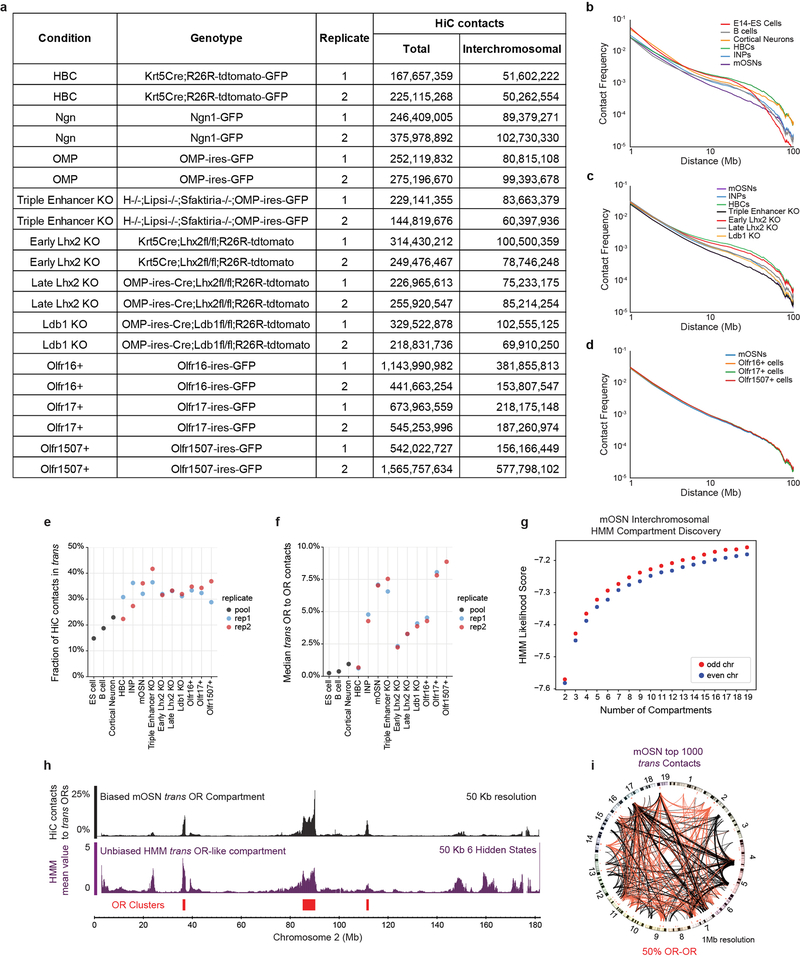
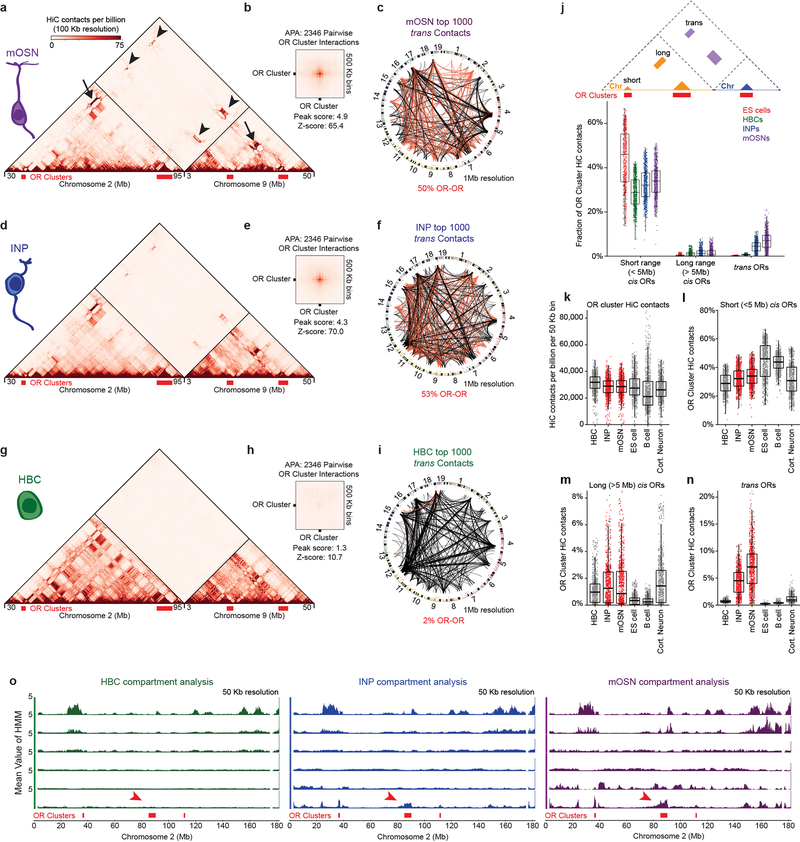
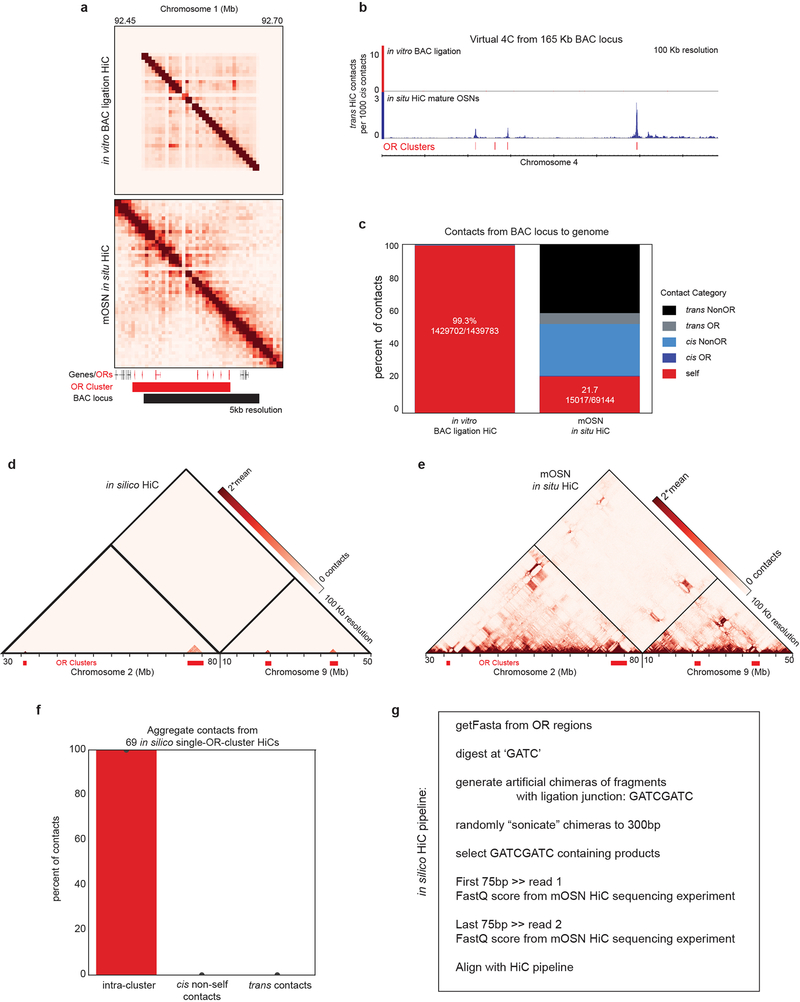
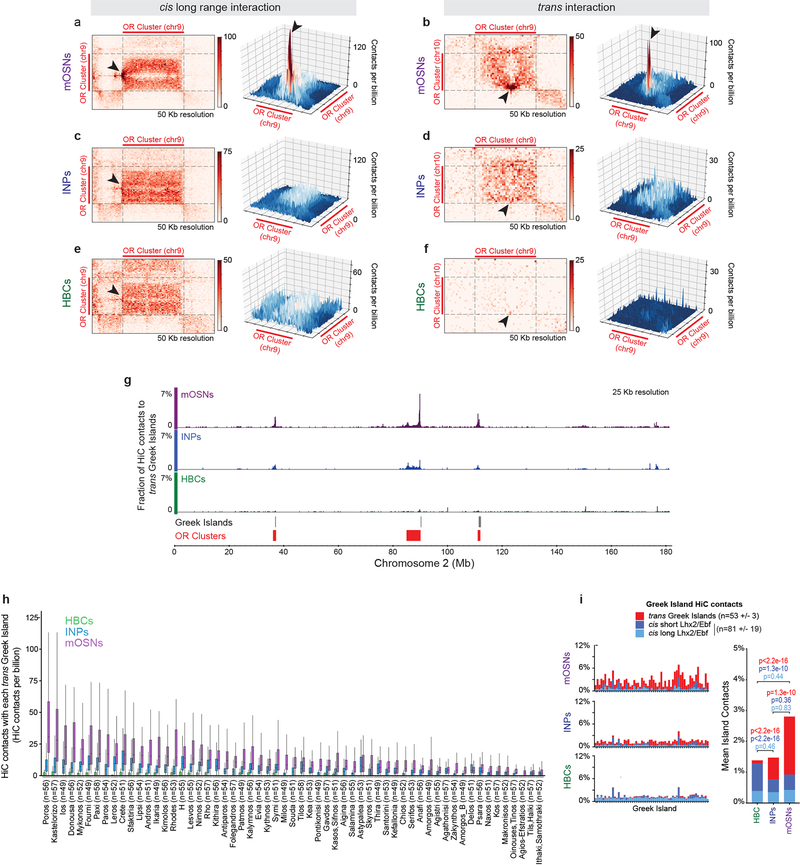
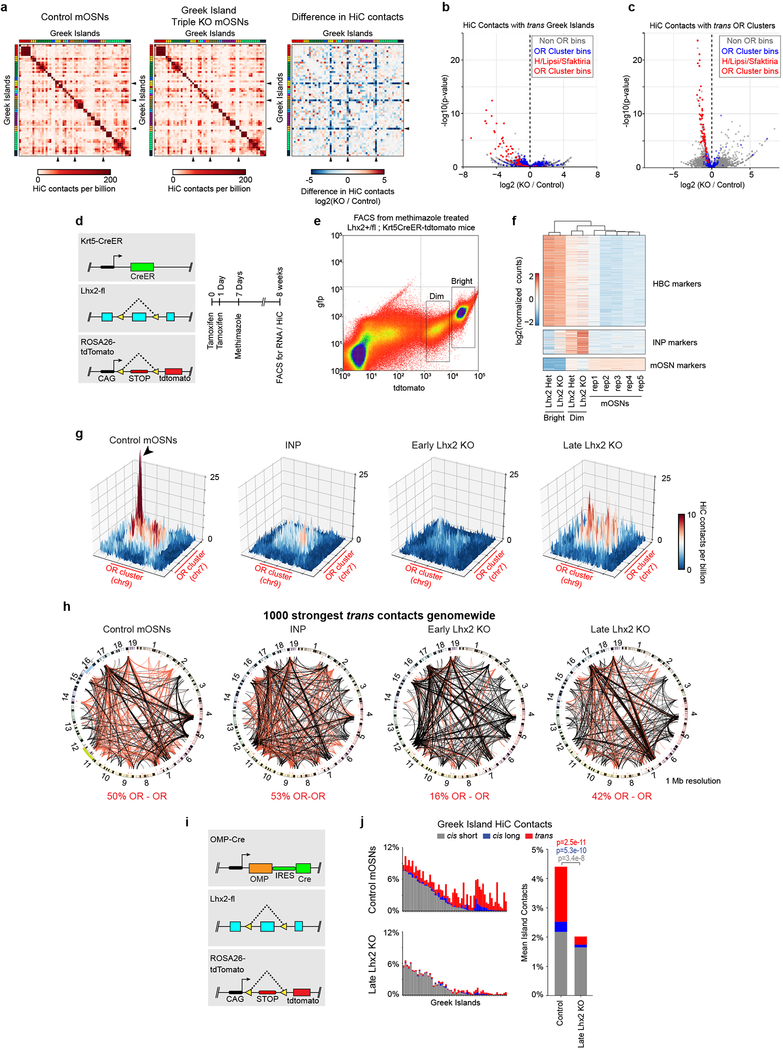
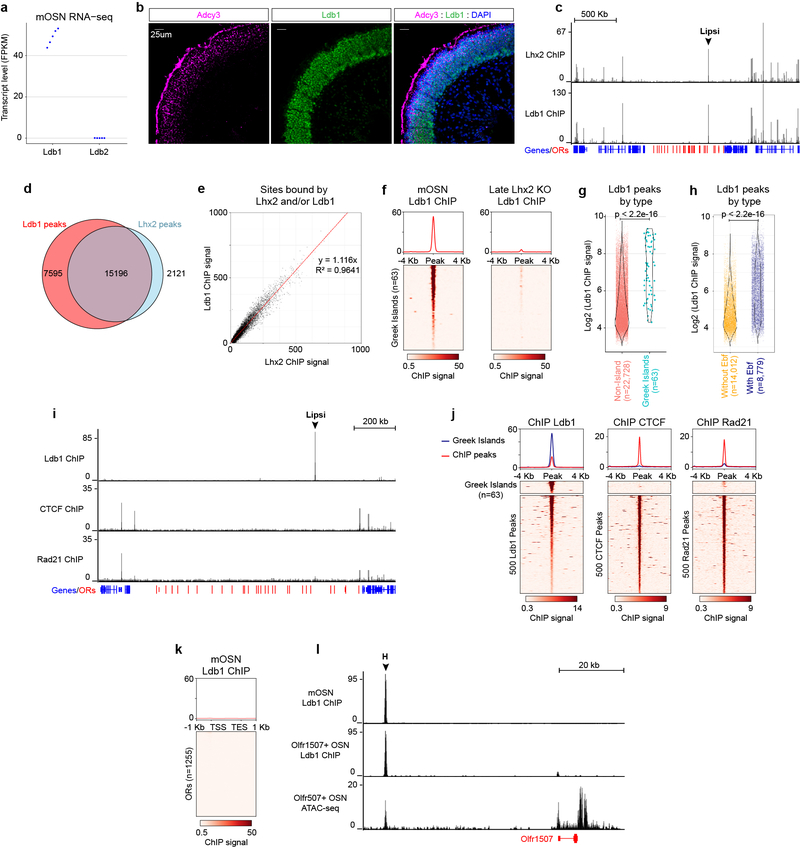
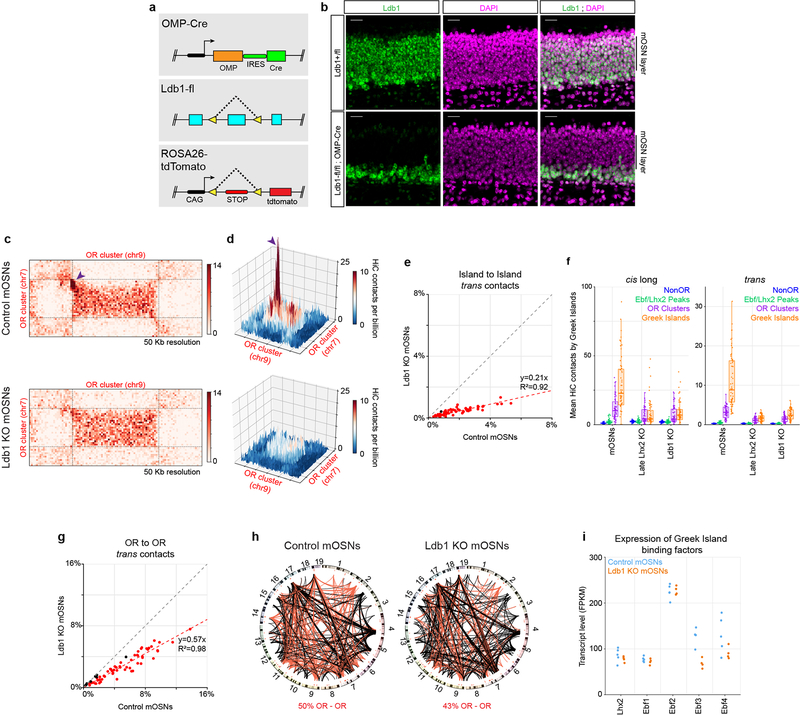
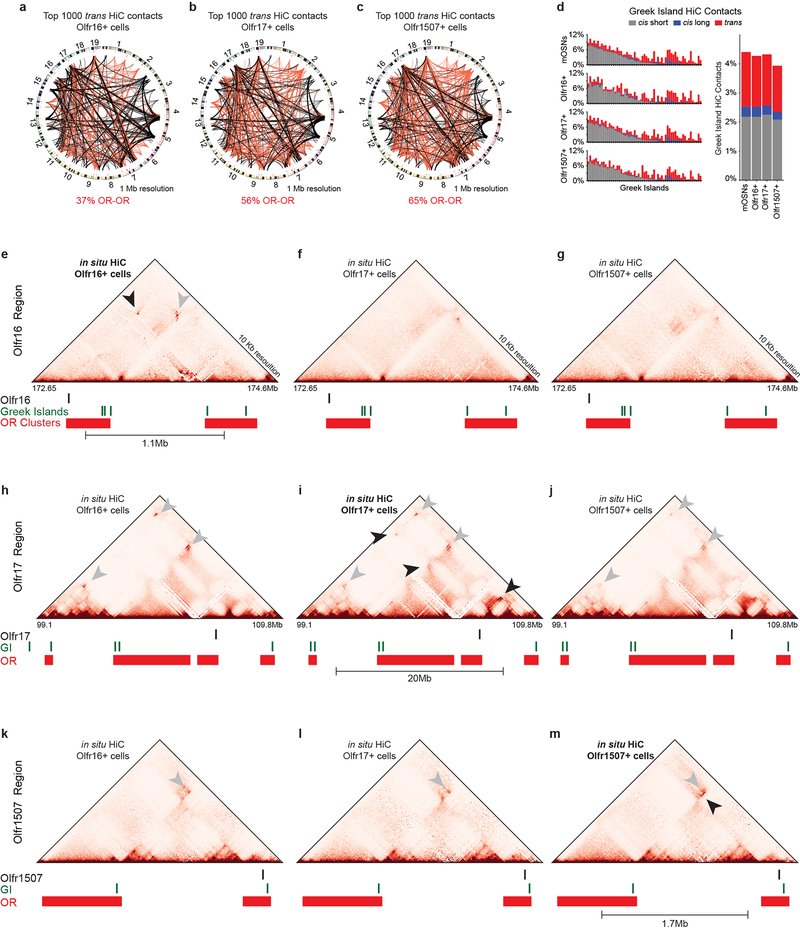
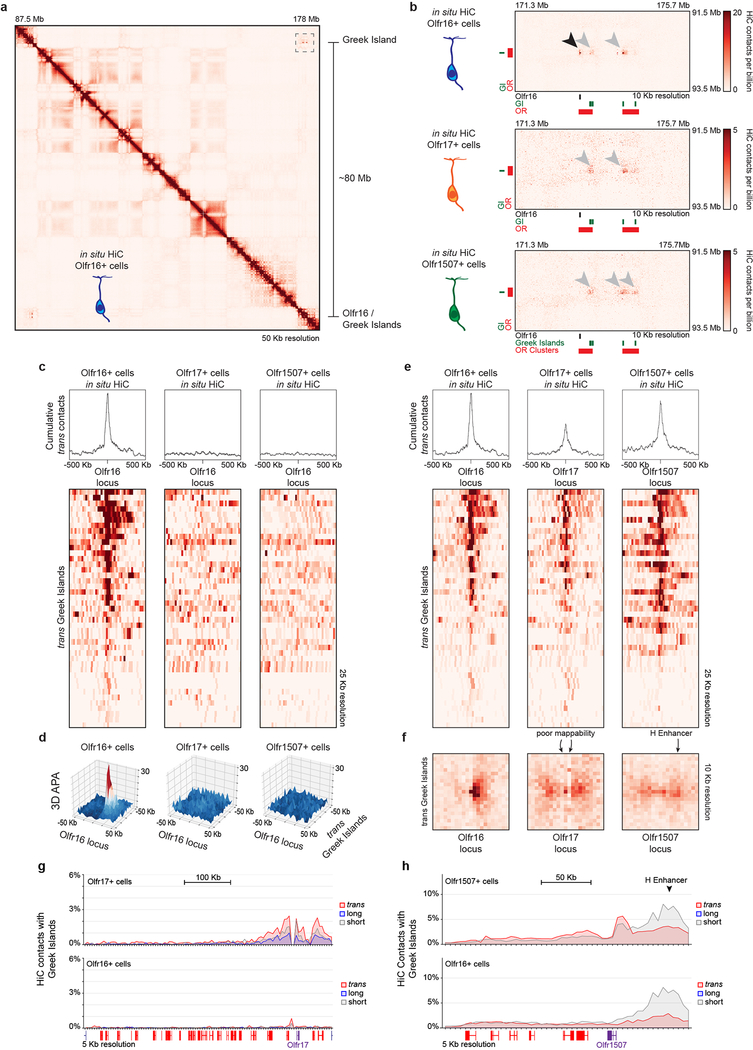
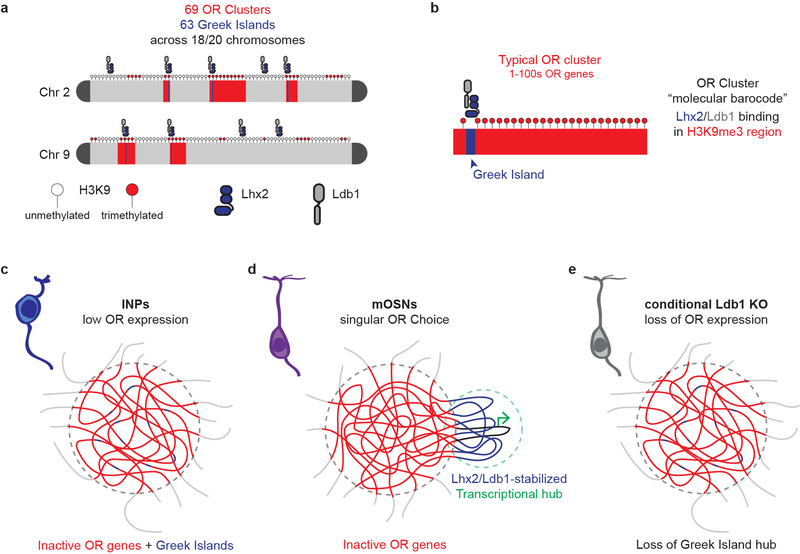
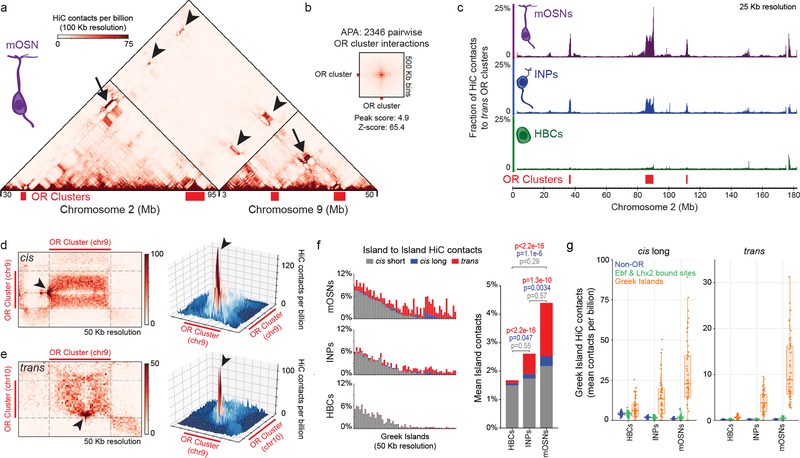
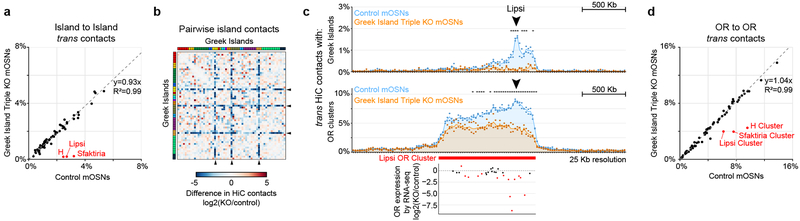
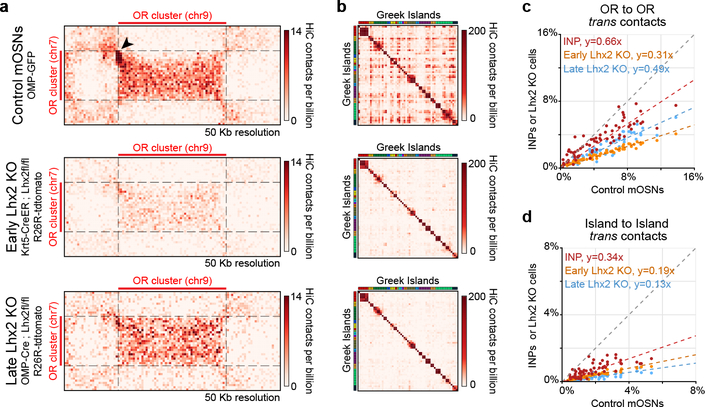
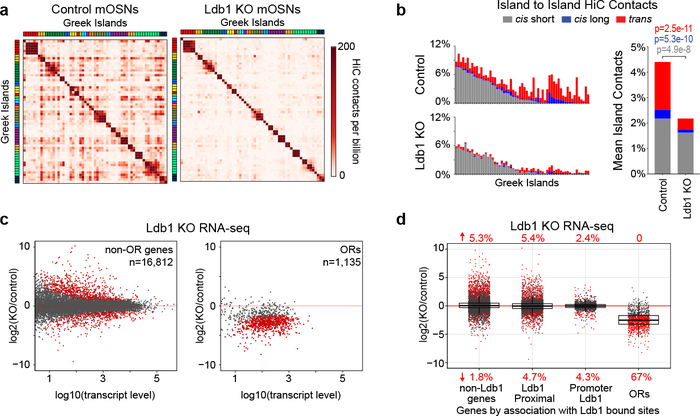
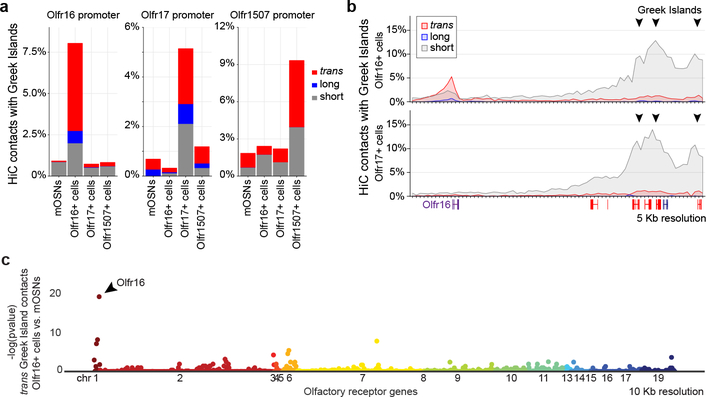
The genome is partitioned into topologically associated domains and genomic compartments with shared chromatin valence. This architecture is constrained by the DNA polymer, which precludes interactions between genes on different chromosomes. Here we report a marked divergence from this pattern of nuclear organization that occurs in mouse olfactory sensory neurons. Chromatin conformation capture using in situ Hi-C on fluorescence-activated cell-sorted olfactory sensory neurons and their progenitors shows that olfactory receptor gene clusters from 18 chromosomes make specific and robust interchromosomal contacts that increase with differentiation of the cells. These contacts are orchestrated by intergenic olfactory receptor enhancers, the 'Greek islands', which first contribute to the formation of olfactory receptor compartments and then form a multi-chromosomal super-enhancer that associates with the single active olfactory receptor gene. The Greek-island-bound transcription factor LHX2 and adaptor protein LDB1 regulate the assembly and maintenance of olfactory receptor compartments, Greek island hubs and olfactory receptor transcription, providing mechanistic insights into and functional support for the role of trans interactions in gene expression.


Conflict of interest statement

Competing interests

The authors declare no competing interests.

Figures

Extended Data Figure 1:
Extended Data Figure 1:. HiC on FAC-sorted primary cells from the MOE reveals extensive interchromosomal interactions between OR clusters.
a, Table summarizing all HiC experiments in this manuscript separated by biological replicates. The total number of HiC contacts in each replicate and the total number of interchromosomal (trans) HiC contacts are shown. b-d, HiC contact curves for wild-type conditions (b), for wild-type and mutant MOE populations (c), and for cells sorted based upon the expression of specific OR genes (d). All panels present pooled data from 2 independent biological replicates that yielded similar results when analyzed separately. e, graphs showing the proportion of trans HiC contacts between replicates of each genotype and cell type. Pooled data from publicly available data sets is shown for ES cells, B cells, and cortical neurons. f, same as e, but showing the median fraction of HiC contacts made to trans OR clusters for OR cluster regions divided into 50 Kb bins. g, Machine learning Hidden Markov Model (HMM) score for a given number of compartments (see Extended Materials and Methods). 9 compartments were used for further analysis. h, From the 9 HMM-derived compartments, one includes predominantly OR clusters (magenta, bottom panel) and overlaps with OR compartments defined by biased analysis of trans OR contacts (black top panel). OR gene clusters depicted in red. Scale on the biased analysis represents the percentage of HiC contacts mapped to trans OR clusters (pooled data from 2 biological replicates). Scale in the HMM-derived compartments represents the average value of a given locus in a given compartment. i, Circos plots depicting the strongest 1000 interchromosomal interactions genomewide at 1 Mb resolution in mOSNs. Red lines represent OR-to-OR contacts and black lines non-OR-to-non-OR contacts. Line thickness increases with contact frequency. Chromosome numbers depicted at the periphery of the circle.
Extended Data Figure 2:
Extended Data Figure 2:. Extensive interchromosomal contacts form between OR gene clusters over OSN differentiation.
a-i, In situ HiC contact matrix of chromosomes 2 and 9, Aggregate Peak Analysis (APA), and Circos plot depicting the strongest 1000 interchromosomal interactions genomewide for mOSNs (a-c), INPs (d-f), and HBCs (g-i). All three sets of analyses reveal an increase in trans OR cluster interactions over the course of differentiation. j, For OR gene clusters (divided into 50 Kb bins, n=768 bins) the frequency of cis short (<5Mb distance, including self), cis long (>5 Mb), and trans contacts with OR clusters is shown, expressed as the fraction of total HiC contacts mapped to each bin. k, Number of HiC contacts, normalized to a library size of one billion HiC contacts genomewide, observed for each OR cluster region (divided into 50 Kb bins, n=768 bins) in HBCs, INPs, mOSNs, ES cells, B cells, and cortical neurons. l-n, For OR cluster regions (divided into 50 Kb bins, n=768 bins), the fraction of total HiC contacts that are made to ORs clusters located in short range cis (l), long range cis (m) and trans (n). o, The 6 most distinct HMM-derived compartments of chromosome 2 in HBCs (green, left), INPs (blue, middle) and mOSNs (magenta, right). OR clusters emerge as distinct compartment in INPs and strengthen in mOSNs. For all boxplots, box indicates median, upper, and lower quartiles while whiskers indicate 1.5 * the interquartile range. All panels present pooled data from 2 independent biological replicates that yielded similar results when analyzed separately.
Extended Data Figure 3:
Extended Data Figure 3:. In vitro and in silico HiC experiments show that OR HiC contacts are generated by unique sequences that do not map to other OR clusters.
a, Contact matrix from in vitro HiC (top) using a 165Kb BAC plasmid containing 7 OR genes from an OR cluster from chromosome 1 and in situ HiC from mOSNs (bottom). HiC contacts in the BAC HiC are restricted to the coordinates of the BAC plasmid and do not extend to two OR genes from this cluster that are absent from the BAC. b, Virtual 4C from the 165 Kb BAC region to chromosome 2, which contains the highest number of OR genes. On top, virtual 4C from the BAC in vitro HiC shows that no reads mapped to ORs from chromosome 2, whereas the same 165 Kb regions makes abundant trans contacts with these ORs in mOSNs. c, 99.3% of all the BAC HiC contacts map within the BAC, whereas in mOSNs only 21.7% of the BAC region HiC contacts map within the BAC. d, In silico HiC analysis shows complete absence of mis-mapped reads corresponding to OR clusters under the mapping conditions used throughout the manuscript (removing mapq<30). Each OR cluster was subjected to intra-cluster in silico HiC (g) and then the HiC contacts of the 69 OR clusters were mapped in aggregate to the whole genome. As seen in the contact matrix from chromosomes 2 and 9(d), the in silico reads only map within clusters, with no mis-mapped reads that would erroneously be interpreted as inter-cluster cis or trans contacts. e, For reference, the corresponding in situ HiC from mOSNs. f, Aggregate analysis for all 69 OR gene clusters shows that our mapping protocol does not mis-map any HiC contacts to the wrong OR cluster. g, Brief description of the pipeline used for the in silico analysis.
Extended Data Figure 4:
Extended Data Figure 4:. Greek Islands make differentiation-dependent contacts with other Greek Islands in trans that are stronger than cis contacts with Lhx2/Ebf peaks.
a-b, Heatmap and 3D projection of HiC contacts between a pair of OR gene clusters in cis (a) and trans (b) reveals a local maximum of in situ HiC interactions between Greek Island loci (arrowheads) in mOSNs. c-f, Same as a, b but for immediate neuronal precursors (INPs) and Horizontal Basal Cells (HBCs). g, For chromosome 2, fraction of all HiC contacts made to trans Greek Islands in mOSNs (top), INPs (middle) and HBCs (bottom). h, For each Greek Island, the distribution of HiC contacts, expressed as contacts per billion, made to individual Greek Islands located in trans for HBCs, INPs and mOSNs. Box indicates median, upper, and lower quartiles while whiskers indicate 1.5 * the interquartile range. For each Greek Island, the number of trans Greek Islands is listed. i, (left) Comparison of the total fraction of HiC contacts made by each Greek Islands to intergenic Lhx2/Ebf co-bound peaks present in cis versus Greek Islands present in trans for HBCs, INPs and mOSNs. For each category we compare roughly equal numbers of peaks (number of trans Greek Islands for each Island versus number of cis Lhx2/Ebf sites for each Island, mean+/− standard deviation). (right) Mean fraction of HiC contacts across all Greek islands (two-sided, paired Wilcoxon signed-rank test, n=59). Contacts with trans Greek Islands (red) constitute a higher fraction of HiC contacts than short-range cis (dark blue) or long-range cis (light blue) contacts with intergenic Lhx2/Ebf peaks. All panels present pooled data from 2 independent biological replicates that yielded similar results when analyzed separately.
Extended Data Figure 5:
Extended Data Figure 5:. Greek Islands and Lhx2 are required for OR compartmentalization in developing OSNs.
a, Pairwise HiC contacts between all pairs of Greek Islands ordered by genomic position in Control (left) and Greek Island Triple KO (right) mOSNs. The 50 Kb regions containing the deleted Greek Islands are marked with arrowheads. Plotting the log2 fold difference in HiC contacts (right) reveals that consistent strong reductions are observed for the deleted Islands. Color bar depicts chromosome. b,c, The genomic regions exhibiting the most significant reductions in HiC contacts with trans OR Greek Islands (b) or trans OR clusters (c) in Triple KO mOSN relative to control mOSNs are mostly located within the 3 OR clusters containing the with Greek Island deletions (two biological replicates per condition, see Extended Materials and Methods). d, Genetic and experimental strategy for early Lhx2 deletion. Tamoxifen induction with Krt5CreER deletes Lhx2 in HBCs and then methimazole treatment ablates INPs/mOSNs, leading to regeneration from Lhx2-deleted HBCs. e, fluorescent labeling of the HBC-derived cells upon methimazole induction reveals two major populations, bright and dim. f, By RNA-seq the dim population expresses markers of INPs and mOSNs while the bright population expresses markers of HBCs. Counts are normalized by row. g, 3-D projection of HiC contacts between OR clusters located on different chromosomes in control mOSNs (left), INPs, early Lhx2 KO, and late Lhx2 KO (right) cells. A HiC hotspot between interacting Greek Islands is only observed in control mOSNs (arrowhead). In addition, a strong reduction in the surrounding OR-OR contacts relative to mOSNs or INPs is observed in the early Lhx2 KO. h, Circos plots depicting the strongest 1000 interchromosomal interactions genomewide at 1 Mb resolution in mOSNs (left), INPs, early Lhx2 KO cells, and late Lhx2 KO cells (right). Red lines represent OR-OR contacts and black lines non-OR-non-OR contacts. Line thickness increases with contact frequency. Chromosome numbers depicted at the periphery of the circle. i, Genetic strategy for late Lhx2 deletion and fluorescent marking of Lhx2 KO mOSNs. j, (left) For each Greek Island, the fraction of total HiC contacts made to other Greek Islands located in cis at short range (<5 Mb apart, grey), long range (>5Mb apart, blue), and in trans (red). Top panel represents control mOSNs and bottom panel late Lhx2 KO cells. (right) The effect of late Lhx2 KO on the mean fraction of HiC contacts across all Greek Islands (two-sided, paired Wilcoxon signed-rank test, n=59).
Extended Data Figure 6:
Extended Data Figure 6:. Ldb1 expression and genomic distribution in mOSNs.
a, Transcript level, expressed as fragments per kilobase per million mapped reads (fpkm), of the two Ldb family members in mOSN RNA-seq data sets (n=5 biological replicates). b, Sections of olfactory epithelium stained for Ldb1 (green) and Adcy3 (magenta), a marker for mOSNs. Nuclei are labeled with DAPI (blue). Scale bar = 25um. Similar results were obtained from four independent experiments. c, Ldb1 and Lhx2 ChIP-seq signal in mOSNs across the OR gene cluster containing the Greek Island Lipsi. OR genes are red and all other genes are blue. Plot shows pooled data from 2 biological replicates for Lhx2 and 3 biological replicates for Ldb1, each of which yielded similar results when analyzed separately. Values are counts per 10 million reads. d, Extensive overlap between consensus Lhx2 and Ldb1 ChIP-seq peak sets. e, linear relationship between normalized Lhx2 ChIP signal and Ldb1 ChIP signal. Any peak observed in at least two of the 5 experiments (2 for Lhx2 and 3 for Ldb1) was included (n=26,667) and plotted together with a best fit line obtained by linear regression with y-intercept set to 0. f, Ldb1 ChIP signal over Greek Islands in mOSNs and Late Lhx2 KO mOSNs. Heatmap shows pooled data from 3 biological replicates for mOSNs and 2 biological replicates for Late Lhx2 KO cells, each of which yielded similar results when analyzed separately. Values are counts per 10 million reads. g, Normalized Ldb1 ChIP-seq signal is greater for Ldb1 peaks that overlap Greek Islands than for peaks that do not (p < 2.2e-16, two-sided Wilcoxon rank sum test, n=63 for Greek Islands, n=22,728 for non-Island peaks). Violin plots are scaled to the same area and show density for the full set of points over the full range. h, Normalized Ldb1 ChIP-seq signal is greater for Ldb1 peaks that overlap Ebf ChIP peaks than for peaks that do not (p < 2.2e-16, two-sided Wilcoxon rank sum test, n=8,779 for Ldb1 peaks that overlap Ebf peaks, n=14,012 for non-Ebf peaks). Violin plots are scaled to the same area and show density for the full set of points over the full range. i, mOSN ChIP-seq for Ldb1, CTCF, and the cohesin-subunit Rad21 across the OR gene cluster containing the Greek Island Lipsi. OR genes are red and all other genes are blue. Plot shows pooled data from 3 biological replicates for Ldb1 and 2 biological replicates CTCF and Rad21. Values are counts per 10 million reads. Analyzing each replicate separately yielded similar results. j, mOSN ChIP signal over Greek Islands and non-Geek Island ChIP-seq peaks. For ChIP-seq peaks, the heatmap shows 500 randomly selected peaks and the plot shows data from the full consensus set of peaks (n=22,791 for Ldb1, n=24,883 for CTCF, and n=9,882 for Rad21). Plots show pooled data, similar results were obtained with each replicate (n=3 for Ldb1 ChIP-seq and n=2 for CTCF and Rad21 ChIP-seq). Units are counts per 10 million reads. k, As in j, but showing Ldb1 ChIP signal over OR genes (n=1,255) in mOSNs. l, Ldb1 ChIP-seq from control mOSNs (top) and Olfr1507-expressing cells (middle). Strong signal is observed on the Greek Island, H, in both populations but only a very weak signal on the Olfr1507 promoter when it is transcriptionally engaged. Pooled data from 3 biological replicates is shown for the mOSNs. One of two biological replicates is shown for Olfr1507+ OSNs; the other replicate yielded similar results but with lower enrichment in peaks. ATAC-seq from the Olfr1507-expressing cells (bottom) shows that the promoter of Olfr1507 has similar accessibility to the H element. ATAC-seq plot shows pooled data from two biological replicates that yielded similar results.
Extended Data Figure 7:
Extended Data Figure 7:. Effects of conditional Ldb1 deletion in Greek Island interactions and OR expression.
a, Schematic of the genetic strategy used to generate Ldb1 KO mOSNs that are fluorescently labeled b, In Ldb1fl/fl;OMP-Cre mice, Ldb1 (green) is lost from mOSNs but retained in basal immature cells. Nuclei are stained with DAPI (magenta). Scale bar = 20um. Similar results were obtained from three independent experiments. c, HiC contacts between a pair of OR clusters located on different chromosomes in control (top), and Ldb1 KO (bottom) OSNs. A HiC hotspot between interacting Greek Islands in control mOSNs (arrowheads) is absent in Ldb1 KO OSNs d, 3D projection of the same OR cluster pair in control and Ldb1 KO OSNs. e, trans interactions of each Greek Island (n=59) with the other Greek Islands as fraction of the total HiC contacts in mOSNs versus Ldb1 KO cells. Greek Islands changed more than 2-fold are red. f, For each Greek Island, the mean number of cis long range (left) and trans (right) HiC contacts per billion made to every non-OR sequence (at 50 Kb resolution), intergenic Lhx2 & Ebf bound peak (outside of OR clusters), or Greek Island. Box indicates median, upper, and lower quartiles while whiskers indicate 1.5 * the interquartile range. g, same as e but for trans contacts between OR gene clusters (n=67). Clusters changed more than 1.5-fold are red. h, Circos plots depicting the strongest 1000 interchromosomal interactions genomewide at 1Mb resolution in control mOSNs (left), Ldb1 KO mOSNs (right). Red lines represent OR-OR contacts and black lines non-OR-non-OR contacts. Line thickness increases with contact frequency. Chromosome numbers depicted at the periphery of the circle. i, Transcript levels of Greek Island-binding factors in RNA-seq data from control mOSNs and Ldb1 KO mOSNs. Transcript levels of Ebf3 are reduced approximately 2-fold (p = 0.031 for greater than 1.5-fold change, DESeq2 normalized Wald test with n=5 for control mOSNs and n=4 Ldb1 KO). The expression of other factors is not significantly different between conditions.
Extended Data Figure 8:
Extended Data Figure 8:. Long range interactions in homogeneous OSN subpopulations.
a-c, Circos plots representing the 1000 strongest trans contacts in Olfr16- (a), Olfr17- (b) and Olfr1507- (c) expressing OSNs. d, (left) Comparison of the frequency of local cis (grey), long range cis (blue) and trans (red) Greek Island interactions in mixed mOSNs and OSNs expressing specific OR genes. (right) Mean values for Olfr16+, Olfr17+, and Olfr1507+ cells are not significantly different from those for mixed mOSNs (p > 0.05 for all comparisons, two-tailed paired Wilcoxon signed-rank test). e, in situ HiC contact matrices from Olfr16+, Olfr17+ and Olfr1507+ cells focused on the Olfr16 gene locus. Arrowhead points to specific long-range contacts between Olfr16 and the Greek Island Astypalea that occur only in Olfr16+ cells. Open pin marks Greek Island-Greek Island contacts that also differ between cell types. f-g, Similar analysis for the Olfr16 locus in Olfr17+ and Olfr1507+ cells. h-j, as in e-g, except for the Olfr17 locus. k-m, as in e-g, except for the Olfr1507 locus.
Extended Data Figure 9:
Extended Data Figure 9:. Long-range cis and trans contacts between Greek Islands and the active OR gene.
a, HiC Contacts that span more than 80 Mb are observed between the Olfr16 locus and Greek Islands in Olfr16+ cells. b, Close examination of the contacts (dashed box from a) reveals that Greek Islands contact Olfr16+ only in Olfr16+ cells (top, black arrowhead). Extremely long-range contacts between Greek Islands (gray arrowheads), but not involving the Olfr16 locus, are observed also in Olfr17+ and Olfr1507+ cells (middle, bottom). c, Heatmap depicting interchromosomal contacts between Olfr16 (chromosome 1) and Greek Islands from different chromosomes in in situ HiC from Olfr16+, Olfr17+ and Olf1507+ cells. d, 3D projection of APA between the Olfr16 locus and trans Greek Islands in the three specific mOSN populations. e, Heatmaps for contacts between Olfr16, Olfr17, or Olfr1507 and trans Greek Islands reveals an accumulation of contacts centered around the active allele. f, APA for an OR vs trans Greek Islands shows the accumulation of contacts on the active allele at 10 Kb resolution. The poor mappability of the Olfr17 locus and the lower sequencing depth perturbs the expected focal peak. For the Olfr1507 locus, the presence of the Greek Island, H, 50 Kb from Olfr1507 results in HiC contacts spanning a broad area. g,h, Short, long, and trans contacts with Greek Islands across the OR gene clusters containing Olfr17 (g) and Olfr1507 (h) plotted as fraction of the total HiC contacts mapped to each position (5 Kb resolution). Top panel shows contact in cells in which Olfr17/Olfr1507 is active, and the bottom panel shows data from Olfr16+ cells in which Olfr17/Olfr1507 is silent.
Extended Data Figure 10.
Extended Data Figure 10.. A model for specific OR compartmentalization and the generation of mutually exclusive phases regulating OR gene choice.
a,b, Coincidence of Lhx2/Ldb1 peaks with H3K9me3 enrichment may generate an OR-enriched molecular barcode that promotes specific interactions between OR gene clusters. c, In INPs, where OR compartments first form, Greek Islands do not make specific contacts with each other. d, In mOSNs however, Greek Islands through specifically interact with each other through homotypic Ldb1 interactions, forming a multi-enhancer hub that is segregated from the OR compartment. We hypothesize that OR compartments and Greek Island hubs form incompatible liquid phases driven by Hp1 proteins and the unstructured domains of Lhx2 and Ldb1, respectively. e, Upon deletion of Ldb1 (or Lhx2) the Greek Island phase falls apart and the Greek Islands become incorporated to the OR compartments, as in the INPs.
Figure 1:
Figure 1:. Extensive interchromosomal contacts between OR gene clusters and focal interchromosomal contacts between Greek Islands form over OSN differentiation.
a, In situ HiC contact matrix of chromosomes 2 and 9 in mOSNs shows highly restricted and frequent contacts between OR gene clusters in cis (arrows) and trans (arrowheads). b. Aggregate Peak Analysis (APA) shows strong focal contacts between OR gene clusters in mOSNs. c, The fraction of HiC contacts made to OR clusters located on a different chromosome is shown for every 25 Kb bin along chromosome 2. For OR clusters these contacts increase over differentiation form HBCs (bottom) to INPs (middle) to mOSNs (top). d-e, Pairwise views of OR gene clusters reveals a local maximum of in situ HiC interactions between Greek Island loci (arrowheads) in cis (a) and trans (b). f, (left) For each Greek Island, the fraction of total HiC contacts that are made to other Greek Islands located in cis at short range (<5 Mb apart, grey), long range (>5Mb apart, blue), and in trans (red). Top panel represents mOSNs, middle panel INPs, and bottom panel HBCs. (right) Mean fraction of HiC contacts across all Greek Islands (two-sided, paired Wilcoxon signed-rank test, n=59). g, For each Greek Island bin (n=59), the mean number of cis long range (left) and trans (right) HiC contacts per billion made to every non-OR sequence (at 50 Kb resolution), intergenic Lhx2 & Ebf bound peak (outside of OR clusters), or Greek Island. Box indicates median, upper, and lower quartiles while whiskers indicate 1.5 * the interquartile range. All panels present pooled data from 2 independent biological replicates that yielded similar results when analyzed separately.
Figure 2:
Figure 2:. Greek Island deletion disrupts local recruitment of trans Greek Islands and impairs OR compartmentalization.
a, In mOSNs in which 3 Greek Islands (H, Lipsi, and Sfaktiria) have been homozygously deleted, the 50 Kb regions containing the deleted Islands have reduced trans Greek Island contacts, expressed as fraction of total HiC contacts. Interactions among the remaining Islands are not significantly different (p=0.80, two-sided, paired Wilcoxon signed-rank test, n=56). b, Pairwise heatmap of Greek Island contacts reveals that the 50 Kb regions containing the deleted Greek Islands (arrowheads) exhibit reduced contacts, plotted as Log2 fold difference, across the full set of Greek Islands. Greek Islands are ordered by genomic position and color bar indicates chromosome. c, The OR gene cluster containing Lipsi makes fewer HiC contacts with trans Greek Islands and OR gene clusters in KO mOSNs than on control mOSNs. Count data for trans Greek Island contacts and trans OR cluster contacts from 2 biological replicates were analyzed to identify loci with a significant difference in contacts between conditions (see Extended Materials and Methods). Significantly changed regions, corrected for multiple comparisons, are indicated with an asterisk (padj < 0.05, Wald test). Lower panel shows RNA-seq analysis of the expression of OR genes in KO mOSNs relative to control mOSNs. Significantly changed ORs are red (p < 0.01, Wald test, 5 biological replicates for control mOSNs and 4 for KO mOSNs). d, OR gene clusters containing the deleted Greek Islands (red) make fewer contacts with trans OR gene clusters in KO mOSNs, plotted as fraction of the total HiC contacts. Contacts made by the non-targeted clusters are not significantly different (p=0.79, two-sided, paired Wilcoxon signed-rank test, n=64). Panels a and d present pooled data from 2 independent biological replicates that yielded similar results when analyzed separately.
Figure 3:
Figure 3:. Lhx2 is essential for the formation of OR compartments and the assembly and stability of Greek Island hubs.
a, Pairwise views of HiC contacts between OR clusters located on different chromosomes in control (top), early Lhx2 KO (middle), and late Lhx2 KO (bottom) OSNs. A HiC hotspot between interacting Greek Islands in control mOSNs (arrowhead) is absent in both early and late Lhx2 KO cells. In addition, a strong reduction in the surrounding OR-OR contacts is observed in the early Lhx2 KO. b, Pairwise heatmap of Greek Island contacts reveals reduced HiC contacts across the full set of Greek Islands. c, Contacts made by each OR cluster (n=67) to OR clusters located in trans, expressed as fraction of the total HiC contacts, in mOSNs versus INPs, early, or late Lhx2 KO cells. Dashed line is a linear fit. d, same as c, but for trans contacts between Greek Islands (n=59). All panels present pooled data from 2 independent biological replicates that yielded similar results when analyzed separately.
Figure 4:
Figure 4:. Ldb1 is essential for the stability of Greek Island hubs and for OR transcription.
a, Pairwise heatmap of Greek Island contacts reveals broad reductions in HiC contacts in Ldb1 KO mOSNs. b, (left) For each Greek Island, the fraction of total HiC contacts made to other Greek Islands located in cis at short range (<5 Mb apart, grey), long range (>5Mb apart, blue), and in trans (red). Top panel represents control mOSNs and bottom panel Ldb1 KO cells. (right) The effect of Ldb1 KO on the mean fraction of HiC contacts across all Greek Islands (two-sided, paired Wilcoxon signed-rank test, n=59). c, RNA-seq analysis of gene expression in Ldb1 KO cells relative to control mOSNs. Significantly changed genes are colored red (padj < 0.05 for greater than 1.5-fold change, Wald test, n=5 for control mOSNs and n=4 Ldb1 KO). d, Effect of Ldb1 KO on genes not associated with Ldb1 ChIP peaks (n=9,548), genes located closest to a non-promoter Ldb1 ChIP-seq peak (n=5,624), genes with an Ldb1 ChIP-seq peak within the promoter region (n=1,640), and ORs (n=1,135). The percentage of significantly changed genes in each category is shown (padj < 0.05 for greater than 1.5-fold change, Wald test, n=5 for control mOSNs and n=4 Ldb1 KO). Box indicates median, upper, and lower quartiles while whiskers indicate 1.5 * the interquartile range. Panels a and b present pooled data from 2 independent biological replicates that yielded similar results when analyzed separately.
Figure 5:
Figure 5:. Greek Island hubs interact specifically with the transcriptionally active OR locus.
a, Increased contacts between the active OR promoter and Greek Islands located in short range cis (<5Mb, grey), long range cis (>5Mb, blue) and trans (red). Greek Island interactions are expressed as the fraction of the total HiC contacts mapped to each promoter (5 Kb resolution). b, Profile of the OR cluster containing Olfr16 reveals increased contacts, expressed as fraction of the total HiC contacts mapped to each position (5 Kb resolution), between the Olfr16 locus and Greek Islands in Olfr16 expressing cells. c, Manhattan plot of Greek Island contacts with OR genes reveals that in Olfr16+ cells the Olfr16 locus is the OR gene most significantly enriched for Greek Island contacts relative to heterogeneous mOSNs (see Extended Materials and Methods). All panels present pooled data from 2 independent biological replicates that yielded similar results when analyzed separately.

Comment in

Similar articles

Cited by

References

    1. Buck L & Axel R A novel multigene family may encode odorant receptors: a molecular basis for odor recognition. Cell 65, 175–187 (1991). - PubMed
    1. Magklara A et al. An epigenetic signature for monoallelic olfactory receptor expression. Cell 145, 555–570, doi:S0092–8674(11)00374–6 [pii] 10.1016/j.cell.2011.03.040 (2011). - DOI - PMC - PubMed
    1. Chess A, Simon I, Cedar H & Axel R Allelic inactivation regulates olfactory receptor gene expression. Cell 78, 823–834 (1994). - PubMed
    1. Monahan K & Lomvardas S Monoallelic expression of olfactory receptors. Annu Rev Cell Dev Biol 31, 721–740, doi:10.1146/annurev-cellbio-100814-125308 (2015). - DOI - PMC - PubMed
    1. Lyons DB et al. An epigenetic trap stabilizes singular olfactory receptor expression. Cell 154, 325–336, doi:10.1016/j.cell.2013.06.039 (2013). - DOI - PMC - PubMed

Publication types

MeSH terms