. 2019 Mar;19(3):1613-1621.
doi: 10.3892/mmr.2019.9801. Epub 2019 Jan 2.

A thirteen‑gene set efficiently predicts the prognosis of glioblastoma

Affiliations

A thirteen‑gene set efficiently predicts the prognosis of glioblastoma

Huyin Yang et al. Mol Med Rep. 2019 Mar.

Abstract

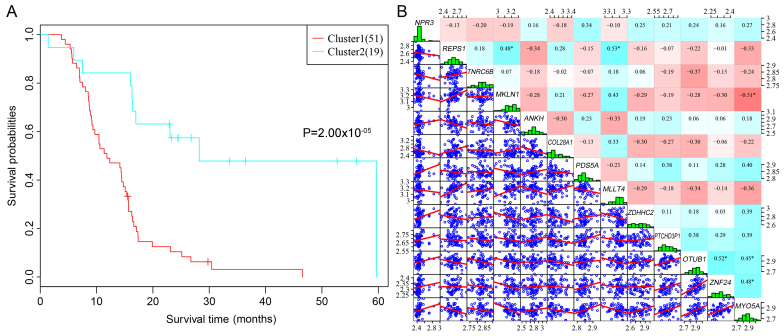
Glioblastoma multiforme (GBM) is the most common type of brain cancer; it usually recurs and patients have a short survival time. The present study aimed to construct a gene expression classifier and to screen key genes associated with GBM prognosis. GSE7696 microarray data set included samples from 10 recurrent GBM tissues, 70 primary GBM tissues and 4 normal brain tissues. Seed genes were identified by the 'survival' package in R and subjected to pathway enrichment analysis. Prognostic genes were selected from the seed genes using the 'rbsurv' package in R, unsupervised hierarchical clustering, survival analysis and enrichment analysis. Multivariate survival analysis was performed for the prognostic genes, and the GBM data set from The Cancer Genome Atlas database was utilized to validate the prognostic genes. Of the 1,785 seed genes analyzed, 13 prognostic feature genes, including collagen type XXVIII α1 chain (COL28A1), PDS5 cohesin‑associated factor A (PDS5A), zinc‑finger DHHC‑type containing 2 (ZDHHC2), zinc‑finger protein 24 (ZNF24), myosin VA (MYO5A) and myeloid/lymphoid or mixed‑lineage leukemia translocated to 4 (MLLT4), were identified. These genes performed well on sample classification and prognostic risk differentiation, and six pathways, including adherens junction, cyclic adenosine 3',5'‑monophosphate signaling and Ras signaling pathways, were enriched for these feature genes. The high‑risk group was slightly older compared with the low‑risk group. The validation data set confirmed the prognostic value of the 13 feature genes for GBM; of these, COL28A1, PDS5A, ZDHHC2, ZNF24, MYO5A and MLLT4 may be crucial. These results may aid the understanding of the pathogenesis of GBM and provide important clues for the development of novel diagnostic markers or therapeutic targets.


Figures

Figure 1.
Figure 1.
Bioinformatics workflow. The GSE7696 dataset that comprised 70 primary GBM samples was downloaded from the GEO database. Upon filtering out the unloaded probes, a total of 1,785 probes were obtained; the corresponding genes were subjected to pathway enrichment analysis. A total of 13 prognostic feature genes were screened and subjected to unsupervised hierarchical clustering analysis and KM survival analysis. The TCGA dataset that included 152 primary GBM samples was used to validate the results of the 13 prognostic feature genes, and was subjected to multivariate survival analysis and KM survival analysis. GBM, glioblastoma multiforme; GEO, Gene Expression Omnibus; KM, Kaplan-Meier; TCGA, The Cancer Genome Atlas.
Figure 2.
Figure 2.
Clustering heatmap for the 13 prognostic feature genes. The horizontal axis represents the samples, and the vertical axis represents the genes.
Figure 3.
Figure 3.
Kaplan-Meier survival curve and expression correlations analysis for the 13 prognostic feature genes. (A) The survival curve of the two clusters. (B) The lower-left part is the scatter plot of the gene expression levels. The red to blue color in the upper-right part represent correlation coefficients ranging from −1 to +1, respectively. The diagonal line represents the expression distribution histogram of each gene. Asterisks indicate a correlation coefficient ≥0.45.
Figure 4.
Figure 4.
Multivariate survival analysis for the 13 prognostic feature genes in the 70 primary GBM samples in GSE7696. (A) The AUC of multivariate survival analysis. (B) The Kaplan-Meier survival curve. AUC, area under the Receiver Operating Characteristic curve.
Figure 5.
Figure 5.
Multivariate survival analysis for the prognostic feature genes in the 152 primary GBM samples in TCGA (validation data set). (A) The AUC multivariate survival analysis. (B) The Kaplan-Meier survival curve. AUC, area under the Receiver Operating Characteristic curve.

Similar articles

Cited by

References

    1. Bleeker FE, Molenaar RJ, Leenstra S. Recent advances in the molecular understanding of glioblastoma. J Neurooncol. 2012;108:11–27. doi: 10.1007/s11060-011-0793-0. - DOI - PMC - PubMed
    1. Young RM, Jamshidi A, Davis G, Sherman JH. Current trends in the surgical management and treatment of adult glioblastoma. Ann Transl Med. 2015;3:121. - PMC - PubMed
    1. McGuire S. World Cancer Report 2014. Geneva, Switzerland: World Health Organization, International Agency for Research on Cancer, WHO Press, 2015. Adv Nutr. 2016;7:418–419. doi: 10.3945/an.116.012211. - DOI - PMC - PubMed
    1. Gallego O. Nonsurgical treatment of recurrent glioblastoma. Curr Oncol. 2015;22:e273–e281. doi: 10.3747/co.22.2436. - DOI - PMC - PubMed
    1. Fulci G, Chiocca EA. The status of gene therapy for brain tumors. Expert Opin Biol Ther. 2007;7:197–208. doi: 10.1517/14712598.7.2.197. - DOI - PMC - PubMed