

Automated Fluorescence Lifetime Imaging High-Content Analysis of Förster Resonance Energy Transfer between Endogenously Labeled Kinetochore Proteins in Live Budding Yeast Cells
- PMID: 30629461
- PMCID: PMC6537140
- DOI: 10.1177/2472630318819240
Automated Fluorescence Lifetime Imaging High-Content Analysis of Förster Resonance Energy Transfer between Endogenously Labeled Kinetochore Proteins in Live Budding Yeast Cells
Abstract
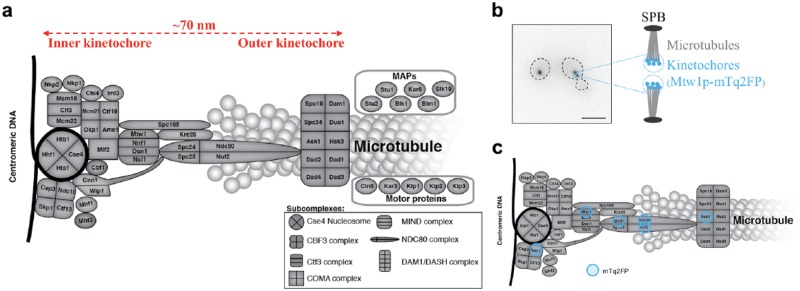
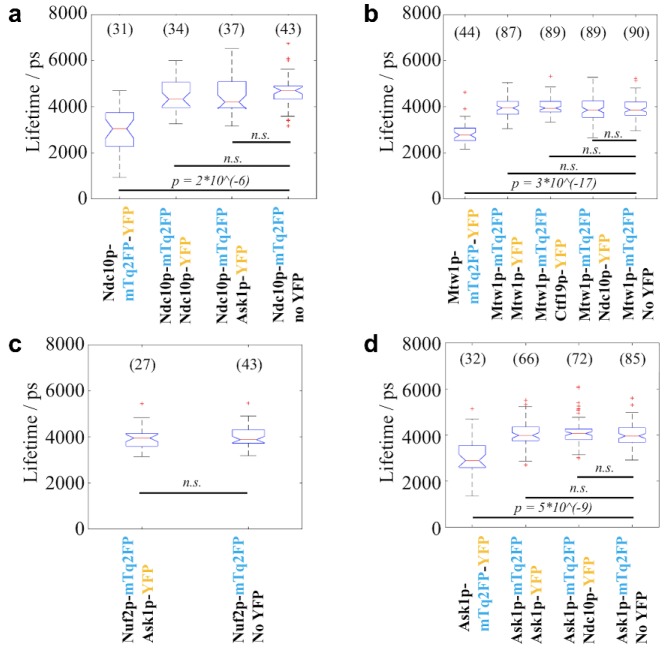
We describe an open-source automated multiwell plate fluorescence lifetime imaging (FLIM) methodology to read out Förster resonance energy transfer (FRET) between fluorescent proteins (FPs) labeling endogenous kinetochore proteins (KPs) in live budding yeast cells. The low copy number of many KPs and their small spatial extent present significant challenges for the quantification of donor fluorescence lifetime in the presence of significant cellular autofluorescence and photobleaching. Automated FLIM data acquisition was controlled by µManager and incorporated wide-field time-gated imaging with optical sectioning to reduce background fluorescence. For data analysis, we used custom MATLAB-based software tools to perform kinetochore foci segmentation and local cellular background subtraction and fitted the fluorescence lifetime data using the open-source FLIMfit software. We validated the methodology using endogenous KPs labeled with mTurquoise2 FP and/or yellow FP and measured the donor fluorescence lifetimes for foci comprising 32 kinetochores with KP copy numbers as low as ~2 per kinetochore under an average labeling efficiency of 50%. We observed changes of median donor lifetime ≥250 ps for KPs known to form dimers. Thus, this FLIM high-content analysis platform enables the screening of relatively low-copy-number endogenous protein-protein interactions at spatially confined macromolecular complexes.
Keywords: FRET; budding yeast; fluorescence lifetime imaging; high-content analysis; kinetochore protein interactions.
Conflict of interest statement
Figures


Similar articles
-
Automated High-Throughput Fluorescence Lifetime Imaging Microscopy to Detect Protein-Protein Interactions.J Lab Autom. 2016 Apr;21(2):238-45. doi: 10.1177/2211068215606048. Epub 2015 Sep 17. J Lab Autom. 2016. PMID: 26384400
-
Screening for protein-protein interactions using Förster resonance energy transfer (FRET) and fluorescence lifetime imaging microscopy (FLIM).Sci Rep. 2016 Jun 24;6:28186. doi: 10.1038/srep28186. Sci Rep. 2016. PMID: 27339025 Free PMC article.
-
High-Throughput Microscopy-Based Screening in Saccharomyces cerevisiae.Cold Spring Harb Protoc. 2016 Apr 1;2016(4):pdb.top087593. doi: 10.1101/pdb.top087593. Cold Spring Harb Protoc. 2016. PMID: 27037080
-
Fluorescence lifetime imaging--techniques and applications.J Microsc. 2012 Aug;247(2):119-36. doi: 10.1111/j.1365-2818.2012.03618.x. Epub 2012 May 24. J Microsc. 2012. PMID: 22621335 Review.
-
Quantitative Imaging of Genetically Encoded Fluorescence Lifetime Biosensors.Biosensors (Basel). 2023 Oct 19;13(10):939. doi: 10.3390/bios13100939. Biosensors (Basel). 2023. PMID: 37887132 Free PMC article. Review.
Cited by
-
FRET Microscopy in Yeast.Biosensors (Basel). 2019 Oct 11;9(4):122. doi: 10.3390/bios9040122. Biosensors (Basel). 2019. PMID: 31614546 Free PMC article. Review.
-
Fluorescence lifetime imaging microscopy: fundamentals and advances in instrumentation, analysis, and applications.J Biomed Opt. 2020 May;25(7):1-43. doi: 10.1117/1.JBO.25.7.071203. J Biomed Opt. 2020. PMID: 32406215 Free PMC article. Review.
References
-
- Zanella F., Lorens J. B., Link W. High Content Screening: Seeing Is Believing. Trends Biotechnol. 2010, 28, 237–245. - PubMed
-
- Bastiaens P. I., Squire A. Fluorescence Lifetime Imaging Microscopy: Spatial Resolution of Biochemical Processes in the Cell. Trends Cell Biol. 1999, 9, 48–52. - PubMed
-
- König K., Uchugonova A., Gorjup E. Multiphoton Fluorescence Lifetime Imaging of 3D-Stem Cell Spheroids during Differentiation. Microsc. Res. Tech. 2011, 74, 9–17. - PubMed
Publication types
MeSH terms
Substances
Grants and funding
- FC001003/MRC_/Medical Research Council/United Kingdom
- BB/E003621/1/BB_/Biotechnology and Biological Sciences Research Council/United Kingdom
- FC001003/CRUK_/Cancer Research UK/United Kingdom
- MC_UP_A252_1027/MRC_/Medical Research Council/United Kingdom
- BB/M006786/1/BB_/Biotechnology and Biological Sciences Research Council/United Kingdom
LinkOut - more resources
Full Text Sources
Molecular Biology Databases
Miscellaneous