

The sensation of groove is affected by the interaction of rhythmic and harmonic complexity
- PMID: 30629596
- PMCID: PMC6328141
- DOI: 10.1371/journal.pone.0204539
The sensation of groove is affected by the interaction of rhythmic and harmonic complexity
Abstract
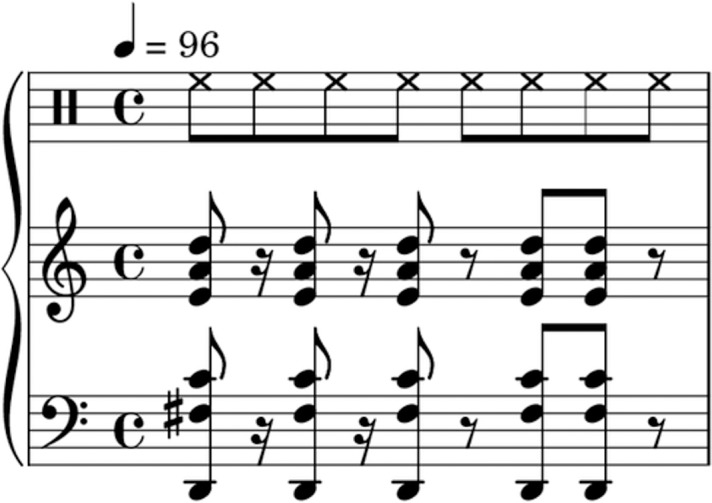
The pleasurable desire to move to music, also known as groove, is modulated by rhythmic complexity. How the sensation of groove is influenced by other musical features, such as the harmonic complexity of individual chords, is less clear. To address this, we asked people with a range of musical experience to rate stimuli that varied in both rhythmic and harmonic complexity. Rhythm showed an inverted U-shaped relationship with ratings of pleasure and wanting to move, whereas medium and low complexity chords were rated similarly. Pleasure mediated the effect of harmony on wanting to move and high complexity chords attenuated the effect of rhythm on pleasure. We suggest that while rhythmic complexity is the primary driver, harmony, by altering emotional valence, modulates the attentional and temporal prediction processes that underlie rhythm perception. Investigation of the effects of musical training with both regression and group comparison showed that training increased the inverted U effect for harmony and rhythm, respectively. Taken together, this work provides important new information about how the prediction and entrainment processes involved in rhythm perception interact with musical pleasure.
Conflict of interest statement
The authors have declared that no competing interests exist.
Figures


Similar articles
-
The pleasurable urge to move to music is unchanged in people with musical anhedonia.PLoS One. 2025 Jan 7;20(1):e0312030. doi: 10.1371/journal.pone.0312030. eCollection 2025. PLoS One. 2025. PMID: 39774498 Free PMC article.
-
Predictive coding in musical anhedonia: A study of groove.PLoS One. 2024 Apr 23;19(4):e0301478. doi: 10.1371/journal.pone.0301478. eCollection 2024. PLoS One. 2024. PMID: 38652721 Free PMC article.
-
Dopamine dysregulation in Parkinson's disease flattens the pleasurable urge to move to musical rhythms.Eur J Neurosci. 2024 Jan;59(1):101-118. doi: 10.1111/ejn.16128. Epub 2023 Sep 19. Eur J Neurosci. 2024. PMID: 37724707
-
A review of psychological and neuroscientific research on musical groove.Neurosci Biobehav Rev. 2024 Mar;158:105522. doi: 10.1016/j.neubiorev.2023.105522. Epub 2023 Dec 21. Neurosci Biobehav Rev. 2024. PMID: 38141692 Review.
-
Rhythmic complexity and predictive coding: a novel approach to modeling rhythm and meter perception in music.Front Psychol. 2014 Oct 1;5:1111. doi: 10.3389/fpsyg.2014.01111. eCollection 2014. Front Psychol. 2014. PMID: 25324813 Free PMC article. Review.
Cited by
-
The sweet spot between predictability and surprise: musical groove in brain, body, and social interactions.Front Psychol. 2022 Aug 9;13:906190. doi: 10.3389/fpsyg.2022.906190. eCollection 2022. Front Psychol. 2022. PMID: 36017431 Free PMC article.
-
Music predictability and liking enhance pupil dilation and promote motor learning in non-musicians.Sci Rep. 2019 Nov 19;9(1):17060. doi: 10.1038/s41598-019-53510-w. Sci Rep. 2019. PMID: 31745159 Free PMC article.
-
Elements of musical and dance sophistication predict musical groove perception.Front Psychol. 2022 Nov 17;13:998321. doi: 10.3389/fpsyg.2022.998321. eCollection 2022. Front Psychol. 2022. PMID: 36467160 Free PMC article.
-
Dancing through neurocognitive changes: dance/movement therapy supporting caregivers and people living with Alzheimer's and other dementias.Front Psychol. 2024 Dec 17;15:1504559. doi: 10.3389/fpsyg.2024.1504559. eCollection 2024. Front Psychol. 2024. PMID: 39742040 Free PMC article. No abstract available.
-
Music we move to: Spotify audio features and reasons for listening.PLoS One. 2022 Sep 29;17(9):e0275228. doi: 10.1371/journal.pone.0275228. eCollection 2022. PLoS One. 2022. PMID: 36174020 Free PMC article.
References
-
- Witek MAG. Groove experience: Emotional and physiological responses to groove-based music. In: Proceedings of the 7th Triennial Conference of European Society for the Cognitive Sciences of Music (ESCOM 2009) Jyväskylä, Finland. 2009. p. 573–82.
-
- Lahdelma I, Eerola T. Single chords convey distinct emotional qualities to both naive and expert listeners. Psychol Music. 2014; 44(1): 37–54.
Publication types
MeSH terms
LinkOut - more resources
Full Text Sources
