. 2019 Jan 10;14(1):e0210550.
doi: 10.1371/journal.pone.0210550. eCollection 2019.

Phylogeographic analysis of human influenza A and B viruses in Myanmar, 2010-2015

Affiliations

Phylogeographic analysis of human influenza A and B viruses in Myanmar, 2010-2015

Khin Thu Zar Htwe et al. PLoS One. .

Abstract

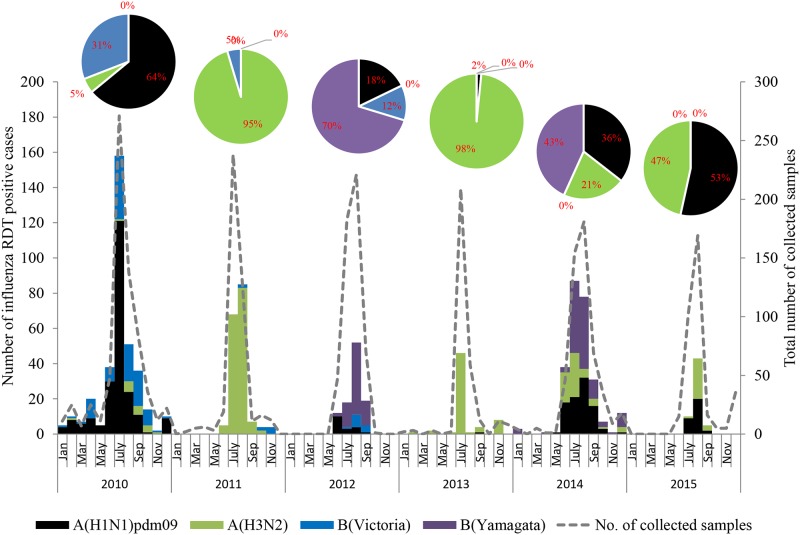
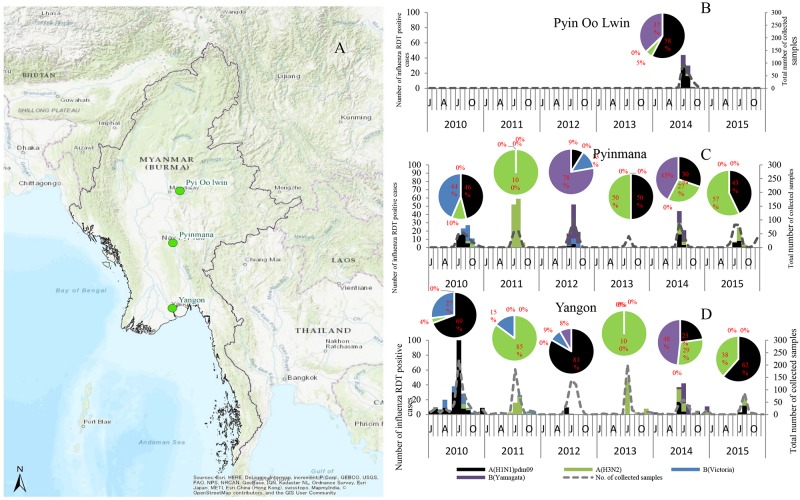
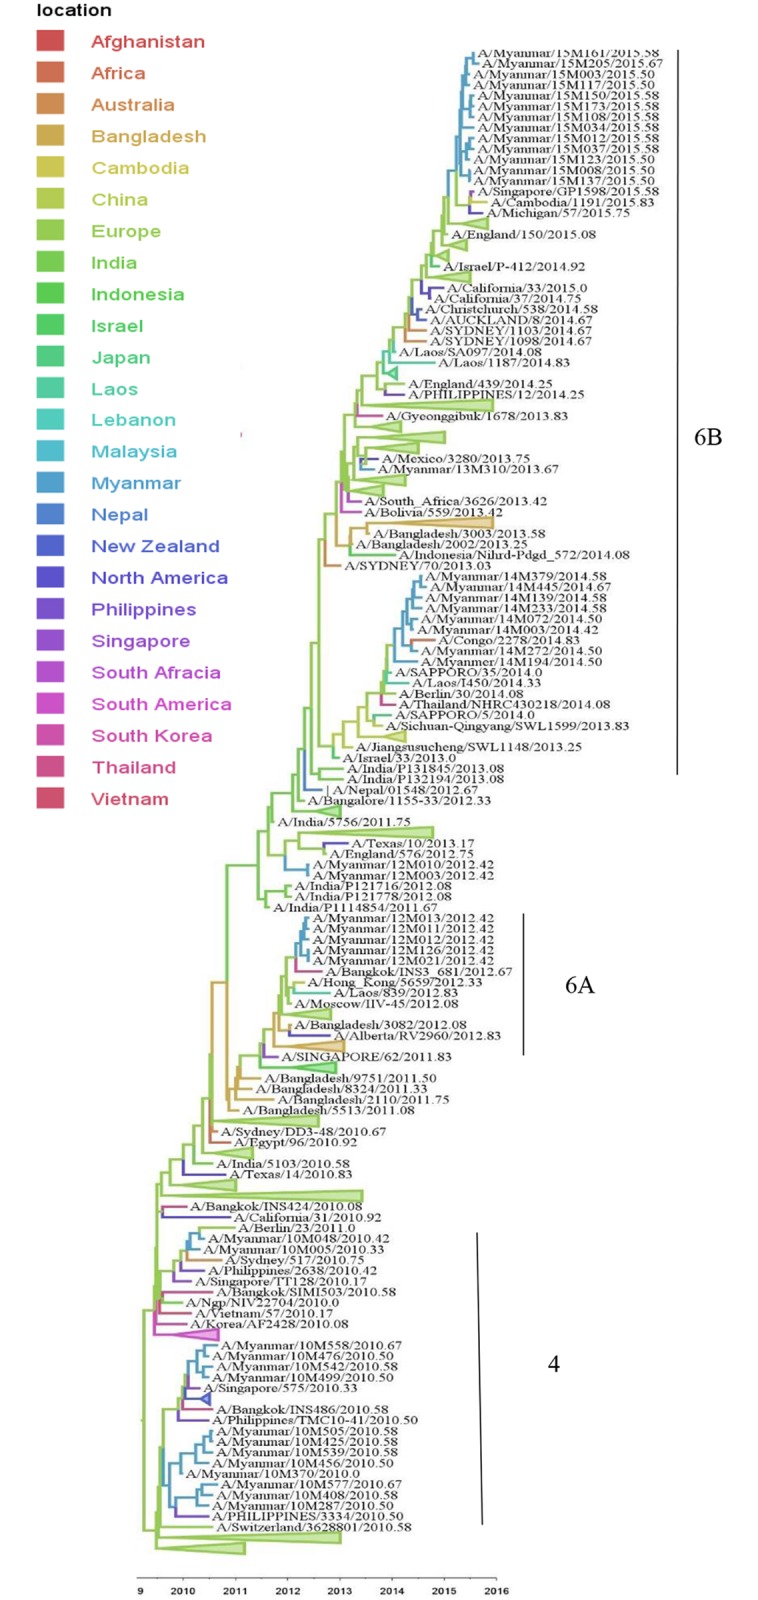
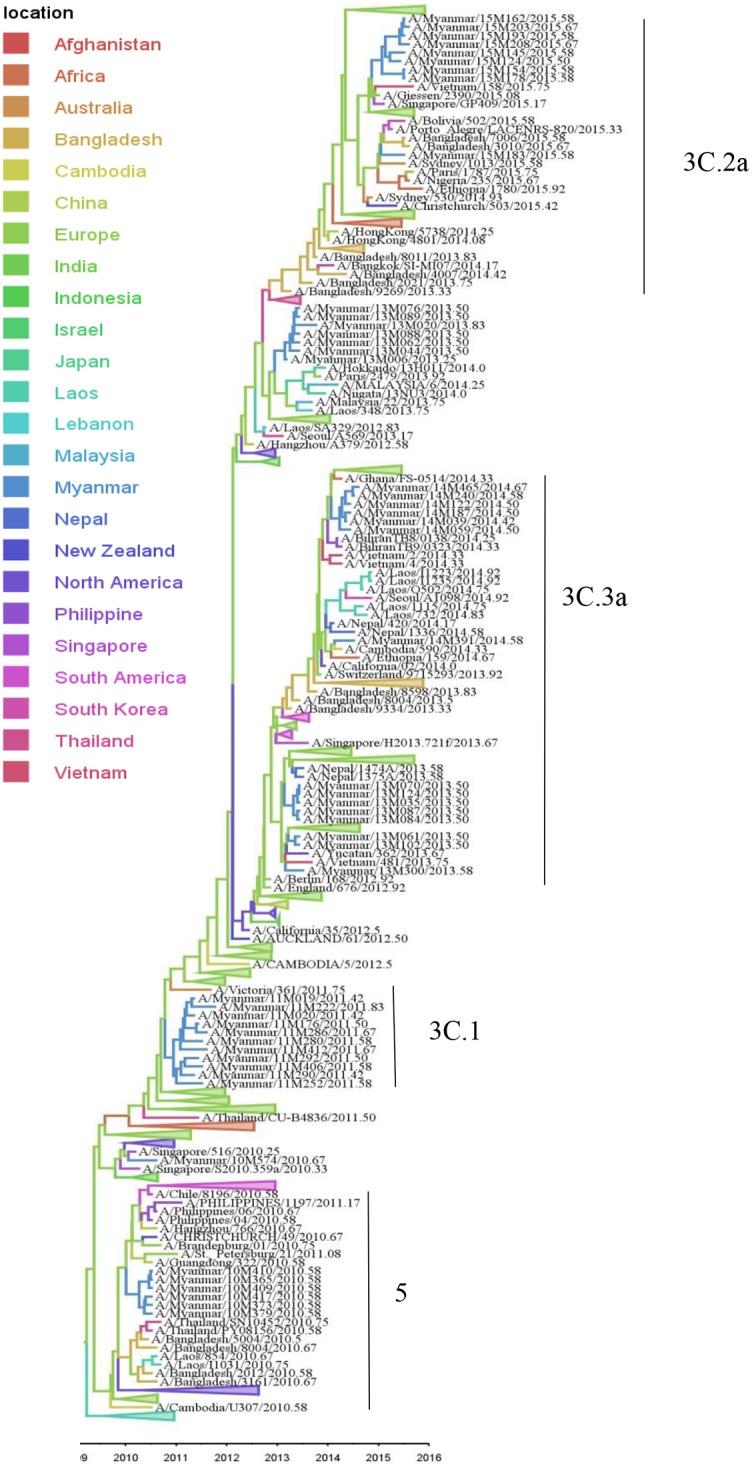
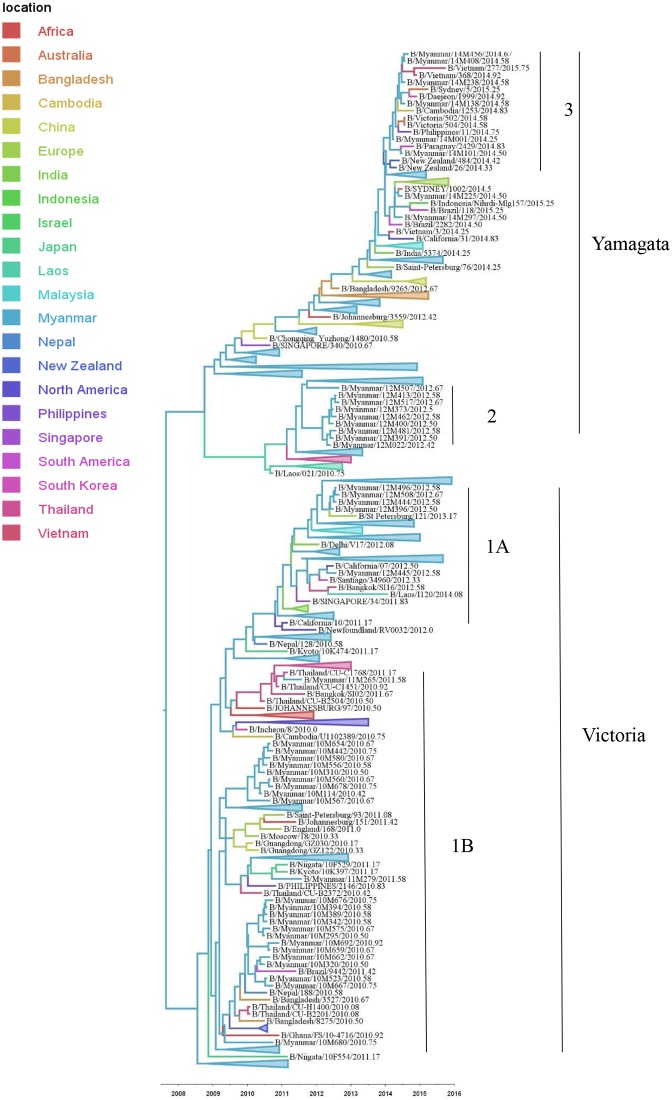
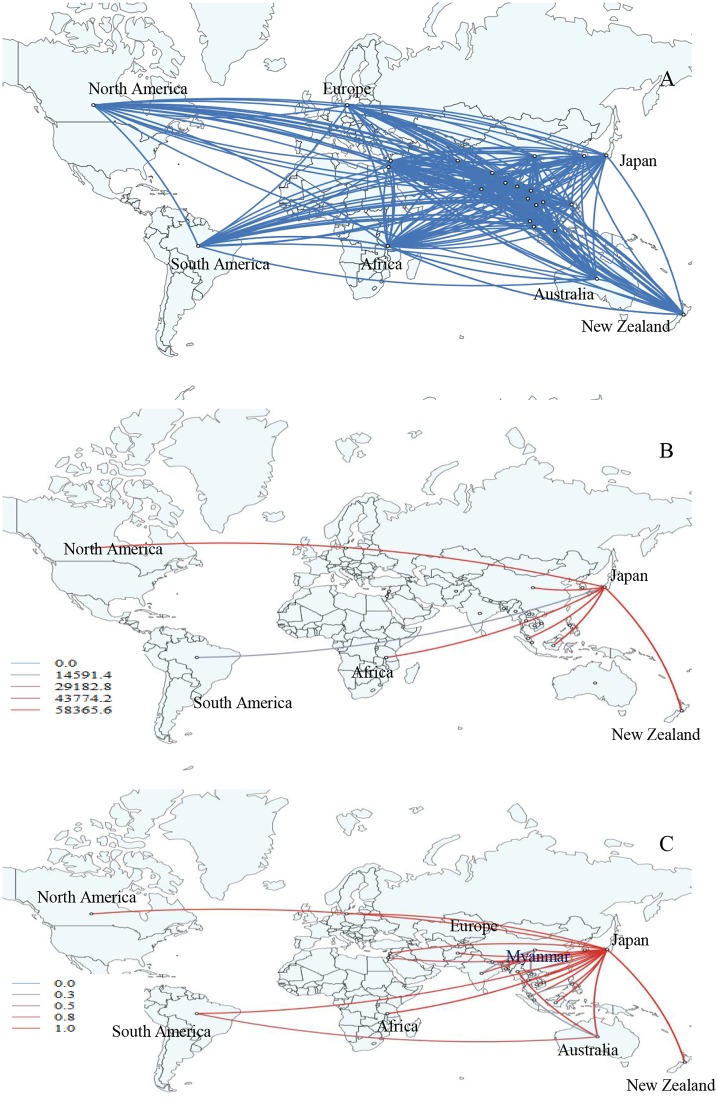
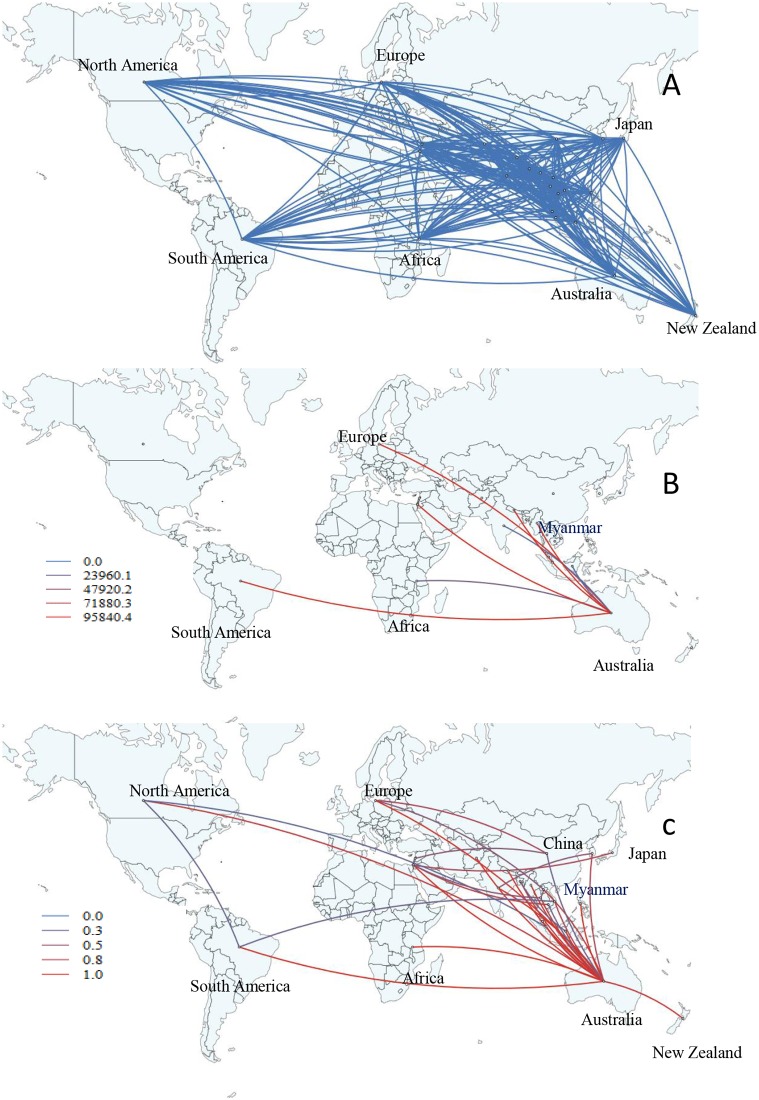
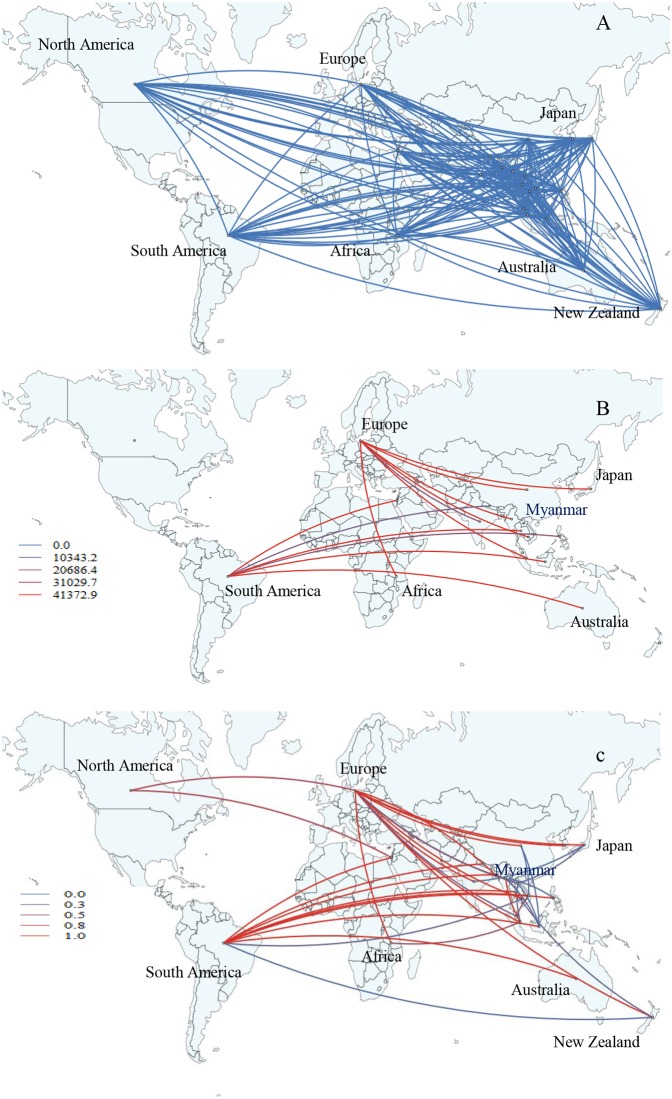
We investigated the circulation patterns of human influenza A and B viruses in Myanmar between 2010 and 2015 by analyzing full HA genes. Upper respiratory tract specimens were collected from patients with symptoms of influenza-like illness. A total of 2,860 respiratory samples were screened by influenza rapid diagnostic test, of which 1,577 (55.1%) and 810 (28.3%) were positive for influenza A and B, respectively. Of the 1,010 specimens that were positive for virus isolation, 370 (36.6%) were A(H1N1)pdm09, 327 (32.4%) were A(H3N2), 130 (12.9%) B(Victoria), and 183 (18.1%) were B(Yamagata) viruses. Our data showed that influenza epidemics mainly occurred during the rainy season in Myanmar. Our three study sites, Yangon, Pyinmana, and Pyin Oo Lwin had similar seasonality and circulating type and subtype of influenza in a given year. Moreover, viruses circulating in Myanmar during the study period were closely related genetically to those detected in Thailand, India, and China. Phylogeographic analysis showed that A(H1N1)pdm09 viruses in Myanmar originated from Europe and migrated to other countries via Japan. Similarly, A(H3N2) viruses in Myanmar originated from Europe, and disseminated to the various countries via Australia. In addition, Myanmar plays a key role in reseeding of influenza B viruses to Southeast Asia and East Asia as well as Europe and Africa. Thus, we concluded that influenza virus in Myanmar has a strong link to neighboring Asian countries, Europe and Oceania.


Conflict of interest statement

The authors have declared that no competing interests exist.

Figures

Fig 1
Fig 1. The monthly incidence of influenza A(H1N1)pdm09, A(H3N2), B(Victoria) and B(Yamagata) viruses between 2010 and 2015 in Myanmar.
The number of influenza RDT positive cases is shown as a dashed line. Influenza A(H1N1)pdm09 is shown as black bar; A(H3N2), green bar; B(Victoria), blue bar; B(Yamagata), purple bar. The percentage of influenza A subtypes and B lineages for each year are shown in pie chart.
Fig 2
Fig 2. The location of sample collection sites and monthly distribution of influenza isolates according to study sites between 2010 and 2015 in Myanmar.
(A) The map of Myanmar showing three study sites, Yangon, Pyinmana and Pyin Oo Lwin. Monthly distribution of influenza for three locations, (B) Pyin Oo Lwin, (C) Pyinmana and (D) Yangon. The number of influenza RDT positive cases is shown in dashed line. Influenza A(H1N1)pdm09 is shown as black bar; A(H3N2), green bar; B(Victoria), blue bar; B(Yamagata), purple bar. The percentage of influenza A subtype and B lineage in each year is shown in pie chart. This map is designed to be used as a base map by GIS professionals and as a reference map by anyone. The map includes administrative boundaries, cities, water features, physiographic features, parks, landmarks, highways, roads, railways, and airports overlaid on land cover and shaded relief imagery for added context. Sources: Esri, HERE, Garmin, Intermap, increment P Corp., GEBCO, USGS, FAO, NPS, NRCAN, GeoBase, IGN, Kadaster NL, Ordnance Survey, Esri Japan, METI, Esri China (Hong Kong), swisstopo, OpenStreetMap contributors, and the GIS User Community.
Fig 3
Fig 3. Bayesian evolutionary tree of influenza A(H1N1)pdm09 based on the nucleotide sequence of the HA gene.
The maximum clade credibility tree was inferred from 404 HA gene sequences including 43 A(H1N1)pdm09 sequences from Myanmar. The branches are in time scale in years and are colored according to the location of the most probable ancestor of descendant nodes. This Bayesian tree was generated using a molecular clock discrete phylogeographic approach as implemented in the BEAST software. Labels on the right of the figure indicate the genetic clades according to WHO classification. Branches that do not include Myanmar sequences were collapsed as triangles.
Fig 4
Fig 4. Bayesian evolutionary tree of influenza A(H3N2) based on the nucleotide sequence of the HA gene.
The maximum clade credibility tree was inferred from 406 HA gene sequences including 50 A(H3N2) sequences from Myanmar. The branches are in time scale in years and are colored according to the location of the most probable ancestor of descendant nodes. This Bayesian tree was generated using a molecular clock discrete phylogeographic approach as implemented in the BEAST software. Labels on the right of the figure indicate the genetic clades according to WHO classification. Branches that do not include Myanmar strains were collapsed as triangles.
Fig 5
Fig 5. Bayesian evolutionary tree of influenza B based on the nucleotide sequence of the HA gene.
The maximum clade credibility tree was inferred from 388 HA gene sequences including 46 influenza B sequences from Myanmar. The branches are in time scale in years and are colored according to the location of the most probable ancestor of descendant nodes. This Bayesian tree was generated using a molecular clock discrete phylogeographic approach as implemented in the BEAST software. Labels on the right of the figure indicate the genetic clades according to WHO classification. Branches that do not include Myanmar strains were collapsed as triangles.
Fig 6
Fig 6. Global migration pathways of influenza A(H1N1)pdm09 viruses.
(A) Spread of influenza A(H1N1)pdm09 viruses from one location to another between 2010 and 2015. Blue lines indicate the connection between different locations, which represent branches in the MCC tree. (B) The color gradients (from blue to red) of the lines indicate the relative strength of connection between locations according to the Bayes Factor (BF) test. Only rates supported by a BF greater than 1000 are indicated. (C) The color gradients (from blue to red) of the lines indicate the posterior probability of viral migration among locations. Lines were displayed when the posterior probability values were above 0.3.
Fig 7
Fig 7. Global migration pathways of influenza A(H3N2) viruses.
(A) Spread of influenza A(H3N2) viruses from one location to another between 2010 and 2015. Blue lines indicate the connection between different locations, which represent branches in the MCC tree. (B) The color gradients (from blue to red) of the lines indicate the relative strength of connection between locations according to the Bayes Factor (BF) test. Only rates supported by BF values greater than 1000 are indicated. (C) The color gradients (from blue to red) of the lines indicate the posterior probability of viral migration among locations. Lines were displayed when the posterior probability values were above 0.3.
Fig 8
Fig 8. Global migration pathways of influenza B viruses.
(A) Spread of influenza B viruses from one location to another between 2010 and 2015. Blue lines indicate the connection between different locations, which represent branches in the MCC tree. (B) The color gradients (from blue to red) of the lines indicate the relative strength of connection between locations according to the Bayes Factor (BF) test. Only rates supported by BF values greater than 1000 are indicated. (C) The color gradients (from blue to red) of the lines indicate the posterior probability of viral migration among locations. Lines were displayed when the posterior probability values were above 0.3.

References

    1. de Mattos Silva Oliveira TF, Yokosawa J, Motta FC, Siqueira MM, da Silveira HL, Queiroz DA. Molecular characterization of influenza viruses collected from young children in Uberlandia, Brazil—from 2001 to 2010. BMC Infect Dis. 2015;15:71 10.1186/s12879-015-0817-z - DOI - PMC - PubMed
    1. Cox N, Subbarao K. Global epidemiology of influenza: past and present. Annual review of medicine. 2000;51(1):407–21. - PubMed
    1. Organization WH. Manual for the laboratory diagnosis and virological surveillance of influenza. 2011.
    1. Russell CA, Jones TC, Barr IG, Cox NJ, Garten RJ, Gregory V, et al. The global circulation of seasonal influenza A (H3N2) viruses. Science. 2008;320(5874):340–6. 10.1126/science.1154137 - DOI - PubMed
    1. Dapat C, Saito R, Kyaw Y, Naito M, Hasegawa G, Suzuki Y, et al. Epidemiology of human influenza A and B viruses in Myanmar from 2005 to 2007. Intervirology. 2009;52(6):310–20. Epub 2009/09/25. 10.1159/000237738 - DOI - PubMed

Publication types

MeSH terms