. 2019 Jan 9;25(1):59-72.e8.
doi: 10.1016/j.chom.2018.12.001.

HIV-1 Neutralizing Antibody Signatures and Application to Epitope-Targeted Vaccine Design

Affiliations

HIV-1 Neutralizing Antibody Signatures and Application to Epitope-Targeted Vaccine Design

Christine A Bricault et al. Cell Host Microbe. .

Erratum in

  • HIV-1 Neutralizing Antibody Signatures and Application to Epitope-Targeted Vaccine Design.
    Bricault CA, Yusim K, Seaman MS, Yoon H, Theiler J, Giorgi EE, Wagh K, Theiler M, Hraber P, Macke JP, Kreider EF, Learn GH, Hahn BH, Scheid JF, Kovacs JM, Shields JL, Lavine CL, Ghantous F, Rist M, Bayne MG, Neubauer GH, McMahan K, Peng H, Chéneau C, Jones JJ, Zeng J, Ochsenbauer C, Nkolola JP, Stephenson KE, Chen B, Gnanakaran S, Bonsignori M, Williams LD, Haynes BF, Doria-Rose N, Mascola JR, Montefiori DC, Barouch DH, Korber B. Bricault CA, et al. Cell Host Microbe. 2019 Aug 14;26(2):296. doi: 10.1016/j.chom.2019.07.016. Cell Host Microbe. 2019. PMID: 31415756 Free PMC article. No abstract available.

Abstract

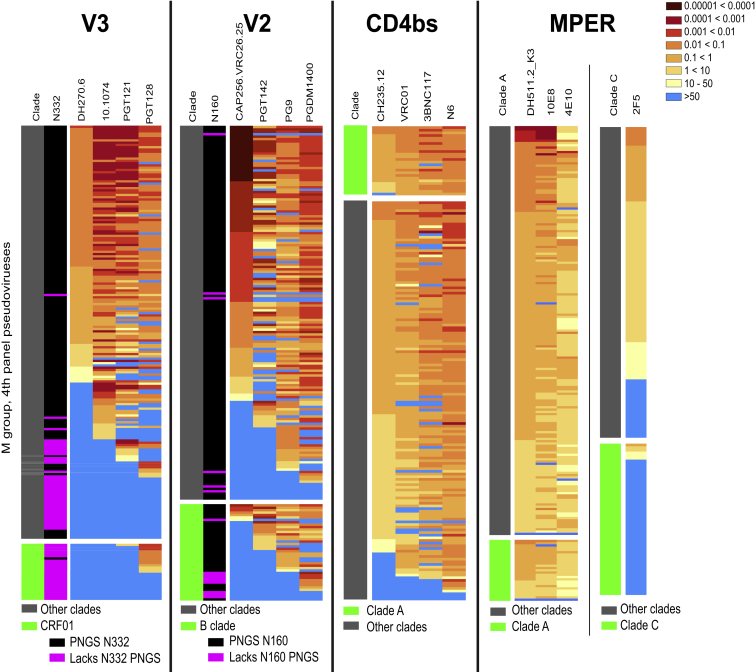
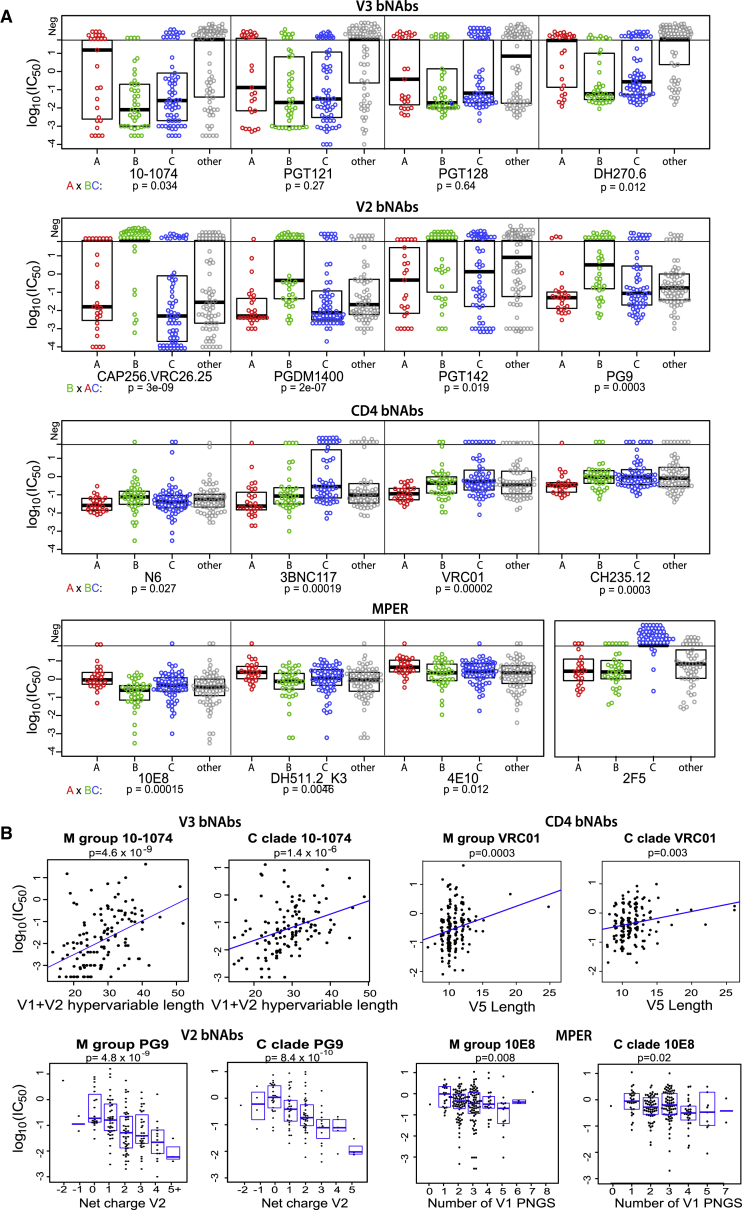
Eliciting HIV-1-specific broadly neutralizing antibodies (bNAbs) remains a challenge for vaccine development, and the potential of passively delivered bNAbs for prophylaxis and therapeutics is being explored. We used neutralization data from four large virus panels to comprehensively map viral signatures associated with bNAb sensitivity, including amino acids, hypervariable region characteristics, and clade effects across four different classes of bNAbs. The bNAb signatures defined for the variable loop 2 (V2) epitope region of HIV-1 Env were then employed to inform immunogen design in a proof-of-concept exploration of signature-based epitope targeted (SET) vaccines. V2 bNAb signature-guided mutations were introduced into Env 459C to create a trivalent vaccine, and immunization of guinea pigs with V2-SET vaccines resulted in increased breadth of NAb responses compared with Env 459C alone. These data demonstrate that bNAb signatures can be utilized to engineer HIV-1 Env vaccine immunogens capable of eliciting antibody responses with greater neutralization breadth.

Keywords: HIV-1; V2-apex antibodies; broadly neutralizing antibodies; hypervariable regions; machine learning; signature analysis; vaccine design.


Figures

None
Graphical abstract
Figure 1
Figure 1
Heatmaps Showing IC50 Neutralization Titers for Dataset 4 Darker red hues indicate more potent neutralization and blue indicates undetected responses. Rows represent pseudoviruses, ordered differently in each panel to highlight commonalities in neutralization profiles across bNAbs in each class. The clade with the strongest clade effect is separated and indicated in green to the left. Key PNGSs are indicated by magenta. Among MPER bNAbs 2F5 is considered separately as it has a unique epitope.
Figure 2
Figure 2
Env Characteristics Associated with bNAb Class Sensitivity (A) Clade associations. Circles illustrate IC50 titers from dataset 4, highlighting the 3 best represented clades: A in red, B in green, and C and CRF07 (which is clade C in Env) in blue. All others are gray. Boxplots show medians and quartiles. Patterns of relative clade sensitivity are consistent across bNAb classes. The p values are based on two-sided Wilcoxon tests comparing the most distinctive clade among A, B, and C to the other two clades. Points above the horizontal line were above the threshold of detection. The bolus of negative points in the “other” group for V3 bNAbs is primarily CRF01. (B) Examples of hypervariable loop characteristic correlations with bNAb sensitivity, including one for each bNAb class (complete associations are in Tables S3N–S3Q). M-group and clade C data are from datasets 4 and 3, respectively. The p values are based on Kendall’s tau.
Figure 3
Figure 3
Sequence LOGOs of AA Signatures by Antibody Class This figure highlights the more robust signature sites in that they were supported by multiple lines of evidence—they either had phylogenetically corrected associations supported by at least 2 datasets, were a signature site in a contact residue, or both. Not all bNAbs in a class are associated with every signature. Complete lists with detailed statistics are provided in Table S3. Letter height represents AA frequencies in dataset 4. “O” represents an Asn in a PNGS motif. AAs associated with resistance and sensitivity are red and blue, respectively. AAs shown in green differ for different bNAbs within the class. (A) V3 bNAbs, (B) V2, (C) VH1-2 and VH1-46 CD4bs, and (D) MPER, with 10E8/4E10/DH511 on the left, 2F5 on the right, and red HXB2 position numbers highlighting opposing signatures between the two.
Figure 4
Figure 4
Random Forest Signature-Based Prediction Accuracy Leave-one-out cross-validation regression predictions using dataset 4 for one bNAb from each bNAb class. R2 is the standard coefficient of determination; the p value is from Kendall’s tau. The red line marks the threshold of detection. R2 values remained significant when negative points were excluded: PG9, R2 = 0.35, p = 4 × 10−14; 10–1074, R2 = 0.27, p = 2 × 10−9; 3BNC117, R2 = 0.30, p = 3 × 10−9; and 10E8, R2 = 0.12, p = 9 × 10−7.
Figure 5
Figure 5
V2-SET Vaccine Design and Production (A and B) Structural mapping (PDB: 5FYJ) of mutations introduced into 459C WT (Table S7) to create (A) Opt and (B) Alt V2-SET vaccine constructs. Spheres are color-coded to indicate AA modifications associated with sensitivity or resistance. Opt constructs uniformly carry sensitivity signatures. Alt constructs carry mutations that enhance sensitivity outside the core epitope, but in the epitope introduce signature mutations complementary to 459C WT and Opt to capture epitope diversity. (C) Gel filtration chromatography traces of gp140 V2-SET immunogens run on a Superose 6 column (foldon) or Superdex 200 column (SOSIP). Coomassie stained SDS-PAGE of purified Envs are next to each trace with molecular weight standards noted. (D) Guinea pig vaccination regimens. Animals were vaccinated intramuscularly in the quadriceps with 100 μg total immunogen at weeks 0, 4, and 8; n is the group size.
Figure 6
Figure 6
V2-SET Vaccines Improve the Breadth and the Magnitude of Tier 2 NAbs Compared to BG505 and 459C WT (A–D) Heatmaps of neutralizing responses comparing groups of guinea pigs vaccinated with 459C WT, V2-SET, and BG505 vaccines. Monovalent vaccines: (A) BG505 and 459C WT SOSIP and (B) 459C WT gp140 foldon. Trivalent vaccines: (C) V2-SET SOSIP and (D) gp140 foldon vaccines delivered as either a mixture or prime boost. Columns represent tier 2 pseudoviruses (see key), ordered by sensitivity. Rows represent guinea pigs, organized by vaccine group. The potency of ID50 responses increases from yellow to dark red, below threshold responses are blue. To compare the breadth of response between different vaccine regimens, the median number of detectable responses is reported for each vaccination regimen to the right of the heatmaps, and detectible responses per animal were compared by a two-sided Wilcoxon test. BG505 and 459C WT SOSIP vaccines were comparable (p = 0.13), and V2-SET SOSIP vaccine responses were broader than either BG505 (p = 0.02) or 459C WT (p = 0.01). Responses elicited by the V2-SET foldon vaccine were broader than responses elicited by the 459C WT foldon vaccine (p = 0.006). (E and F) Magnitudes of tier 2 NAb responses to SOSIP and foldon vaccine groups, respectively. Responses that were at least 10 above the background are considered positive and are shown; the dotted line at an ID50 titer of 100 is added for visual emphasis. Colors represent the vaccine groups (see key). Horizontal black lines are the median response to each pseudovirus. Response magnitudes were compared with a nonparametric permutation test (STAR Methods). For SOSIP vaccines, there was no statistical difference in potency between BG505 and 459C WT vaccine groups (p = 0.06), but V2-SET responses were more potent than both BG505 (p = 0.007) and 459C WT (p = 0.008). For gp140 foldon delivery, V2-SET responses were more potent than 459C WT (p = 0.002).
Figure 7
Figure 7
Mapping of Antibody Responses Elicited by V2-SET Vaccine (A) Magnitude and position of binding antibody responses from guinea pig sera to linear 15-mer peptides on peptide microarrays from each gp140 foldon vaccine group. Each dot represents an average MFI (mean fluorescence intensity) per peptide that is positive for antibody binding within each vaccination group, standard deviation shown. Env regions are delineated by vertical lines, the V3 loop highlighted in red. Statistical differences for binding responses to peptides with starting positions in V3 as compared to 459C WT are shown. The p values are based on a Wilcoxon one-sided test; NS means not significant. (B) Neutralizing titers against select pseudoviruses with a N160-dependent enhancement of V2-SET responses over 459C WT. ID50 titers in guinea pigs vaccinated with 459C WT and V2-SET vaccines against the native pseudoviruses are shown by dots, and against the N160 glycan deletion mutant (T162I) pseudoviruses by squares. Colors represent the particular gp140 foldon vaccination regimen: black is 459C WT, red is V2-SET mixture, and blue is V2-SET prime/boost. The top plots show ID50 titers for each guinea pig. The dotted line at 20 marks the limit of detection. The bottom plots show the geometric means of the NAb titers from the top plot (over the animals vaccinated by the same vaccine and tested on the same pseudovirus as in the top plot), normalized to 459C WT. The p values from Wilcoxon pairwise comparisons are shown in red. NS, not significant.

References

    1. Arlot S., Celisse A. A survey of cross-validation procedures for model selection. Statist. Surv. 2010;4:40–79.
    1. Behrens A.J., Vasiljevic S., Pritchard L.K., Harvey D.J., Andev R.S., Krumm S.A., Struwe W.B., Cupo A., Kumar A., Zitzmann N. Composition and antigenic effects of individual glycan sites of a trimeric HIV-1 envelope glycoprotein. Cell Rep. 2016;14:2695–2706. - PMC - PubMed
    1. Bhattacharya T., Daniels M., Heckerman D., Foley B., Frahm N., Kadie C., Carlson J., Yusim K., McMahon B., Gaschen B. Founder effects in the assessment of HIV polymorphisms and HLA allele associations. Science. 2007;315:1583–1586. - PubMed
    1. Bonsignori M., Hwang K.K., Chen X., Tsao C.Y., Morris L., Gray E., Marshall D.J., Crump J.A., Kapiga S.H., Sam N.E. Analysis of a clonal lineage of HIV-1 envelope V2/V3 conformational epitope-specific broadly neutralizing antibodies and their inferred unmutated common ancestors. J. Virol. 2011;85:9998–10009. - PMC - PubMed
    1. Bonsignori M., Kreider E.F., Fera D., Meyerhoff R.R., Bradley T., Wiehe K., Alam S.M., Aussedat B., Walkowicz W.E., Hwang K.K. Staged induction of HIV-1 glycan-dependent broadly neutralizing antibodies. Sci. Transl. Med. 2017;9 - PMC - PubMed

Publication types

MeSH terms