

doi: 10.1016/j.cgh.2018.12.039.
Epub 2019 Jan 7.
HBV Genotype-Specific Levels of Hepatitis B Surface Antigen Improve HBV Phenotype Definition
Collaborators,
Affiliations
- PMID: 30630104
- PMCID: PMC6612468
- DOI: 10.1016/j.cgh.2018.12.039
Item in Clipboard
HBV Genotype-Specific Levels of Hepatitis B Surface Antigen Improve HBV Phenotype Definition
Clin Gastroenterol Hepatol.
2020 Jan.
Abstract
Controversies exist regarding the classification of the different clinical phases of chronic hepatitis B (CHB) because hepatitis B virus (HBV) DNA and alanine aminotransferase levels fluctuate over time.1,2 To improve the distinction of clinical phases and the associated spectrum of clinical outcome,3,4 hepatitis B surface antigen (HBsAg) levels may be of help.5-7 We hypothesize that HBV genotype specific HBsAg levels are needed for the identification of different clinical HBV disease phases.7.
Copyright © 2020 AGA Institute. Published by Elsevier Inc. All rights reserved.
Figures

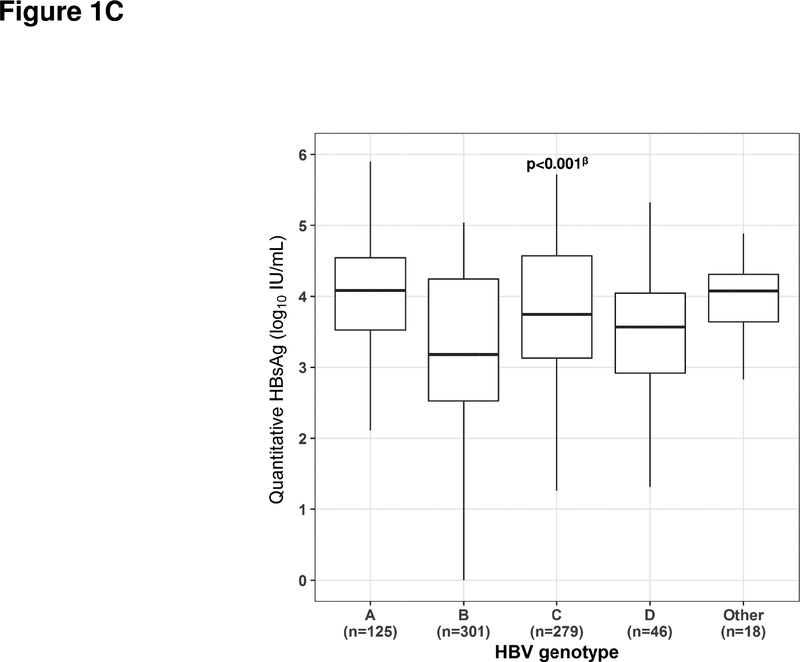
Study workflow (panel A), Log10 HBsAg according to HBV phenotype (panel B), HBV genotype (panel C), and HBsAg by HBV DNA levels and HBV genotypes (A-D), with phenotype indicated (panel D). In panel D, HBsAg levels are plotted against HBV DNA, and the different HBV genotypes are plotted together with the defined phenotypes (in color). The fitted lines were created with predicted values obtained from a linear model, including genotype A-D, log10 HBV DNA level, and quadratic log10 HBV DNA level. HBV genotype A/B/C/D frequencies by HBV phenotype (N): Immune tolerant (IT):0/17/26/0, HBeAg-positive CHB: 41/88/129/9, HBeAg-negative CHB:32/110/62/14, Inactive carrier (IC): 52/86/62/23 respectively. *Some participants met multiple exclusion criteria (N=425 unique participants, N=454 criteria met); **N=758 unique participants, N=823 exclusion criteria met. αp-value for pairwise comparisons between IT and HBeAg+ active: 0.51; p-value for pairwise comparisons between HBeAg+ active and HBeAg- active: <0.001; βp-value between HBeAg- active and Inactive carrier <0.001. βp-value for pairwise comparisons between genotype A and B: <0.001; genotype A and D: 0.003; genotype B and C: <0.001; other pairwise comparisons were not significant (p>0.05).

Study workflow (panel A), Log10 HBsAg according to HBV phenotype (panel B), HBV genotype (panel C), and HBsAg by HBV DNA levels and HBV genotypes (A-D), with phenotype indicated (panel D). In panel D, HBsAg levels are plotted against HBV DNA, and the different HBV genotypes are plotted together with the defined phenotypes (in color). The fitted lines were created with predicted values obtained from a linear model, including genotype A-D, log10 HBV DNA level, and quadratic log10 HBV DNA level. HBV genotype A/B/C/D frequencies by HBV phenotype (N): Immune tolerant (IT):0/17/26/0, HBeAg-positive CHB: 41/88/129/9, HBeAg-negative CHB:32/110/62/14, Inactive carrier (IC): 52/86/62/23 respectively. *Some participants met multiple exclusion criteria (N=425 unique participants, N=454 criteria met); **N=758 unique participants, N=823 exclusion criteria met. αp-value for pairwise comparisons between IT and HBeAg+ active: 0.51; p-value for pairwise comparisons between HBeAg+ active and HBeAg- active: <0.001; βp-value between HBeAg- active and Inactive carrier <0.001. βp-value for pairwise comparisons between genotype A and B: <0.001; genotype A and D: 0.003; genotype B and C: <0.001; other pairwise comparisons were not significant (p>0.05).
Study workflow (panel A), Log10 HBsAg according to HBV phenotype (panel B), HBV genotype (panel C), and HBsAg by HBV DNA levels and HBV genotypes (A-D), with phenotype indicated (panel D). In panel D, HBsAg levels are plotted against HBV DNA, and the different HBV genotypes are plotted together with the defined phenotypes (in color). The fitted lines were created with predicted values obtained from a linear model, including genotype A-D, log10 HBV DNA level, and quadratic log10 HBV DNA level. HBV genotype A/B/C/D frequencies by HBV phenotype (N): Immune tolerant (IT):0/17/26/0, HBeAg-positive CHB: 41/88/129/9, HBeAg-negative CHB:32/110/62/14, Inactive carrier (IC): 52/86/62/23 respectively. *Some participants met multiple exclusion criteria (N=425 unique participants, N=454 criteria met); **N=758 unique participants, N=823 exclusion criteria met. αp-value for pairwise comparisons between IT and HBeAg+ active: 0.51; p-value for pairwise comparisons between HBeAg+ active and HBeAg- active: <0.001; βp-value between HBeAg- active and Inactive carrier <0.001. βp-value for pairwise comparisons between genotype A and B: <0.001; genotype A and D: 0.003; genotype B and C: <0.001; other pairwise comparisons were not significant (p>0.05).

Study workflow (panel A), Log10 HBsAg according to HBV phenotype (panel B), HBV genotype (panel C), and HBsAg by HBV DNA levels and HBV genotypes (A-D), with phenotype indicated (panel D). In panel D, HBsAg levels are plotted against HBV DNA, and the different HBV genotypes are plotted together with the defined phenotypes (in color). The fitted lines were created with predicted values obtained from a linear model, including genotype A-D, log10 HBV DNA level, and quadratic log10 HBV DNA level. HBV genotype A/B/C/D frequencies by HBV phenotype (N): Immune tolerant (IT):0/17/26/0, HBeAg-positive CHB: 41/88/129/9, HBeAg-negative CHB:32/110/62/14, Inactive carrier (IC): 52/86/62/23 respectively. *Some participants met multiple exclusion criteria (N=425 unique participants, N=454 criteria met); **N=758 unique participants, N=823 exclusion criteria met. αp-value for pairwise comparisons between IT and HBeAg+ active: 0.51; p-value for pairwise comparisons between HBeAg+ active and HBeAg- active: <0.001; βp-value between HBeAg- active and Inactive carrier <0.001. βp-value for pairwise comparisons between genotype A and B: <0.001; genotype A and D: 0.003; genotype B and C: <0.001; other pairwise comparisons were not significant (p>0.05).
References
-
- Tseng TC, Liu CJ, Yang HC, et al. High levels of hepatitis B surface antigen increase risk of hepatocellular carcinoma in patients with low HBV load. Gastroenterology 2012;142:1140–1149 e3; quiz e13–4. - PubMed
-
- Tseng TC, Liu CJ, Yang HC, et al. Serum hepatitis B surface antigen levels help predict disease progression in patients with low hepatitis B virus loads. Hepatology 2013;57:441–50. - PubMed
-
- Nguyen T, Thompson AJV, Bowden S, et al. Hepatitis B surface antigen levels during the natural history of chronic hepatitis B: A perspective on Asia. Journal of Hepatology;52:508–513. - PubMed
Publication types
MeSH terms
Substances
Grants and funding
- UL1 TR001111/TR/NCATS NIH HHS/United States
- U01 DK082923/DK/NIDDK NIH HHS/United States
- UL1 TR000058/TR/NCATS NIH HHS/United States
- U01 DK082867/DK/NIDDK NIH HHS/United States
- U01 DK082874/DK/NIDDK NIH HHS/United States
- UL1 TR002240/TR/NCATS NIH HHS/United States
- UL1 RR024986/RR/NCRR NIH HHS/United States
- U01 DK082919/DK/NIDDK NIH HHS/United States
- U01 DK082927/DK/NIDDK NIH HHS/United States
- U01 DK082872/DK/NIDDK NIH HHS/United States
- U01 DK082943/DK/NIDDK NIH HHS/United States
- K24 AA022523/AA/NIAAA NIH HHS/United States
- P30 DK050306/DK/NIDDK NIH HHS/United States
- M01 RR000040/RR/NCRR NIH HHS/United States
- U01 DK082871/DK/NIDDK NIH HHS/United States
- U01 DK082944/DK/NIDDK NIH HHS/United States
- U01 DK082864/DK/NIDDK NIH HHS/United States
- U01 DK082843/DK/NIDDK NIH HHS/United States
- U01 DK082863/DK/NIDDK NIH HHS/United States
- N01 DK092324/LM/NLM NIH HHS/United States
- UL1 TR000004/TR/NCATS NIH HHS/United States
- U01 DK082866/DK/NIDDK NIH HHS/United States
LinkOut - more resources
Full Text Sources
