. 2019 Mar 1;27(2):134-144.
doi: 10.4062/biomolther.2018.175.

Integrative Omics Reveals Metabolic and Transcriptomic Alteration of Nonalcoholic Fatty Liver Disease in Catalase Knockout Mice

Affiliations

Integrative Omics Reveals Metabolic and Transcriptomic Alteration of Nonalcoholic Fatty Liver Disease in Catalase Knockout Mice

Jinhyuk Na et al. Biomol Ther (Seoul). .

Abstract

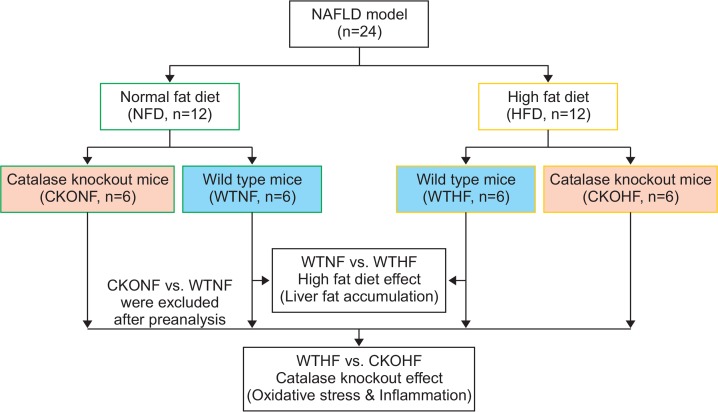
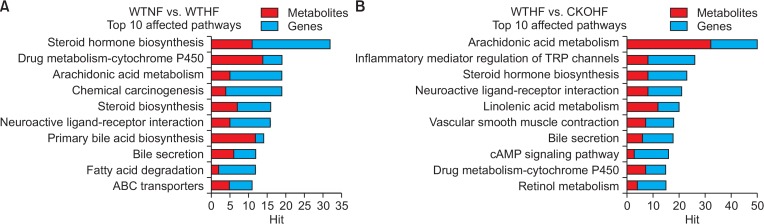
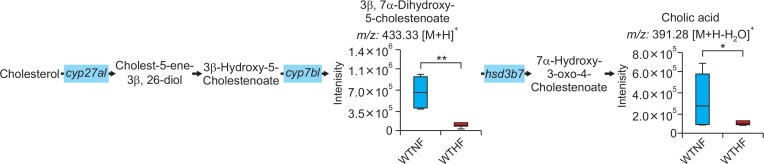
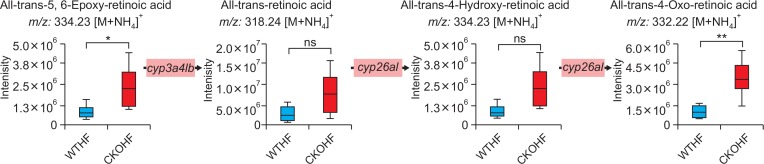
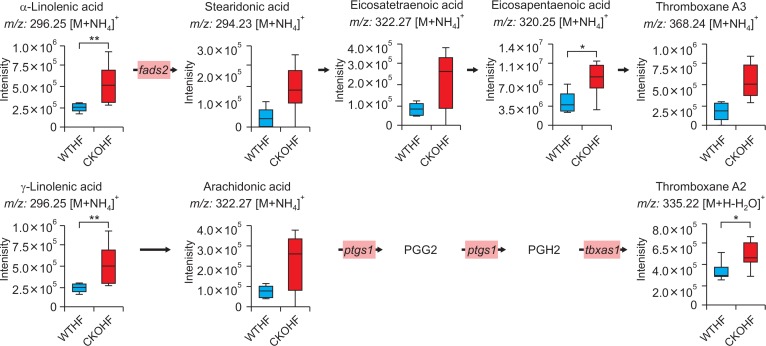
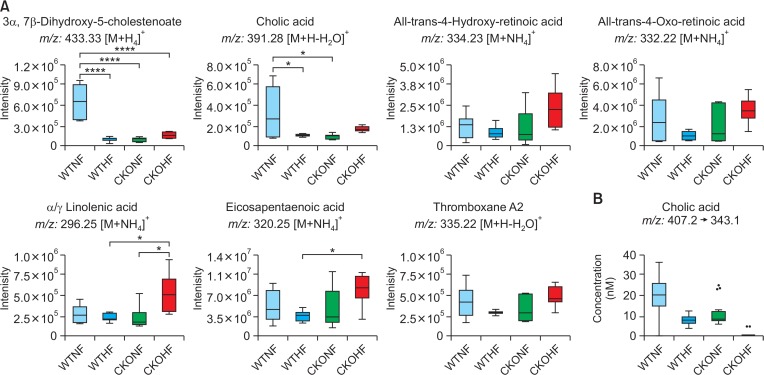
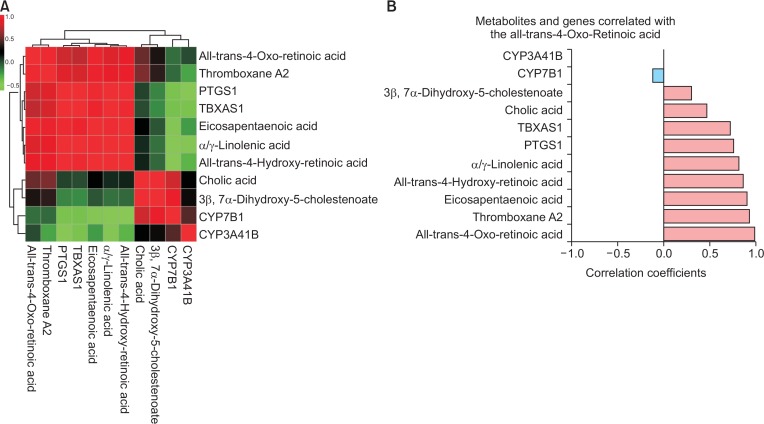
The prevalence of nonalcoholic fatty liver disease (NAFLD) has increased with the incidence of obesity; however, the underlying mechanisms are unknown. In this study, high-resolution metabolomics (HRM) along with transcriptomics were applied on animal models to draw a mechanistic insight of NAFLD. Wild type (WT) and catalase knockout (CKO) mice were fed with normal fat diet (NFD) or high fat diet (HFD) to identify the changes in metabolic and transcriptomic profiles caused by catalase gene deletion in correspondence with HFD. Integrated omics analysis revealed that cholic acid and 3β, 7α-dihydroxy-5-cholestenoate along with cyp7b1 gene involved in primary bile acid biosynthesis were strongly affected by HFD. The analysis also showed that CKO significantly changed all-trans-5,6-epoxy-retinoic acid or all-trans-4-hydroxy-retinoic acid and all-trans-4-oxo-retinoic acid along with cyp3a41b gene in retinol metabolism, and α/γ-linolenic acid, eicosapentaenoic acid and thromboxane A2 along with ptgs1 and tbxas1 genes in linolenic acid metabolism. Our results suggest that dysregulated primary bile acid biosynthesis may contribute to liver steatohepatitis, while up-regulated retinol metabolism and linolenic acid metabolism may have contributed to oxidative stress and inflammatory phenomena in our NAFLD model created using CKO mice fed with HFD.

Keywords: Catalase; Inflammation; Liver metabolism; Metabolomics; Nonalcoholic fatty liver disease; Transcriptomics.


Conflict of interest statement

CONFLICT OF INTEREST

The authors report no conflict of interest.

Figures

Fig. 1.
Fig. 1.
Study design of the nonalcoholic fatty liver disease (NAFLD) model. Fig. 1 represents the overall flow of the study. A total of 24 mice were classified into 2 groups, normal fat diet (NFD, green-bordered) and high fat diet (HFD, yellow-bordered). Each group consisted of 6 wild type mice (WTNF or WTHF, light blue-colored) and 6 catalase knockout mice (CKONF or CKOHF, light orange-colored). To observe the effect of HFD (liver fat accumulation) and CKO (oxidative stress and inflammation), statistical analysis and pathway analysis were employed. The comparison between WTNF vs. CKOHF was excluded after preanalysis.
Fig. 2.
Fig. 2.
PCA and HCA based on discrimination of HFD or NFD fed WT and CKO mice. Fig. 2 shows the result of PCA (A) and HCA (B) (http://www.metaboanalyst.ca/). In Fig. 2A, each group showed a tendency to gather in their respective colored circle. Fig. 2B shows HCA a clear separation of clustering among all 4 groups (WTNF, WTHF, CKONF, and CKOHF) with color keys (upper clustering bar).
Fig. 3.
Fig. 3.
Manhattan plots of (A) WTNF vs WTHF and (B) WTHF vs CKOHF. Fig. 3 represents a Manhattan plot with the black dashed line corresponding to q=0.1. Dots above the dashed line represent 871 significant features (q<0.1) upon comparing WTNF and WTHF (A). Dots above the dashed line represent 1172 significant (q<0.1) upon comparing WTHF and CKOHF (B).
Fig. 4.
Fig. 4.
Fold change analysis of WTNF vs WTHF and WTHF vs CKOHF. This figure represents log2 transformed fold change of each gene. (A) Total 1,038 out of 28,299 genes altered with fold change threshold of 1.5 shown as purple dots. (B) Total 1,191 out of 28,299 genes altered with fold change threshold of 1.5 shown as purple dots.
Fig. 5.
Fig. 5.
Integrative pathway analysis of top 10 affected pathways. Fig. 5 represents top 10 affected pathways by both metabolites and genes. (A) The top 10 pathways affected by high fat diet was shown as bar graphs using the number of hit metabolites (red bar) and genes (blue bar) for each pathways. (B) The top 10 pathways affected by catalase knockout was shown as bar graphs using the number of hit metabolites (red bar) and genes (blue bar) for each pathways.
Fig. 6.
Fig. 6.
Primary bile acid biosynthesis pathway affected by HFD. The bar graphs represent two metabolites, 3β, 7α-dihydroxy-5-cholestenoate and cholic acid, altered significantly between WTNF and WTHF (*q<0.1, **q<0.05). The gene cyp7b1 was found severely down-regulated (FC threshold=1.5) in WTHF shown in light blue boxes. cyp27a1 and hsd3b7 were down-regulated as well but not included in the criteria (FC threshold=1.5).
Fig. 7.
Fig. 7.
Retinol metabolism pathway altered in CKOHF compared to WTHF. The bar graphs represent that all-trans-5,6-epoxy-retinoic acid, all-trans-4-hydroxy-retinoic acid and all-trans-4-oxo-retinoic acid were significantly different between WTHF and CKOHF (q<0.1). all-trans-Retinoic acid was not significant but increased. Gene expression shown in pink boxes represent cyp3a41b was found highly up-regulated (FC threshold=1.5) in CKOHF compared to WTHF. cyp26a1 was also up-regulated but not within the criteria (FC threshold=1.5). m/z values of all-trans-5,6-epoxy-retinoic acid is identical to all-trans-4-hydroxy-retinoic acid. *q<0.1, **q<0.05, ns=not significant.
Fig. 8.
Fig. 8.
Linolenic acid metabolism pathway affected in CKOHF compared to WTHF. The bar graphs represent that α/γ-linolenic acid, eicosapentaenoic acid and thromboxane A2 were significantly different in CKOHF compared to WTHF (q<0.1). Gene expression of ptgs1 and tbxas1 in pink boxes were highly up-regulated (FC threshold=1.5) in CKOHF compared to WTHF. FADS2 was up-regulated but not within the criteria (FC threshold=1.5). Stearidonic acid, eicosatetraenoic acid, thromboxane A3 and arachidonic acid showed the tendency of increase in CKOHF compared to WTHF but not significant. m/z values of α-linolenic acid and arachidonic acid were identical to γ-linolenic acid and eicosatetraenoic acid, respectively. *q<0.05 **q<0.01.
Fig. 9.
Fig. 9.
Overall observation of HFD and CKO effect on pathways. (A) This figure represents relative intensities of metabolites related to 3 pathways, primary bile acid biosynthesis, retinol metabolism, and linolenic acid metabolism, in all 4 groups in form of box and whisker plot. Two metabolites from primary bile acid biosynthesis are decreased in WTHF, CKONF and CKOHF compared to WTNF. Five metabolites belonged to retinol metabolism and linolenic acid metabolism showed same tendency increased most in CKOHF among 4 groups. The metabolites were tested with one-way ANOVA with Tukey’s HSD. *p<0.05, ****p<0.001. (B) This figure shows the quantified concentration of cholic acid, a representative composition of bile acid. Cholic acid showed the highest value in WTNF compared to the other groups.
Fig. 10.
Fig. 10.
Receiver operating characteristic (ROC) curves of the 5 metabolites in comparison of WTHF and CKOHF. ROC curves were created with 5 significant metabolites. (A) Among five metabolites, two metabolites model showed highest prognostic value of AUC=0.905 with 95% confidence interval. (B) The values of predicted class probabilities of each sample separate the CKOHF (white) from WTHF (black) shown as dots. The observed error rate of 1/6 in CKOHF (n=6) and 1/6 in WTHF (n=6).
Fig. 11.
Fig. 11.
Correlation analysis of all metabolites and genes from selected pathways. (A) This figure represents clustered heatmap of correlation with selected metabolites and genes. The red colored metabolites and genes were positively correlated, while negatively correlated metabolites and genes are shown as green colored. (B) Correlation coefficients of each metabolite and gene against all-trans-4-oxo-retinoic acid were shown as horizontal bars. The light blue bar represents negative correlation and the light red bar represents positively correlated metabolites or genes.

References

    1. Arguello G, Balboa E, Arrese M, Zanlungo S. Recent insights on the role of cholesterol in non-alcoholic fatty liver disease. Biochim. Biophys. Acta. 2015;1852:1765–1778. doi: 10.1016/j.bbadis.2015.05.015. - DOI - PubMed
    1. Cani PD, Bibiloni R, Knauf C, Waget A, Neyrinck AM, Delzenne NM, Burcelin R. Changes in gut microbiota control metabolic endotoxemia-induced inflammation in high-fat diet–induced obesity and diabetes in mice. Diabetes. 2008;57:1470–1481. doi: 10.2337/db07-1403. - DOI - PubMed
    1. Cavill R, Jennen D, Kleinjans J, Briede JJ. Transcriptomic and metabolomic data integration. Brief. Bioinform. 2016;17:891–901. doi: 10.1093/bib/bbv090. - DOI - PubMed
    1. Clarke GM, Anderson CA, Pettersson FH, Cardon LR, Morris AP, Zondervan KT. Basic statistical analysis in genetic case-control studies. Nat. Protoc. 2011;6:121–133. doi: 10.1038/nprot.2010.182. - DOI - PMC - PubMed
    1. Darwish RS, Amiridze N, Aarabi B. Nitrotyrosine as an oxidative stress marker: evidence for involvement in neurologic outcome in human traumatic brain injury. J. Trauma. 2007;63:439–442. doi: 10.1097/TA.0b013e318069178a. - DOI - PubMed

LinkOut - more resources