

The genome-wide transcriptional consequences of the nullisomic-tetrasomic stocks for homoeologous group 7 in bread wheat
- PMID: 30630423
- PMCID: PMC6327598
- DOI: 10.1186/s12864-018-5421-3
The genome-wide transcriptional consequences of the nullisomic-tetrasomic stocks for homoeologous group 7 in bread wheat
Abstract
Background: Hexaploid bread wheat (Triticum aestivum L) arose by two polyploidisation events from three diploid species with homoeologous genomes. Nullisomic-tetrasomic (nulli-tetra or NT) lines are aneuploid wheat plants lacking two and adding two of six homoeologous chromosomes. These plants can grow normally, but with significantly morphological variations because the adding two chromosomes or the remaining four chromosomes compensate for those absent. Despite these interesting phenomena, detailed molecular mechanisms underlying dosage deletion and compensation in these useful genetic materials have not been determined.
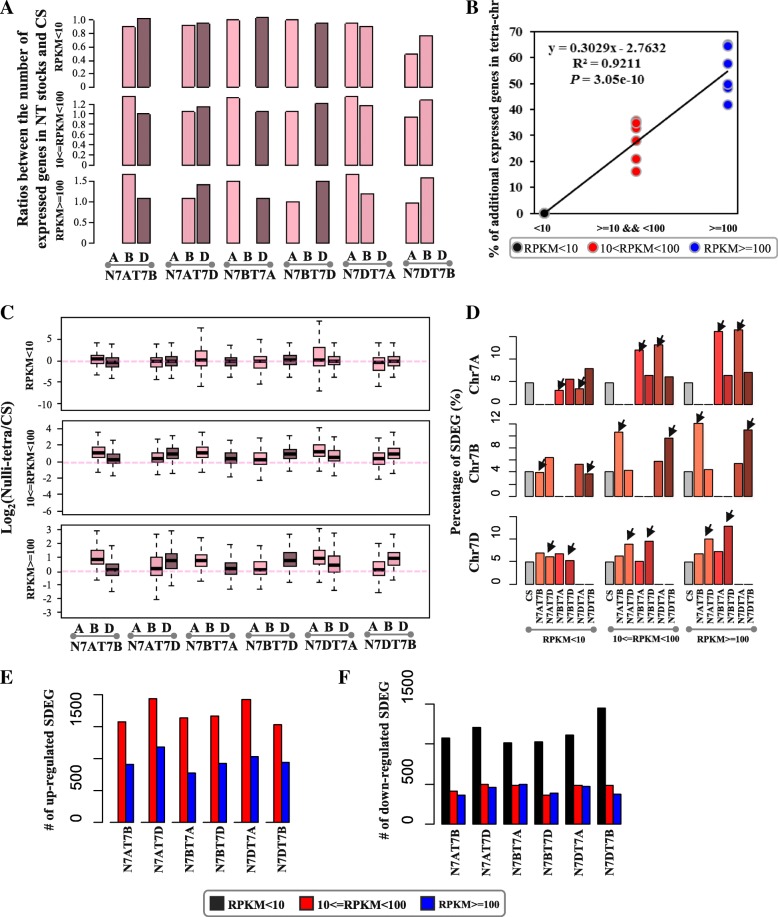
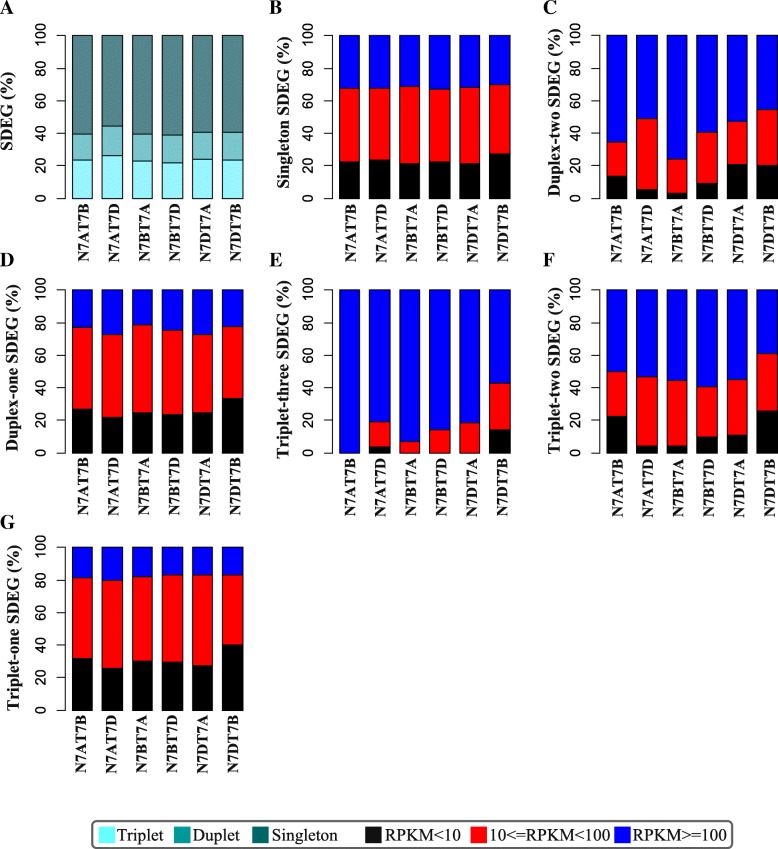
Results: By sequencing the transcriptomes of leaves in two-week-old seedlings, we showed that the profiles of differentially expressed genes between NT stocks for homoeologous group 7 and the parent hexaploid Chinese Spring (CS) occurred throughout the whole genome with a subgenome and chromosome preference. The deletion effect of nulli-chromosomes was compensated partly by the tetra-chromosomes via the dose level of expressed genes, according to the types of homoeologous genes. The functions of differentially regulated genes primarily focused on carbon metabolic process, photosynthesis process, hormone metabolism, and responding to stimulus, and etc., which might be related to the defective phenotypes that included reductions in plant height, flag leaf length, spikelet number, and kernels per spike.
Conclusions: The perturbation of the expression levels of transcriptional genes among the NT stocks for homoeologous group 7 demonstrated the gene dosage effect of the subgenome at the genome-wide level. The gene dosage deletion and compensation can be used as a model to elucidate the functions of the subgenomes in modern polyploid plants.
Keywords: Dosage compensation; Dosage deletion; Gene expression; Nullisomic-tetrasomic stocks; Triticum aestivum L.
Conflict of interest statement
Ethics approval and consent to participate
The original seeds of NT stocks used in this study were provided by the Wheat Genetics Resource Center (WGRC). The experimental research on wheat including NT stock and Chinese Spring, complied with the Crop Research Institute, Shandong Academy of Agricultural Sciences (SAAS), and followed the Material Transfer Agreement (MTA) and Code of Ethics of the WGRC guidelines. The field studies was conducted in accordance with the legislation of Crop Research Institute, SAAS.
Consent for publication
Not applicable.
Competing interests
The authors declare that they have no competing interests.
Publisher’s Note
Springer Nature remains neutral with regard to jurisdictional claims in published maps and institutional affiliations.
Figures


References
-
- Musacchio A, Salmon ED. The spindle-assembly checkpoint in space and time. Nat Rev Mol Cell Biol. 2007;8(5):379–393. - PubMed
-
- Weaver BA, Cleveland DW. Does aneuploidy cause cancer? Curr Opin Cell Biol. 2006;18(6):658–667. - PubMed
-
- Doyle GG. Aneuploidy and inbreeding depression in random mating and self-fertilizing autotetraploid populations. Theor Appl Genet. 1986;72(6):799–806. - PubMed
MeSH terms
Grants and funding
- 31501312/The National Natural Science Foundation of China
- 31601301/The National Natural Science Foundation of China
- 31701428/The National Natural Science Foundation of China
- ZR2014CM006/the Natural Science Foundation of Shandong Province
- CXGC2016C09/the Agricultural Science and Technology Innovation Project of Shandong Academy of Agricultural Sciences
LinkOut - more resources
Full Text Sources
Research Materials
