Comparative Study
. 2019 Jan 10;20(1):9.
doi: 10.1186/s13059-018-1614-y.

Accurate prediction of cell type-specific transcription factor binding

Affiliations
Comparative Study

Accurate prediction of cell type-specific transcription factor binding

Jens Keilwagen et al. Genome Biol. .

Abstract

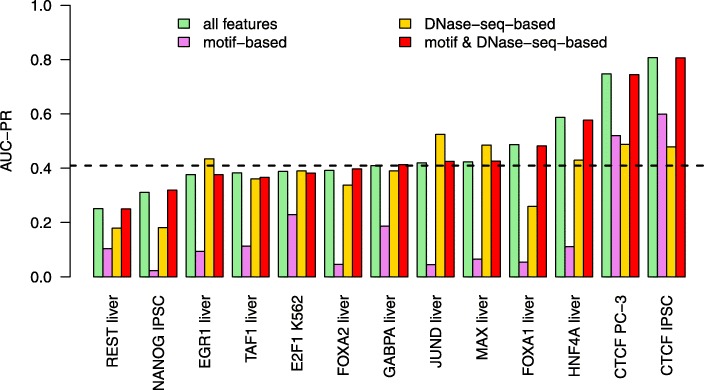
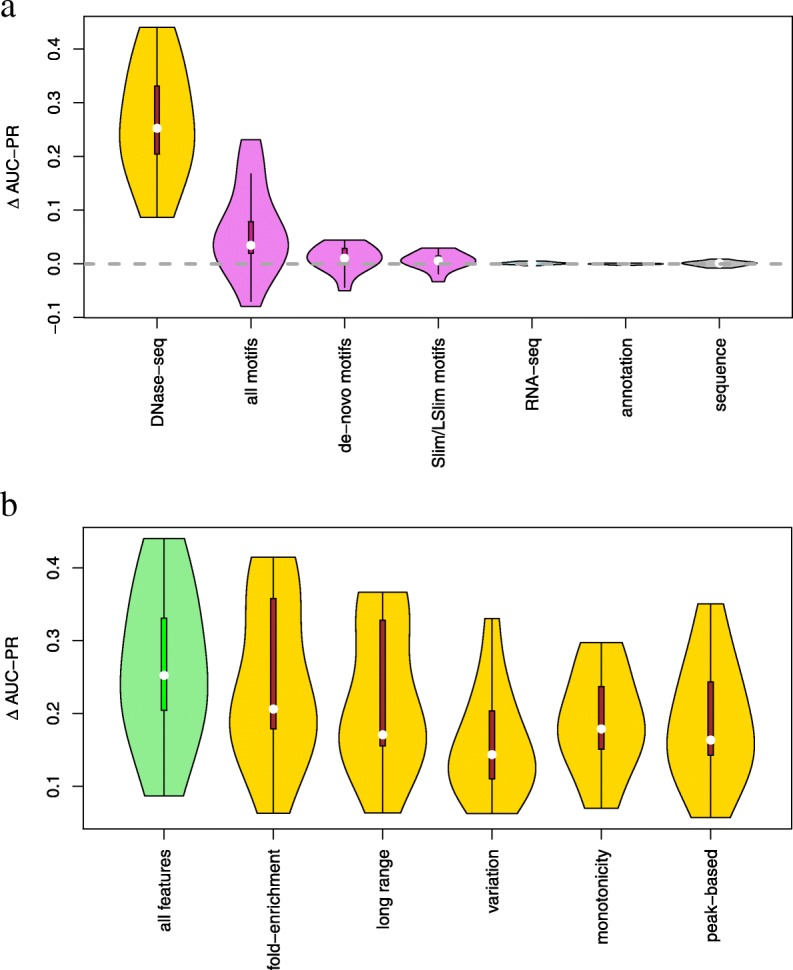
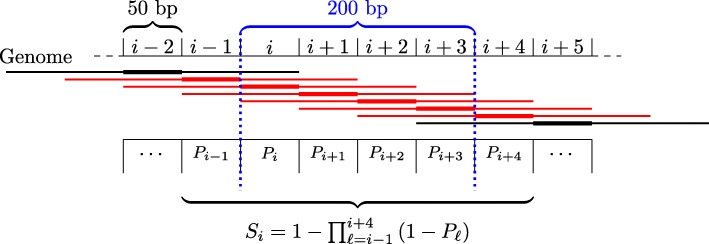
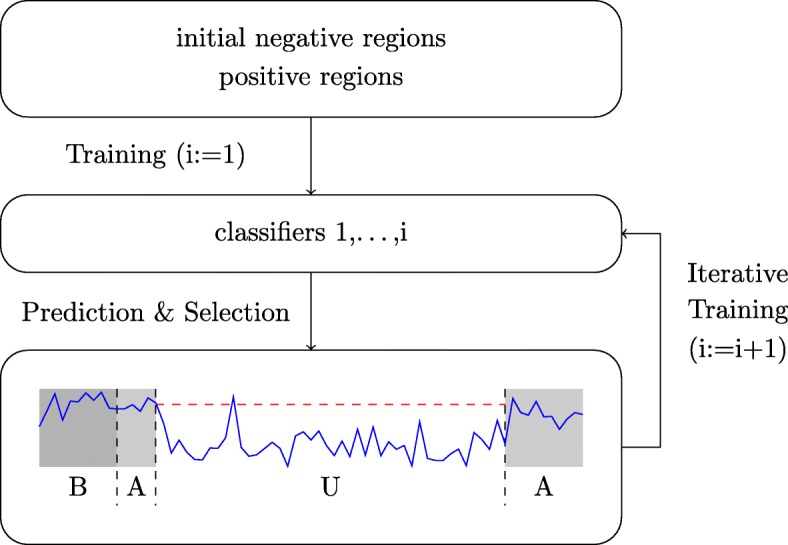
Prediction of cell type-specific, in vivo transcription factor binding sites is one of the central challenges in regulatory genomics. Here, we present our approach that earned a shared first rank in the "ENCODE-DREAM in vivo Transcription Factor Binding Site Prediction Challenge" in 2017. In post-challenge analyses, we benchmark the influence of different feature sets and find that chromatin accessibility and binding motifs are sufficient to yield state-of-the-art performance. Finally, we provide 682 lists of predicted peaks for a total of 31 transcription factors in 22 primary cell types and tissues and a user-friendly version of our approach, Catchitt, for download.

Keywords: Cell type-specific; ChIP-seq; DNase-seq; Machine learning; Transcription factors.


Conflict of interest statement

Ethics approval and consent to participate

Not applicable.

Consent for publication

Not applicable.

Competing interests

The authors declare that they have no competing interests.

Publisher’s Note

Springer Nature remains neutral with regard to jurisdictional claims in published maps and institutional affiliations.

Figures

Fig. 1
Fig. 1
Across cell type performance. For each of the 13 combinations of TF and cell type within the test data, we compute the prediction performance (AUC-PR) on the held-out chromosomes of classifiers (i) using all features considered, (ii) using only motif-based features, (iii) using only DNase-seq-based features, and (iv) using only motif-based and DNase-seq-based features. Median performance of classifiers using all features is indicated by a dashed line
Fig. 2
Fig. 2
Importance of feature sets. a We test the importance of related sets of features by excluding one set of features from the training data, measuring the performance (AUC-PR) of the resulting classifier, and subtracting this AUC-PR value from the corresponding value achieved by the classifier using all features. Hence, if Δ AUC-PR is above zero, the left-out set of features improved the final prediction performance, whereas Δ AUC-PR values below zero indicate a negative effect on prediction performance. We collect the Δ AUC-PR values for all 13 test data sets and visualize these as violin plots. b Assessment of different groups of DNase-seq-based features. In this case, we compare the performance including one specific group of DNase-seq-based features (cf. Additional file 1: Text S2)) with the performance without any DNase-seq-based features (cf. violin “DNase-seq” in panel a). We find that all DNase-seq-based features contribute positively to prediction performance
Fig. 3
Fig. 3
Relevance of the iterative training procedure. For each of the 13 test data sets, we compare the performance (AUC-PR) achieved by the (set of) classifier(s) trained on the initial negative regions (abscissa) with the performance achieved by averaging over all classifiers from the iterative training procedure (ordinate)
Fig. 4
Fig. 4
Performance of ensemble classifiers. For each of the 13 test data sets, we compare the performance (AUC-PR) of the individual classifiers trained on single cell types (open circles) to that of the ensemble classifier averaging over all classifiers trained on all training cell types (filled, orange circles). As a reference, we also plot the median of the individual classifiers as a red bar
Fig. 5
Fig. 5
Schema for computing probabilities for regions overlapping with predicted peaks. We consider 200-bp regions and five bins in this example. Center bins are indicated by thick lines. Putative peaks are annotated with the probability Pi of being a true peak. All peaks marked in red overlap the region of interest (dotted blue lines) by at least 100 bp and are considered for the prediction. The prediction Si for the 200-bp region is then computed as the probability that this region overlaps with at least one of the peaks
Fig. 6
Fig. 6
Iterative training procedure. Starting from an initial set of negative regions and the complete set of positive regions, a first classifier is trained and applied to the training data, and putative false positive (i.e., “unbound” regions with large prediction scores) are identified. In each of the subsequent iterations, such regions are added to the set of negative regions, which are in turn used for training refined classifiers. The result of this iterative training procedure is a set of five classifiers trained in five cycles of the iterative training procedure

References

    1. Staden R. Computer methods to locate signals in nucleic acid sequences. Nucleic Acids Res. 1984;12:505–19. - PMC - PubMed
    1. Berg OG, von Hippel PH. Selection of DNA binding sites by regulatory proteins: statistical-mechanical theory and application to operators and promoters. J Mol Biol. 1987;193(4):723–43. - PubMed
    1. Stormo GD, Fields DS. Specificity, free energy and information content in protein–DNA interactions. Trends Biochem Sci. 1998;23(3):109–13. - PubMed
    1. Bulyk ML. Computational prediction of transcription-factor binding site locations. Genome Biol. 2003;5(1):201. - PMC - PubMed
    1. Wu J, Smith LT, Plass C, Huang TH-M. ChIP-chip comes of age for genome-wide functional analysis. Cancer Res. 2006;66(14):6899–902. - PubMed

Substances

LinkOut - more resources