. 2019 Mar 13;39(11):1969-1981.
doi: 10.1523/JNEUROSCI.2155-18.2018. Epub 2019 Jan 10.

Two Distinct Sets of Ca2+ and K+ Channels Are Activated at Different Membrane Potentials by the Climbing Fiber Synaptic Potential in Purkinje Neuron Dendrites

Affiliations

Two Distinct Sets of Ca2+ and K+ Channels Are Activated at Different Membrane Potentials by the Climbing Fiber Synaptic Potential in Purkinje Neuron Dendrites

Karima Ait Ouares et al. J Neurosci. .

Abstract

In cerebellar Purkinje neuron dendrites, the transient depolarization associated with a climbing fiber (CF) EPSP activates voltage-gated Ca2+ channels (VGCCs), voltage-gated K+ channels (VGKCs), and Ca2+-activated SK and BK K+ channels. The resulting membrane potential (Vm) and Ca2+ transients play a fundamental role in dendritic integration and synaptic plasticity of parallel fiber inputs. Here we report a detailed investigation of the kinetics of dendritic Ca2+ and K+ channels activated by CF-EPSPs, based on optical measurements of Vm and Ca2+ transients and on a single-compartment NEURON model reproducing experimental data. We first measured Vm and Ca2+ transients associated with CF-EPSPs at different initial Vm, and we analyzed the changes in the Ca2+ transients produced by the block of each individual VGCCs, of A-type VGKCs and of SK and BK channels. Then, we constructed a model that includes six active ion channels to accurately match experimental signals and extract the physiological kinetics of each channel. We found that two different sets of channels are selectively activated. When the dendrite is hyperpolarized, CF-EPSPs mainly activate T-type VGCCs, SK channels, and A-type VGKCs that limit the transient Vm ∼ <0 mV. In contrast, when the dendrite is depolarized, T-type VGCCs and A-type VGKCs are inactivated and CF-EPSPs activate P/Q-type VGCCs, high-voltage activated VGKCs, and BK channels, leading to Ca2+ spikes. Thus, the potentially activity-dependent regulation of A-type VGKCs, controlling the activation of this second set of channels, is likely to play a crucial role in signal integration and plasticity in Purkinje neuron dendrites.SIGNIFICANCE STATEMENT The climbing fiber synaptic input transiently depolarizes the dendrite of cerebellar Purkinje neurons generating a signal that plays a fundamental role in dendritic integration. This signal is mediated by two types of Ca2+ channels and four types of K+ channels. Thus, understanding the kinetics of all of these channels is crucial for understanding PN function. To obtain this information, we used an innovative strategy that merges ultrafast optical membrane potential and Ca2+ measurements, pharmacological analysis, and computational modeling. We found that, according to the initial membrane potential, the climbing fiber depolarizing transient activates two distinct sets of channels. Moreover, A-type K+ channels limit the activation of P/Q-type Ca2+ channels and associated K+ channels, thus preventing the generation of Ca2+ spikes.

Keywords: calcium channels; cerebellar Purkinje neuron; climbing fiber; neuron modeling; neuronal dendrites; potassium channels.


Figures

Figure 1.
Figure 1.
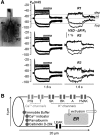
Vm calibration protocol and illustration of NEURON model. A, Left, Fluorescence reconstruction of a PN with three ROIs (R1, R2, and R3). From the resting Vm (−67 mV), negative or positive current pulses of 1 s duration were delivered from the recording electrode. Right, Somatic Vm and the VSD-ΔF/F0 signals in R1-R3 associated with the current pulses. The VSD-ΔF/F0 signal in each region is converted into millivolts to quantify the Vm transient associated with the CF-EPSP, assuming that the resting Vm is uniform (int state) and that the hyperpolarizing pulse spreads into the dendrites without attenuation (hyp state). The protocol also allows determining the dendritic Vm associated with the strongest depolarizing pulse (dep state). B, A dendritic region of ∼17 × 17 μm2 is approximated with a cylinder of 4 μm diameter and 20 μm length in the NEURON model. The model contains P/Q-type and T-type Ca2+ channels; SK, BK, A-type K+ channels; and a generic HVAK. It includes four buffers: a fast immobile buffer, the Ca2+ indicator (either Fura-FF or OG5N), Parvalbumin, and Calbindin D-28k. It also includes Ca2+ extrusion and a LEAK channel.
Figure 2.
Figure 2.
Combined Vm and Ca2+ transients associated with the CF-EPSP. A, Bottom, Fluorescence reconstruction of a representative PN with two ROIs indicated (R1 and R2). Top, Somatic Vm associated with a CF-EPSP at three different initial Vm: hyperpolarized (hyp blue trace); intermediate (int green trace); and depolarized (dep red trace). B, Top, Dendritic Vm in R1 and R2 calibrated as illustrated in Figure 1A corresponding to the somatic CF-EPSPs in A. Bottom, Corresponding FuraFF ΔF/F0 signals. C, Analysis of the Vm and Ca2+ maxima (max) associated with signals in R1 reported in B; the first max of the Vm and Ca2+ transients is calculated within the first 4 ms after the CF stimulation; the second max of the Vm and Ca2+ transients is calculated between 4 and 14 ms after the CF stimulation. Blue traces represent the hyp state. Green traces represent the int state. Red traces represent the dep state. D, Mean ± SD for 19 regions in 12 cells analyzed as illustrated in C. The hyp states (blue columns) were with initial Vm between −87 mV and −74 mV. The int states (green columns) were with initial Vm between −68 mV and −61 mV. The dep states (red columns) were with initial Vm between −54 and −46 mV. *Significant increase in the max (p < 0.005, paired t test).
Figure 3.
Figure 3.
Dendritic Ca2+ channels activated by the CF-EPSP. A, Left, Fluorescence reconstruction of a PN with two ROIs indicated (R1 and R2): R1 is next to a pipette delivering 1 μm of the P/Q-type VGCC inhibitor AgaIVA; R2 is >50 μm from the application pipette. Right, Top, Somatic Vm associated with CF-EPSPs in control conditions and after local application of AgaIVA at three different initial Vm: hyp (blue trace); int (green trace); and dep (red trace). Right, Bottom, The corresponding OG5N ΔF/F0 signals. B, In another PN, same as A, but with the pipette delivering the T-type VGCC inhibitors ML (5 μm) and NNC (30 μm). C, In another PN, same as A, but with the pipette delivering both the P/Q VGCC inhibitor AgaIVA (1μm) and the T-type VGCC inhibitors ML (5 μm) and NNC (30 μm). D, In three other PNs, from a region next to a pipette delivering a VGCC blocker, the OG5N ΔF/F0 signals associated with CF-EPSPs in control conditions and after local application of 20 μm of the L-type VGCC inhibitor Isr, of 5 μm of the N-type VGCC inhibitor PD or 1 μm of the R-type VGCC inhibitor SNX at the three different initial Vm.
Figure 4.
Figure 4.
Quantitative analysis of dendritic Ca2+ channels activated by the CF-EPSP. Left, From two representative cells, OG5N ΔF/F0 signals associated with CF-EPSPs in control conditions at three different initial Vm: hyp (blue trace); int (green trace); and dep (red trace); superimposed (gray traces) are the OG5N ΔF/F0 signals after local application of either 1 μm of the P/Q-type VGCC inhibitor AgaIVA or of the T-type VGCC blockers ML (5 μm) and NNC (30 μm); the first max of the Ca2+ transient is calculated within the first 4 ms after the CF stimulation; the second max of the Ca2+ transient is calculated between 4 and 14 ms after the CF stimulation; the percentages from control ΔF/F0 maxima after application of the VGCC blockers are reported above or below the arrows. Right, Mean ± SD of the percentages from control ΔF/F0 maxima after application of the VGCC inhibitors AgaIVA (N = 6 cells), ML+NNC (N = 6 cells), AgaIVA+ML+NNC (N = 6 cells), Isr (N = 4 cells), PD (N = 4 cells), or SNX (N = 4 cells). Gray columns represent the statistics of the first max. White columns represent the statistics of the second max. *Significant change in the max (p < 0.005, paired t test).
Figure 5.
Figure 5.
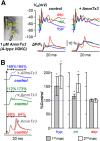
Dendritic A-type VGKCs activated by the CF-EPSP. A, Left, Fluorescence reconstruction of a PN with an ROI indicated next to a pipette delivering 1 μm of the A-type VGKC inhibitor AmmTx3. Right, Top, Somatic Vm associated with CF-EPSPs in control conditions and after local application of AmmTx3 at three different initial Vm: hyp (blue trace); int (green trace); and dep (red trace). Right, Bottom, The corresponding OG5N ΔF/F0 signals. B, Left, From the cell in A, OG5N ΔF/F0 signals associated with CF-EPSPs in control conditions at the three different initial Vm; superimposed (gray traces) are the OG5N ΔF/F0 signals after local application of either 1 μm AmmTx3; the first max of the Ca2+ transient is calculated within the first 4 ms after the CF stimulation; the percentages from control ΔF/F0 maxima after application of the VGCC blockers are reported above the arrows. Right, Mean ± SD of the percentages from control ΔF/F0 maxima after application of AmmTx3 (N = 6 cells). Gray columns represent the statistics of the first max. White columns represent the statistics of the second max. *Significant change in the max (p < 0.005, paired t test).
Figure 6.
Figure 6.
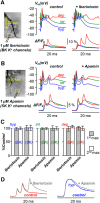
Dendritic Ca2+-activated K+ channels activated by the CF-EPSP. A, Left, Fluorescence reconstruction of a PN with an ROI indicated next to a pipette delivering 1 μm of the BK channel inhibitor iberiotoxin. Right, Top, Somatic Vm associated with CF-EPSPs in control conditions and after local application of iberiotoxin at three different initial Vm: hyp (blue trace); int (green trace); and dep (red trace). Right, Bottom, The corresponding OG5N ΔF/F0 signals. B, In another PN, same as A, but with the pipette delivering 1 μm of the SK channel inhibitor apamin. C, Mean ± SD of the percentages from control ΔF/F0 maxima after application of iberiotoxin (N = 5 cells) or apamin (N = 6 cells). Gray columns represent the statistics of the first max. White columns represent the statistics of the second max. D, Left, From the cell in A, OG5N ΔF/F0 signal associated with the CF-EPSP at dep state in control condition and after addition of iberiotoxin (gray trace). Right, From the cell in B, OG5N ΔF/F0 signal associated with the CF-EPSP at hyp state in control condition and after addition of apamin (gray trace).
Figure 7.
Figure 7.
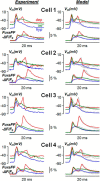
NEURON model of 4 PN dendritic compartments reproducing Vm and Ca2+ transients associated with the CF-EPSP. Left, Experimental dendritic Vm and Ca2+ transients associated with CF-EPSPs from 4 selected cells at three different initial Vm: hyperpolarized (hyp, blue trace); intermediate (int, green trace); depolarized (dep, red trace). Right, Simulations of dendritic Vm and Ca2+ transients associated with CF-EPSPs reproducing experimental data (gray traces).
Figure 8.
Figure 8.
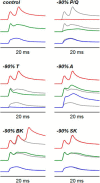
Simulations of block of P/Q-type VGCCs, T-type VGCCs, A-type VGKCs, BK and SK Ca2+-activated K+ channels from a NEURON model. Simulated Ca2+ transients (OG5N) associated with CF-EPSPs at three different initial Vm in control condition and after reduction of 90% of one individual channels from Cell 1 model variant reported in Figure 7. For each case of 90% channel reduction, traces under control conditions are reported in gray.
Figure 9.
Figure 9.
Individual currents extracted from the NEURON model. Ca2+ currents of P/Q and T channels and K+ currents of A, BK, SK, and HVAK channels from the simulations of Cell 1 model variant reported in Figure 7. Simulations were at hyp (blue traces), int (green traces), and dep (red traces) states in control conditions, and at hyp (purple traces) after blocking 90% of A-type VGKCs, superimposed to currents in control conditions (gray traces).
Figure 10.
Figure 10.
Channel activation following CF-EPSPs at hyperpolarized and depolarized states. A, In control conditions, at hyp state, the CF-EPSP activates T-type channels, which activate SK channels, and A channels, which limit activation P/Q and HVAK channels; at dep state, the CF-EPSP activates P/Q-type channels, which activate BK channels, and HVAK channels, while T channels and A channels are inactivated. B, When A channels are blocked or inactivated, at hyp state, the CF-EPSP also activates P/Q-type channels, which activate BK channels, and HVAK channels.

References

    1. Ait Ouares K, Jaafari N, Canepari M (2016) A generalised method to estimate the kinetics of fast Ca(2+) currents from Ca(2+) imaging experiments. J Neurosci Methods 268:66–77. 10.1016/j.jneumeth.2016.05.005 - DOI - PubMed
    1. Anwar H, Hong S, De Schutter E (2012) Controlling Ca2+-activated K+ channels with models of Ca2+ buffering in Purkinje cells. Cerebellum 11:681–693. 10.1007/s12311-010-0224-3 - DOI - PMC - PubMed
    1. Anwar H, Hepburn I, Nedelescu H, Chen W, De Schutter E (2013) Stochastic calcium mechanisms cause dendritic calcium spike variability. J Neurosci 33:15848–15867. 10.1523/JNEUROSCI.1722-13.2013 - DOI - PMC - PubMed
    1. Anwar H, Roome CJ, Nedelescu H, Chen W, Kuhn B, De Schutter E (2014) Dendritic diameters affect the spatial variability of intracellular calcium dynamics in computer models. Front Cell Neurosci 8:168. 10.3389/fncel.2014.00168 - DOI - PMC - PubMed
    1. Brager DH, Johnston D (2014) Channelopathies and dendritic dysfunction in fragile X syndrome. Brain Res Bull 103:11–17. 10.1016/j.brainresbull.2014.01.002 - DOI - PMC - PubMed

Publication types

MeSH terms

LinkOut - more resources