. 2019 Feb 11;132(3):jcs221606.
doi: 10.1242/jcs.221606.

The N-cadherin interactome in primary cardiomyocytes as defined using quantitative proximity proteomics

Affiliations

The N-cadherin interactome in primary cardiomyocytes as defined using quantitative proximity proteomics

Yang Li et al. J Cell Sci. .

Abstract

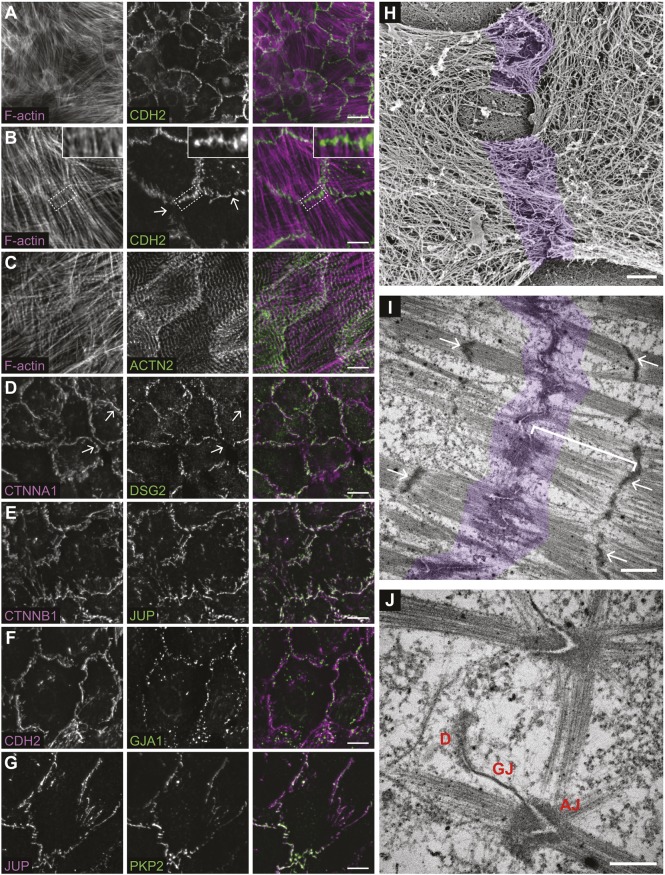
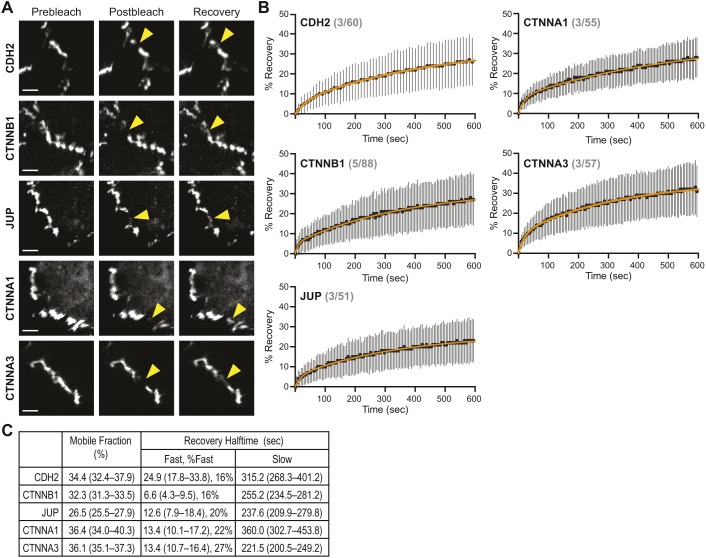
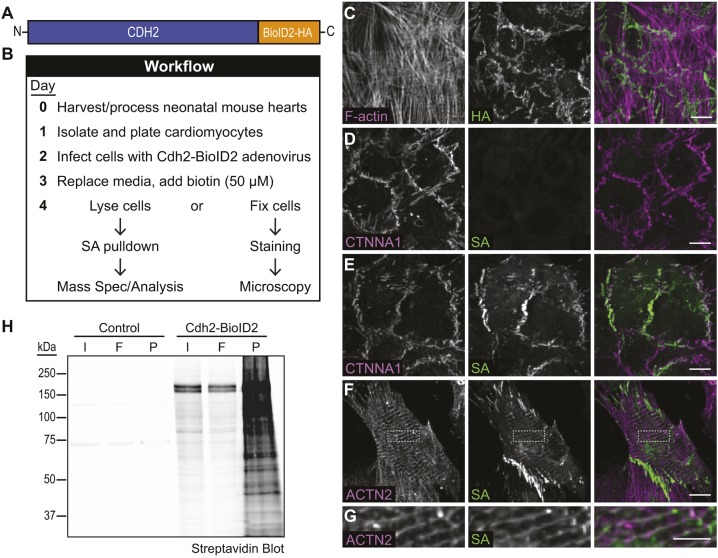
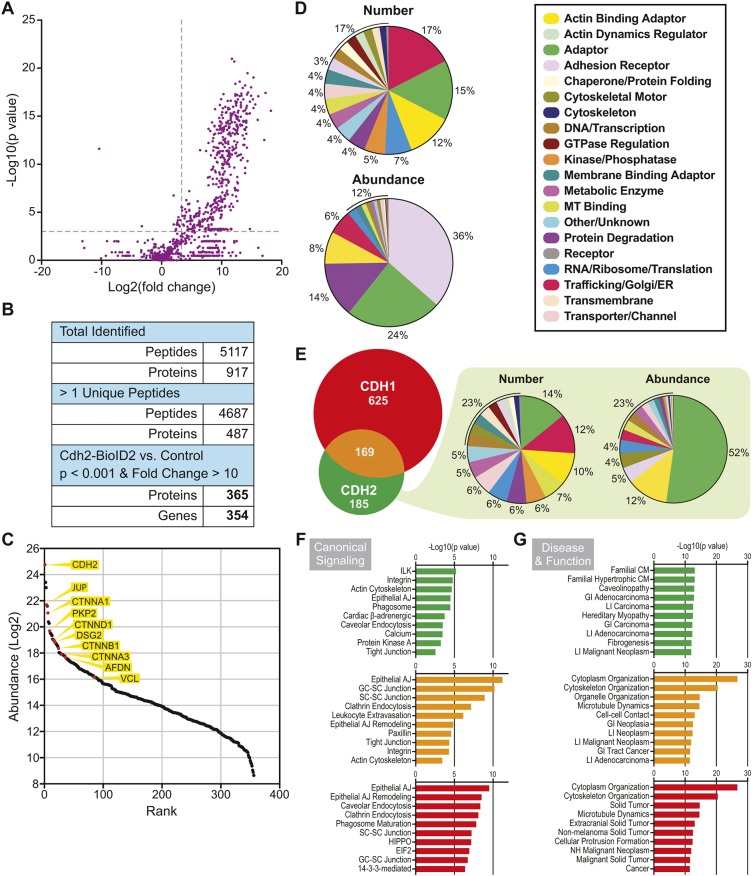
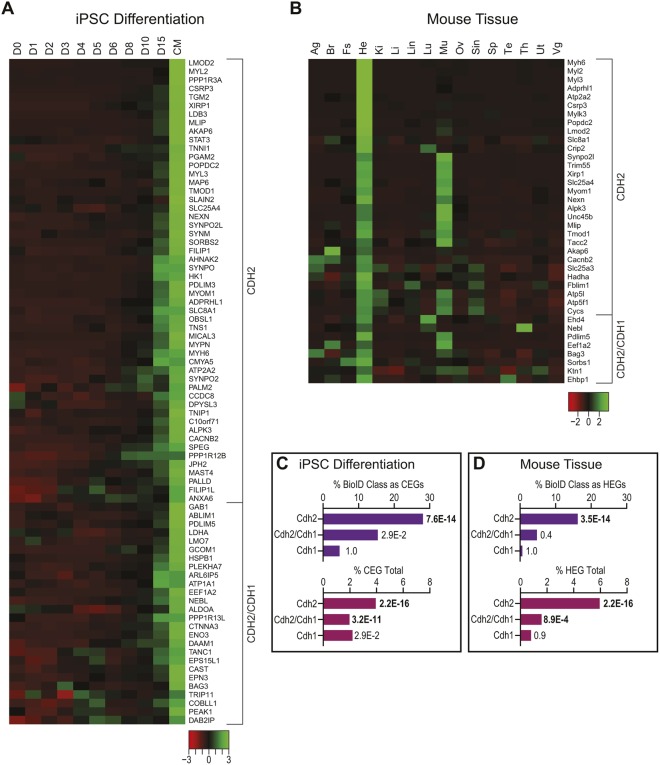
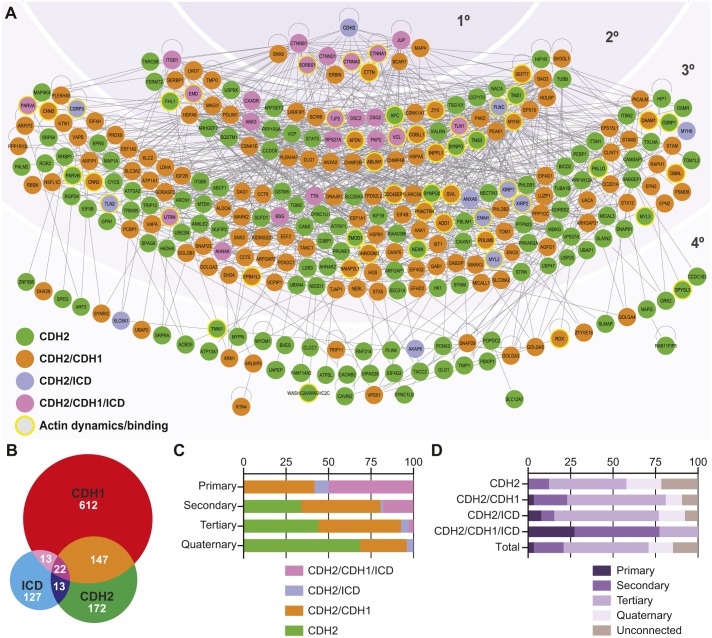
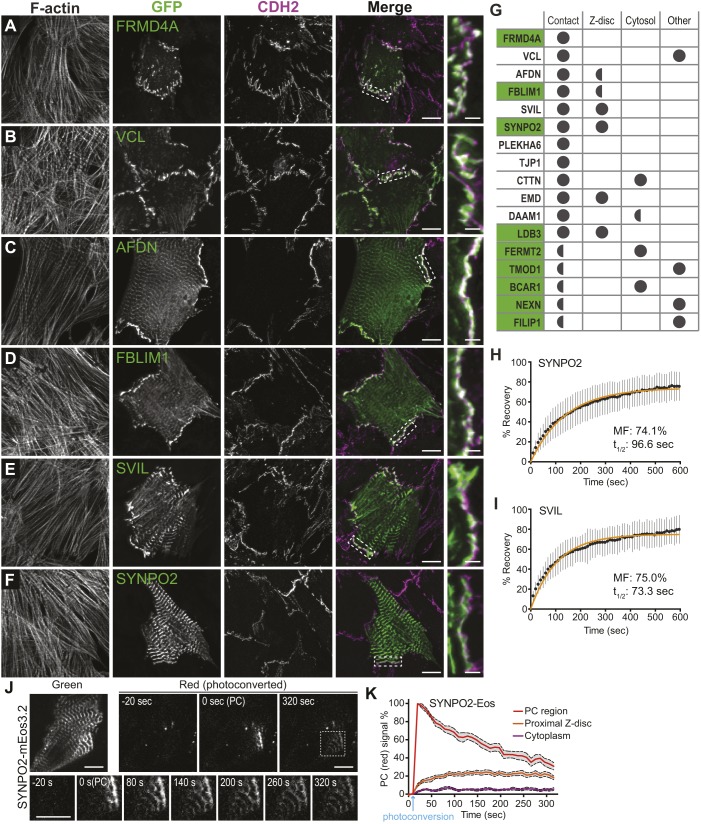
The junctional complexes that couple cardiomyocytes must transmit the mechanical forces of contraction while maintaining adhesive homeostasis. The adherens junction (AJ) connects the actomyosin networks of neighboring cardiomyocytes and is required for proper heart function. Yet little is known about the molecular composition of the cardiomyocyte AJ or how it is organized to function under mechanical load. Here, we define the architecture, dynamics and proteome of the cardiomyocyte AJ. Mouse neonatal cardiomyocytes assemble stable AJs along intercellular contacts with organizational and structural hallmarks similar to mature contacts. We combine quantitative mass spectrometry with proximity labeling to identify the N-cadherin (CDH2) interactome. We define over 350 proteins in this interactome, nearly 200 of which are unique to CDH2 and not part of the E-cadherin (CDH1) interactome. CDH2-specific interactors comprise primarily adaptor and adhesion proteins that promote junction specialization. Our results provide novel insight into the cardiomyocyte AJ and offer a proteomic atlas for defining the molecular complexes that regulate cardiomyocyte intercellular adhesion. This article has an associated First Person interview with the first authors of the paper.

Keywords: Adherens junction; CDH2; Cardiomyocyte; Interactome; Intercalated disc; N-cadherin; Proteomics.


Conflict of interest statement

Competing interestsThe authors declare no competing or financial interests.

Figures

Fig. 1.
Fig. 1.
Cardiomyocyte cell–cell contact organization and architecture. (A–G) Mouse neonatal cardiomyocytes plated to confluency, fixed 48–72 h post-plating and stained for: F-actin and CDH2 (A,B), F-actin and ACTN2 (C), CTNNA1 and DSG2 (D), CTNNB1 and JUP (E), CDH2 and GJA1 (F) and JUP and PKP2 (G). Individual channels and merge shown. All images are maximum projections of deconvolved Z-stacks. In B, the white arrows mark gaps in CDH2 staining along contacts and the inset is a magnification of the boxed contact that highlights myofibril integration at contacts. In D, white arrows mark CTNNA1-positive, DSG2-negative contacts. (H) Platinum replica electron microscopy image of two connected cardiomyocytes. (I,J) Thin section electron microscopy images of cardiomyocyte cell–cell junctions. In H,I, the cell–cell contact is highlighted in purple. In I, white arrows point to Z-discs and the white bar defines a membrane-proximal sarcomere. In J, desmosome (D), gap junction (GJ) and adherens junction (AJ) are labeled. Scale bars: 20 µm in A; 10 µm in B–G; 500 nm in H; 1 µm in I; 500 nm in J.
Fig. 2.
Fig. 2.
Adherens junction protein dynamics at cardiomyocyte cell–cell contacts. (A) Representative pre-bleach, post-bleach and recovery images from FRAP studies of cells expressing GFP-tagged CDH2, CTNNB1, JUP, CTNNA1 and CTNNA3. Yellow arrowheads mark the FRAP region along a cell–cell contact. Scale bars: 50 µm. (B) Plots of mean±s.d. FRAP recovery fraction over time. The data were fit to a double exponential curve (orange line). Values in gray show number of experiments/FRAP contacts quantified for each protein. (C) Summary of the mobile fraction (as percentages) and recovery halftimes (fast and slow pools). The percentage of the fast pool also listed.
Fig. 3.
Fig. 3.
CDH2–BioID2 localizes to cell contacts and labels junctional proteins. (A) Schematic of CDH2–BioID2 fusion. (B) Experimental workflow for infecting primary cardiomyocytes, labeling with biotin, and protein fixation or isolation. (C) CDH2–BioID2-infected cardiomyocytes were stained for F-actin (magenta in merge) and HA (green in merge) to identify the HA-tagged fusion construct. (D,E) Uninfected (D) and CDH2–BioID2-infected (E) cardiomyocytes were stained for CTNNA1 and labeled with a streptavidin (SA) conjugated to CY3 to identify biotinylated proteins. (F,G) CDH2–BioID2-infected cardiomyocytes stained for ACTN2 and biotin (SA). G is a high-magnification image of the boxed region in F, highlighting biotinylated proteins along Z-lines. All images in C–G are maximum projections of deconvolved z-stacks. (H) Streptavidin western blot of pulldowns from control and CDH2–BioID2-infected cardiomyocytes. Initial material (I), flow through (F) and precipitated material (P) marked. Scale bars: 10 µm in C–F; 5 µm in G.
Fig. 4.
Fig. 4.
Quantitative mass spectrometry identifies CDH2 interactome. (A) Plot of P-value (−log10) versus fold-change (log2) (described in Materials and Methods) of identified proteins. Dashed gray lines mark P=0.001 (y axis) and fold-change=10 (x axis). (B) Summary of numbers of identified peptides and proteins at each stage of further condition stringency. (C) Rank plot of abundance (iBAQ mass, log2). Proteins of interest are marked as red circles and labeled. (D) Protein distribution by assigned category based on number (top pie chart) or abundance (iBAQ) (bottom pie chart). (E) Venn diagram of CDH2 interactome in cardiomyocytes (green) versus CDH1 interactome from epithelial cells (red). 169 proteins are shared (orange). Distribution of the CDH2-only pool (minus CDH2, 184 proteins) based on number (left) or abundance (right). (F,G) IPA enrichment analysis of CDH2-only (green), CDH2/CDH1-shared (orange) and CDH1-only (red) groups in canonical signaling pathways (F) or disease and function (G). Abbreviations: AJ, adherens junction; CM, cardiomyopathy; GC, germ cell; GI, gastrointestinal; LI, large intestine; NH, non-hematologic; SC, Sertoli cell.
Fig. 5.
Fig. 5.
Differential gene expression contributes to the cardiomyocyte CDH2 proteome. (A) Heat map of CDH2-only or CDH2/CDH1-shared expression profiles during iPSC differentiation into cardiomyocytes (CM), day 0 (D0) to day 15 (D15). (B) Heat map of CDH2-only or CDH2/CDH1-shared expression profiles in mouse tissues. Ag, adrenal gland; Br, brain; Fs, fore stomach; He, heart; Ki, kidney; Li, liver; Lin, large intestine; Lu, lung; Mu, muscle; Ov, ovary; Sin, small intestine; Sp, spleen; Te, testis; Th, thymus; Ut, uterus; Vg, vesicular gland. (C,D) Top plots: percentage of CDH2-specific, CDH1-specific or CDH2/CDH1-shared BioID class identified as cardiomyocyte enriched genes (CEGs) in human iPSCs (C) or identified as heart enriched genes (HEGs) in mouse tissue (D). Bottom plots: CDH2-specific, CDH1-specific or CDH2/CDH1-shared BioID class in the CEG and HEG categories as a fraction of the total CEG (C) and HEG (D) populations. P-value of Fisher's exact test shown to right of each bar. Significant values are in bold.
Fig. 6.
Fig. 6.
Cardiomyocyte CDH2 interactome. (A) Interaction network of CDH2 interactome organized into four tiers based using Ingenuity Pathway Analysis. All protein–protein interactions are supported by published, experimental data. Hierarchical classification was done manually around CDH2. Primary interactors bind CDH2 directly. Secondary interactors bind primary interactors but not CDH2. Tertiary interactors bind secondary interactors. Quaternary interactors bind tertiary interactors or to outermost tier proteins. Bottom left legend defines interactome or protein group classification. (B) Venn diagram between CDH2 interactome, CDH1 interactome and ICD curated proteins. (C) Distribution of interactome or protein groups within each interaction tier. (D) Distribution of tier and unconnected proteins within each group and the total collection.
Fig. 7.
Fig. 7.
CDH2 interactome proteins localize to cell–cell contacts and Z-discs. (A–F) Cardiomyocytes transfected with GFP-tagged CDH2–BioID2 hits as indicated. Cells were fixed 24 h post-transfection and stained for CDH2 and F-actin. All images are maximum projections of deconvolved z-stacks. Individual and merged GFP (green) and CDH2 (magenta) channels shown. Far right shows magnification of boxed contact in merge image. (G) Summary of GFP–CDH2–BioID2 interactome localization to cell–cell contacts, Z-discs, cytosol or other. Full circle indicates robust localization, half circle indicates modest localization. Proteins highlighted in green are unique to the CDH2 interactome. Representative images for PLEKHA6, TJP1 (paralog of TJP2), CTTN, EMD, DAAM1, LDB3, FERMT2, TMOD1, BCAR1, NEXN and FILIP1 are shown in Fig. S4. (H,I) Plot of mean±s.d. FRAP recovery fraction over time for SYNPO2 (30 FRAP regions from two independent experiments) and SVIL (18 FRAP regions from two independent experiments) at Z-discs. The data were fit to a single exponential curve (orange line). Mobile fraction (MF) percentage and recovery halftimes (t1/2) listed. (J) Dynamics of photoconverted SYNPO2-mEos3.2 in transfected cardiomyocytes. Green channel shows total SYNPO2-mEos3.2 protein. Red channel shows photoconverted protein before activation (−20 s), immediately after photoconversion [0 s (PC)] and after 320 s. Bottom montage shows a magnified view of photoconverted protein (boxed region in top right 320 s panel) over time. (K) Quantification of photoconverted SYNPO2-mEos3.2. Mean percentage of photoconverted protein (red signal) for the photoconverted area (PC region, red line), Z-disc 2–3 μm outside the photoconverted region (Proximal Z-disc, orange line) and cytoplasm 2–3 μm outside the photoconverted region (Cytoplasm, purple line) plotted over time. Dashed lines and gray region around mean define the s.e.m. Time of photoconversion marked with a blue arrow. Data is from 12 photoconverted cells from two independent experiments. Scale bars: 10 µm in A–F,J.

Similar articles

Cited by

  • Proteomics and Machine Learning-Based Approach to Decipher Subcellular Proteome of Mouse Heart.
    Fang H, Rai A, Eslami SS, Huynh K, Liao HC, Salim A, Greening DW. Fang H, et al. Mol Cell Proteomics. 2025 Apr;24(4):100952. doi: 10.1016/j.mcpro.2025.100952. Epub 2025 Mar 18. Mol Cell Proteomics. 2025. PMID: 40113211 Free PMC article.
  • Sorting of cadherin-catenin-associated proteins into individual clusters.
    Troyanovsky RB, Sergeeva AP, Indra I, Chen CS, Kato R, Shapiro L, Honig B, Troyanovsky SM. Troyanovsky RB, et al. Proc Natl Acad Sci U S A. 2021 Jul 20;118(29):e2105550118. doi: 10.1073/pnas.2105550118. Proc Natl Acad Sci U S A. 2021. PMID: 34272290 Free PMC article.
  • Use of Proximity Labeling in Cardiovascular Research.
    Kushner J, Papa A, Marx SO. Kushner J, et al. JACC Basic Transl Sci. 2021 Jul 26;6(7):598-609. doi: 10.1016/j.jacbts.2021.01.005. eCollection 2021 Jul. JACC Basic Transl Sci. 2021. PMID: 34368510 Free PMC article. Review.
  • Detecting Cardiovascular Protein-Protein Interactions by Proximity Proteomics.
    Kushner JS, Liu G, Eisert RJ, Bradshaw GA, Pitt GS, Hinson JT, Kalocsay M, Marx SO. Kushner JS, et al. Circ Res. 2022 Jan 21;130(2):273-287. doi: 10.1161/CIRCRESAHA.121.319810. Epub 2022 Jan 20. Circ Res. 2022. PMID: 35050691 Free PMC article. Review.
  • Pathogenic variants damage cell composition and single cell transcription in cardiomyopathies.
    Reichart D, Lindberg EL, Maatz H, Miranda AMA, Viveiros A, Shvetsov N, Gärtner A, Nadelmann ER, Lee M, Kanemaru K, Ruiz-Orera J, Strohmenger V, DeLaughter DM, Patone G, Zhang H, Woehler A, Lippert C, Kim Y, Adami E, Gorham JM, Barnett SN, Brown K, Buchan RJ, Chowdhury RA, Constantinou C, Cranley J, Felkin LE, Fox H, Ghauri A, Gummert J, Kanda M, Li R, Mach L, McDonough B, Samari S, Shahriaran F, Yapp C, Stanasiuk C, Theotokis PI, Theis FJ, van den Bogaerdt A, Wakimoto H, Ware JS, Worth CL, Barton PJR, Lee YA, Teichmann SA, Milting H, Noseda M, Oudit GY, Heinig M, Seidman JG, Hubner N, Seidman CE. Reichart D, et al. Science. 2022 Aug 5;377(6606):eabo1984. doi: 10.1126/science.abo1984. Epub 2022 Aug 5. Science. 2022. PMID: 35926050 Free PMC article.

References

    1. Angst B. D., Khan L. U. R., Severs N. J., Whitely K., Rothery S., Thompson R. P., Magee A. I. and Gourdie R. G. (1997). Dissociated spatial patterning of gap junctions and cell adhesion junctions during postnatal differentiation of ventricular myocardium. Circ. Res. 80, 88-94. 10.1161/01.RES.80.1.88 - DOI - PubMed
    1. Barton L. J., Soshnev A. A. and Geyer P. K. (2015). Networking in the nucleus: a spotlight on LEM-domain proteins. Curr. Opin. Cell Biol. 34, 1-8. 10.1016/j.ceb.2015.03.005 - DOI - PMC - PubMed
    1. Bass-Zubek A. E., Godsel L. M., Delmar M. and Green K. J. (2009). Plakophilins: multifunctional scaffolds for adhesion and signaling. Curr. Opin. Cell Biol. 21, 708-716. 10.1016/j.ceb.2009.07.002 - DOI - PMC - PubMed
    1. Bennett P. M., Maggs A. M., Baines A. J. and Pinder J. C. (2006). The transitional junction: a new functional subcellular domain at the intercalated disc. Mol. Biol. Cell 17, 2091-2100. 10.1091/mbc.e05-12-1109 - DOI - PMC - PubMed
    1. Borrmann C. M., Grund C., Kuhn C., Hofmann I., Pieperhoff S. and Franke W. W. (2006). The area composita of adhering junctions connecting heart muscle cells of vertebrates. II. Colocalizations of desmosomal and fascia adhaerens molecules in the intercalated disk. Eur. J. Cell Biol. 85, 469-485. 10.1016/j.ejcb.2006.02.009 - DOI - PubMed

Publication types

MeSH terms