

Systemic Factors During Metabolic Disease Progression Contribute to the Functional Decline of Adipose Tissue-Derived Mesenchymal Stem Cells in Reproductive Aged Females
- PMID: 30631282
- PMCID: PMC6315119
- DOI: 10.3389/fphys.2018.01812
Systemic Factors During Metabolic Disease Progression Contribute to the Functional Decline of Adipose Tissue-Derived Mesenchymal Stem Cells in Reproductive Aged Females
Abstract
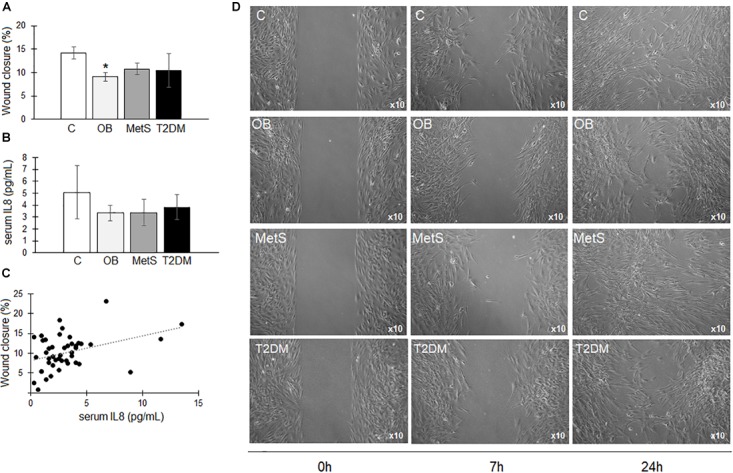
It is known that advanced metabolic disorders such as type 2 diabetes compromise the functional and regenerative capacity of endogenous adipose-tissue resident stem cells (ADSCs). It is, however, still unclear at which stage of disease progression ADSCs become compromised and whether systemic factors contribute to their functional decline. It was therefore hypothesized that inflammatory changes in the systemic microenvironment during distinct stages of disease progression negatively affect the functional capacity of ADSCs. A total of forty-seven (n = 47) black African reproductive aged females (32 ± 8 years; mean ± SD) were included in this study and subdivided into: (a) healthy lean (C; body mass index, BMI ≤ 25 kg/m2), (b) healthy overweight/obese (OB; BMI ≥ 25 kg/m2), (c) obese metabolic syndrome (MetS; BMI ≥ 30 kg/m2), and (d) type 2 diabetes mellitus (T2DM; previously diagnosed and on treatment) groups. Participants underwent anthropometric assessments and a DXA scan to determine their body composition and adipose indices. Each persons' systemic metabolic- (cholesterol, HDL, LDL, triglycerides, and blood glucose) and inflammatory profiles (CRP, SDF1α, TNFα, IL6, IL8, IL10, and IFNy) were also evaluated. Participant-derived serum was then used to treat an ADSC cell line in vitro and its effect on viability (MTT-based assay), proliferation (BrdU), migration (wound healing assay), and osteogenic differentiation assessed. When exposed to serum derived from overweight/obese individuals (with or without metabolic syndrome), both the proliferative and migratory responses of ADSCs were less pronounced than when exposed to healthy control serum. Serum IL6 concentrations were identified as a factor influencing the proliferation of ADSCs, suggesting that long-term disruption to the systemic cytokine balance can potentially disrupt the proliferative responses of ADSCs. Obese participant-derived serum (with and without metabolic syndrome) furthermore resulted in lipid accumulation during osteogenic differentiation. This study, therefore demonstrated that systemic factors in obese individuals, regardless of the presence of metabolic syndrome, can be detrimental to the multifunctional properties of ADSCs.
Keywords: adipogenesis; adipose tissue; body composition; cytokines; interleukin 6; mesenchymal stem cells; obesity; osteogenesis.
Figures


Similar articles
-
ADSC-conditioned media elicit an ex vivo anti-inflammatory macrophage response.J Mol Endocrinol. 2018 Oct 15;61(4):173-184. doi: 10.1530/JME-18-0078. J Mol Endocrinol. 2018. PMID: 30038054
-
Effects of Sepsis Serum on the Fate of Adipose Tissue-Derived Stem Cells.Front Biosci (Landmark Ed). 2023 Apr 6;28(4):72. doi: 10.31083/j.fbl2804072. Front Biosci (Landmark Ed). 2023. PMID: 37114535
-
Obesity Determines the Immunophenotypic Profile and Functional Characteristics of Human Mesenchymal Stem Cells From Adipose Tissue.Stem Cells Transl Med. 2016 Apr;5(4):464-75. doi: 10.5966/sctm.2015-0161. Epub 2016 Mar 8. Stem Cells Transl Med. 2016. PMID: 26956208 Free PMC article.
-
Uncovering the link between diabetes and cardiovascular diseases: insights from adipose-derived stem cells.Can J Physiol Pharmacol. 2024 Apr 1;102(4):229-241. doi: 10.1139/cjpp-2023-0282. Epub 2024 Jan 10. Can J Physiol Pharmacol. 2024. PMID: 38198660 Review.
-
Adipose-Derived Stem Cell: "Treat or Trick".Biomedicines. 2021 Nov 5;9(11):1624. doi: 10.3390/biomedicines9111624. Biomedicines. 2021. PMID: 34829853 Free PMC article. Review.
Cited by
-
A review of adipose-derived mesenchymal stem cells' impacts and challenges: metabolic regulation, tumor modulation, immunomodulation, regenerative medicine and genetic engineering therapies.Front Endocrinol (Lausanne). 2025 May 29;16:1606847. doi: 10.3389/fendo.2025.1606847. eCollection 2025. Front Endocrinol (Lausanne). 2025. PMID: 40510466 Free PMC article. Review.
-
Diagnostic significance of serum PP4R1 and its predictive value for the development of chronic complications in patients with type 2 diabetes mellitus.Diabetol Metab Syndr. 2021 Mar 9;13(1):27. doi: 10.1186/s13098-021-00642-7. Diabetol Metab Syndr. 2021. PMID: 33750415 Free PMC article.
References
LinkOut - more resources
Full Text Sources
Research Materials
Miscellaneous