. 2018 Oct;2(10):765-777.
doi: 10.1038/s41562-018-0420-6. Epub 2018 Sep 3.

A mechanistic model of connector hubs, modularity and cognition

Affiliations

A mechanistic model of connector hubs, modularity and cognition

Maxwell A Bertolero et al. Nat Hum Behav. 2018 Oct.

Abstract

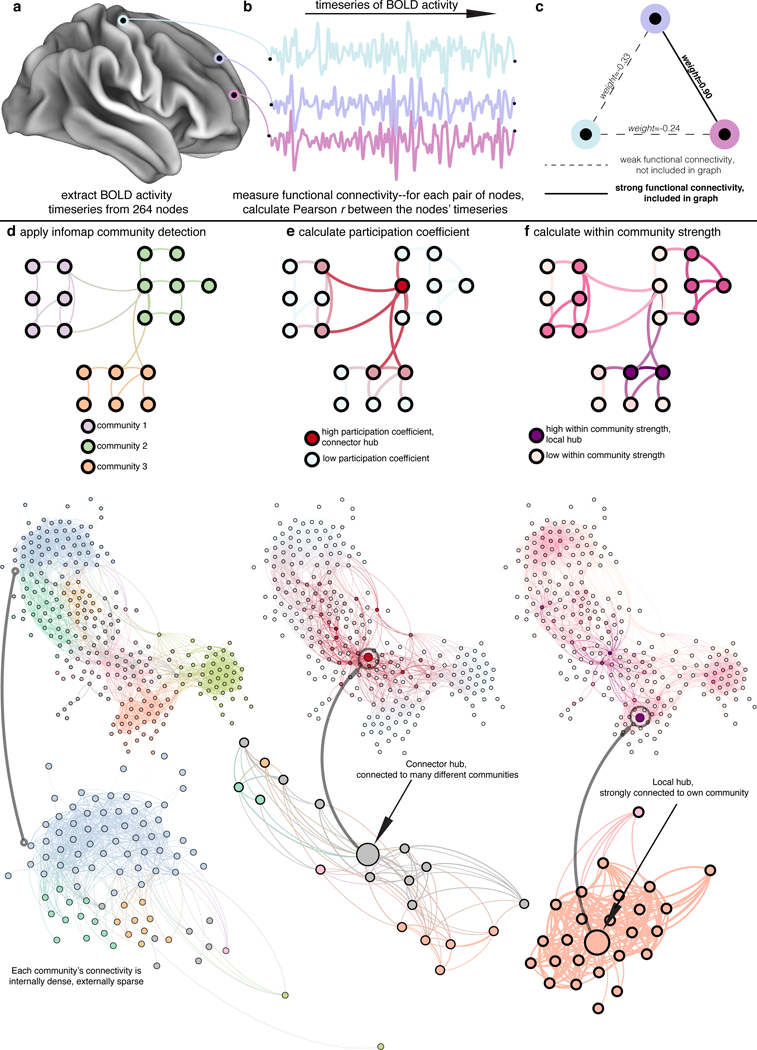
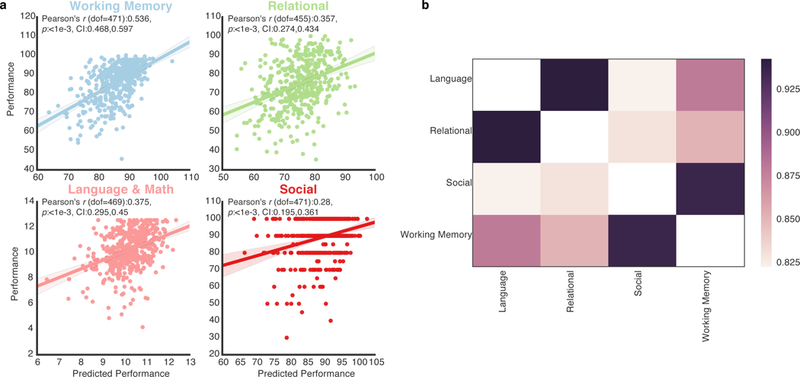
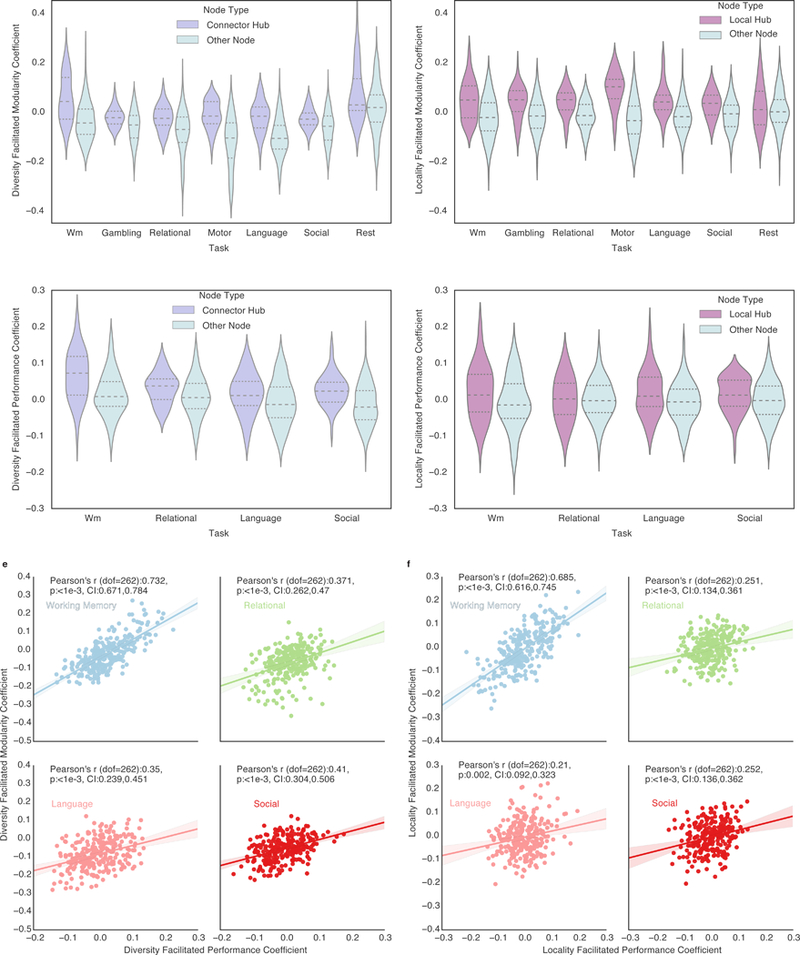
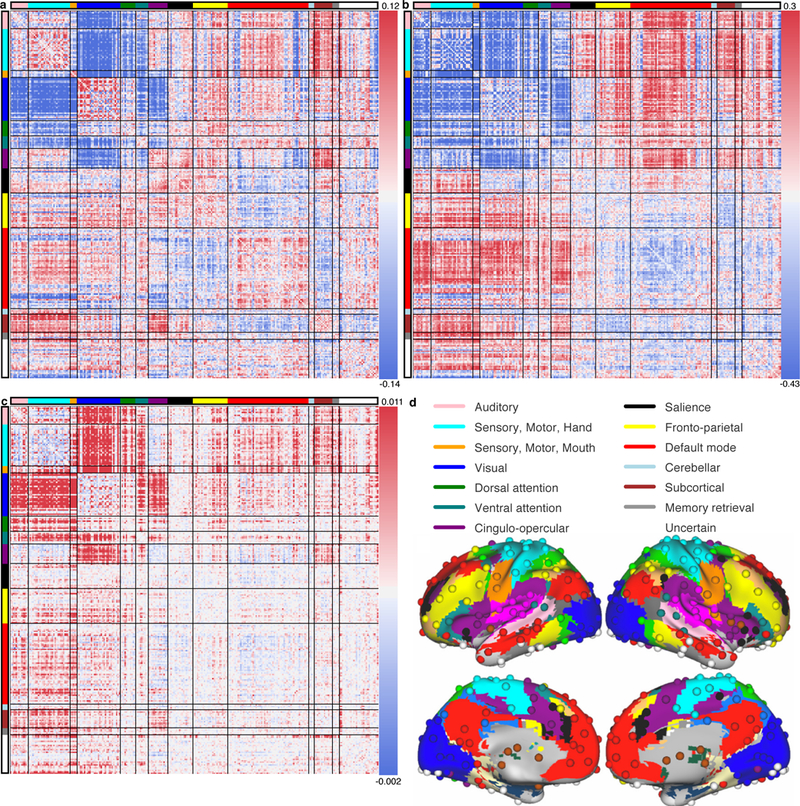
The human brain network is modular-comprised of communities of tightly interconnected nodes1. This network contains local hubs, which have many connections within their own communities, and connector hubs, which have connections diversely distributed across communities2,3. A mechanistic understanding of these hubs and how they support cognition has not been demonstrated. Here, we leveraged individual differences in hub connectivity and cognition. We show that a model of hub connectivity accurately predicts the cognitive performance of 476 individuals in four distinct tasks. Moreover, there is a general optimal network structure for cognitive performance-individuals with diversely connected hubs and consequent modular brain networks exhibit increased cognitive performance, regardless of the task. Critically, we find evidence consistent with a mechanistic model in which connector hubs tune the connectivity of their neighbors to be more modular while allowing for task appropriate information integration across communities, which increases global modularity and cognitive performance.


Figures

Figure 1 |
Figure 1 |. Functional connectivity and network science processing workflow.
a, The mean signal across time is extracted from 264 cortical, sub-cortical, and cerebellar regions, three of which are shown here. b, The time series of the three nodes is shown. To measure functional connectivity, the Pearson r correlation coefficient between the time series of node i and the time series of node j for all i and j is calculated. c, The strongest (e.g., the top 5% percent r values) functional connections serve as weighted edges in the graph (a range of graph densities was explored, see Methods for details). d, The Infomap community detection algorithm is applied, generating a community assignment for each node, displayed here in different colors in a schematic (top) and the mean graph across subjects (bottom). e, Given that particular community assignment and network, nodes’ participation coefficients are calculated. Red nodes are high participation coefficient nodes, shown here in a schematic (top) and the mean graph (bottom). f, Within community strengths are also calculated. Purple nodes are high within community strength nodes, shown here in a schematic (top) and the mean graph (bottom). The graphs along the bottom are laid out using the force-atlas algorithm, where nodes are repelling magnets and edges are springs, which causes nodes in the same community to cluster together, nodes that are diversely connected across communities (connector hubs) to be in the center of the graph, and nodes that are strongly connected to a single community (local hubs) in the middle of that community. d, lower, A single community (light blue) and its connections to the rest of the graph is extracted and enlarged, with nodes colored by community. Note that the nodes within each community are more strongly connected to each other than to nodes in other communities. e, lower, A node (and its connections) with a high participation coefficient is extracted and enlarged, with nodes colored by community. Note that the connector hub is connected to many different communities. f, A node (and its connections) with a high within community strength is extracted and enlarged, with nodes colored by community. Note that the local hub is strongly connected to its own community.
Figure 2 |
Figure 2 |. Hub diversity and locality, modularity, and network connectivity predict cognitive performance.
a, for each task, the correlation between task performance and the performance predicted by a predictive model of hub diversity and locality, modularity, and network connectivity. Each data point represents the (y-axis) true performance (see Methods, each task’s performance value scale is unique) of the subject and the (x-axis) predicted performance of the subject by the neural network. Shaded areas represent 95 percent confidence intervals. In every task, the predictive model significantly predicted task performance (p < 1e-3, Bonferroni corrected (n tests=4), N=Working Memory: 473, Relational: 457, Language & Math: 471, Social: 473). b, we correlated the tasks’ feature correspondence values (see Supplementary Figure 3 for each task’s feature correspondence with each subject measure)—measuring if the two tasks’ optimal hub and network structures are also optimal for the same subject measures. High correlations mean that the two tasks’ hub and network structures are similarly optimal for the same subject measures (all results significant at p < 1e-3, Bonferroni corrected (n tests = 4), dof=45, N=47, the number of subject measures, while the feature correspondence N =Working Memory: 473, Relational: 457, Language & Math: 471, Social: 473).
Figure 3 |
Figure 3 |. Connector hubs and local hubs concurrently facilitate increased modularity and task performance.
For each task, diversity and locality facilitated modularity coefficients, a measure of how the diversity and locality (respectively) of a node facilitates modularity, were calculated. In every task, the diversity and locality facilitated modularity coefficients of connector (a) and local hubs (b), compared to other nodes, is significantly (except Resting-State for locality) higher, demonstrating that strong connector and local hubs facilitate the modular structure of brain networks. For each task, diversity and locality facilitated performance coefficients were calculated. In every task the diversity and locality facilitated performance coefficients of connector (c) and local hubs (d), compared to other nodes, is significantly (except Language for diversity (p=0.0677 after Bonferroni correction (uncorrected p=0.0169)), Relational and Social for locality) higher, demonstrating that strong connector and local hubs facilitate increased task performance. For a-d, the mean and quartiles are marked in each violin. Each task’s distribution of coefficients was tested for normality using D’Agostino and Pearson’s omnibus test k2. No evidence was found (k2>0.0 for all tasks) that these distributions were not normal. N=264, the number of nodes in the graph. e, The correlation between a node’s diversity facilitated modularity coefficient and a node’s diversity facilitated performance coefficient. f, The correlation between the node’s locality facilitated modularity coefficient and the node’s locality facilitated performance coefficient. In panels e,f, N=264, the number of nodes in the graph. Shaded areas represent 95 percent confidence intervals. All p values are Bonferroni corrected (n tests = 4).
Figure 4 |
Figure 4 |. Connectivity between primary sensory, motor, dorsal attention, ventral attention, and cingulo-opercular communities mediate the relationship between connector hubs and modularity.
a, Each entry is the Pearson correlation coefficient, r, across subjects (N=476), between modularity (Q) and that edge’s weights. b, For each connector hub, the Pearson r between the hub’s participation coefficients and each edge’s weights across subjects (N=476) was calculated. The matrix in b is the mean of those matrices across connector hubs. c, To investigate the relationship between connector hubs’ participation coefficients, edge weights, and Q, a mediation analysis was performed for each connector hub, with an edge’s weights mediating the relationship between the connector hub’s participation coefficients and Q indices (N=476). Each edge’s mean mediation value between connector hubs’ participation coefficients and Q is shown. d, The anatomical locations of each node and community on the cortical surface,.

Comment in

References

    1. Bertolero MA, Yeo BTT, Yeo BTT, D’Esposito M & D’Esposito M The modular and integrative functional architecture of the human brain. Proc. Natl. Acad. Sci. U.S.A. 112, E6798–807 (2015). - PMC - PubMed
    1. Bertolero MA, Yeo BTT & Desposito M The diverse club. Nature Communications 8, 1277 (2017). - PMC - PubMed
    1. Guimerà R, Guimera R, Amaral LAN & Amaral L Functional cartography of complex metabolic networks. Nature 433, 895–900 (2005). - PMC - PubMed
    1. Meunier D, Lambiotte R & Bullmore ET Modular and hierarchically modular organization of brain networks. Front. Neurosci. 4, 200 (2010). - PMC - PubMed
    1. Bertolero MA, Yeo BTT & Desposito M The diverse club. Nature Communications 8, 1–10 (2017). - PMC - PubMed