. 2019 Apr;47(3):544-560.
doi: 10.3758/s13421-018-0890-9.

Breaking the perceptual-conceptual barrier: Relational matching and working memory

Affiliations

Breaking the perceptual-conceptual barrier: Relational matching and working memory

J David Smith et al. Mem Cognit. 2019 Apr.

Abstract

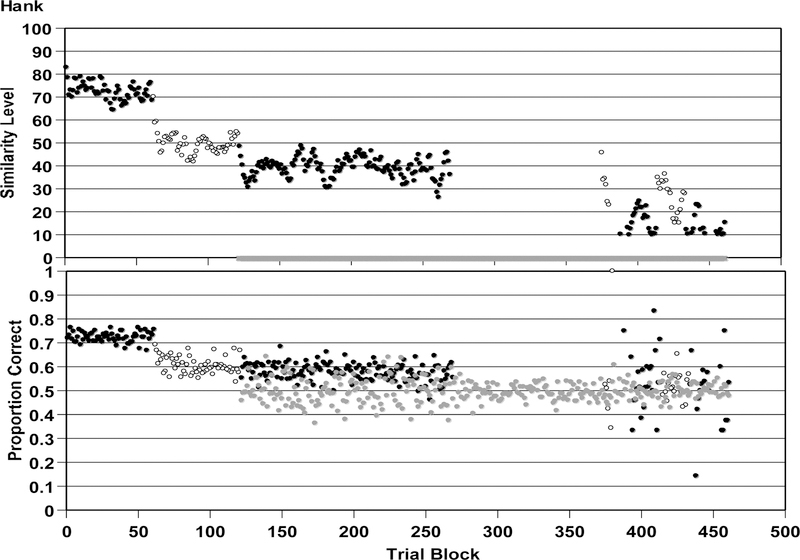
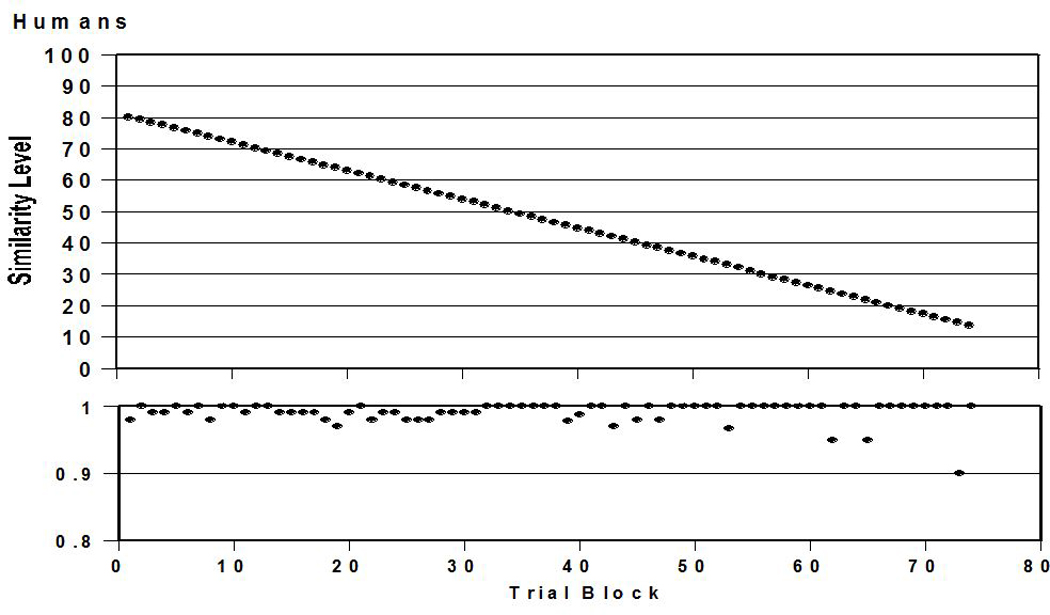
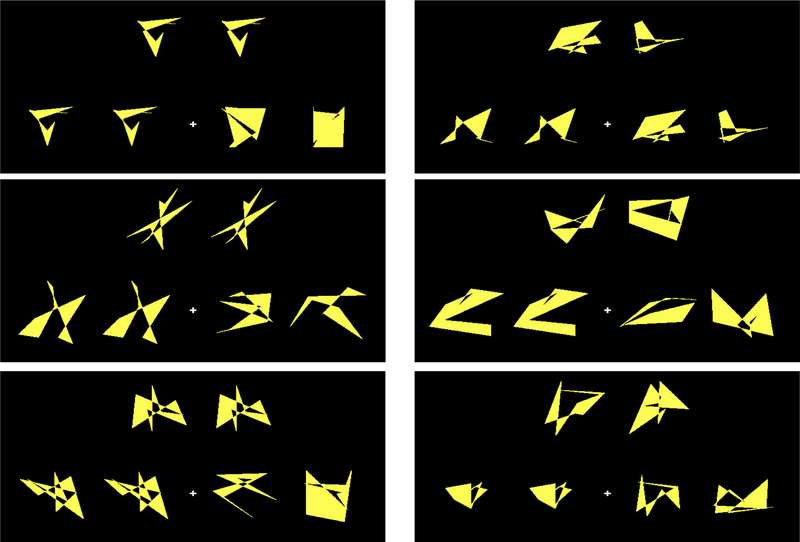
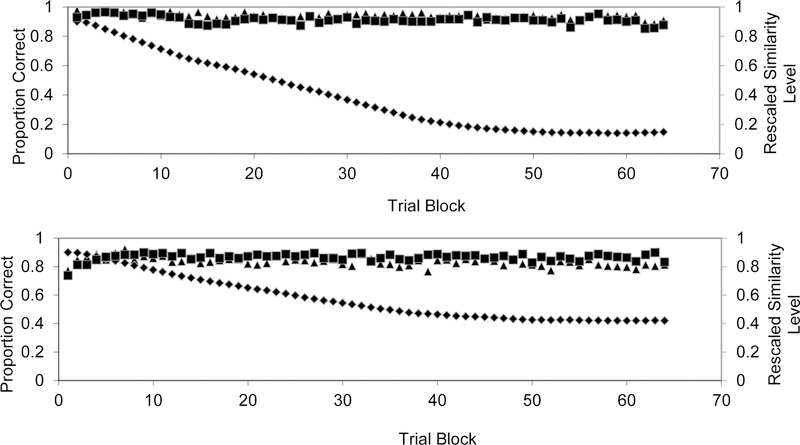
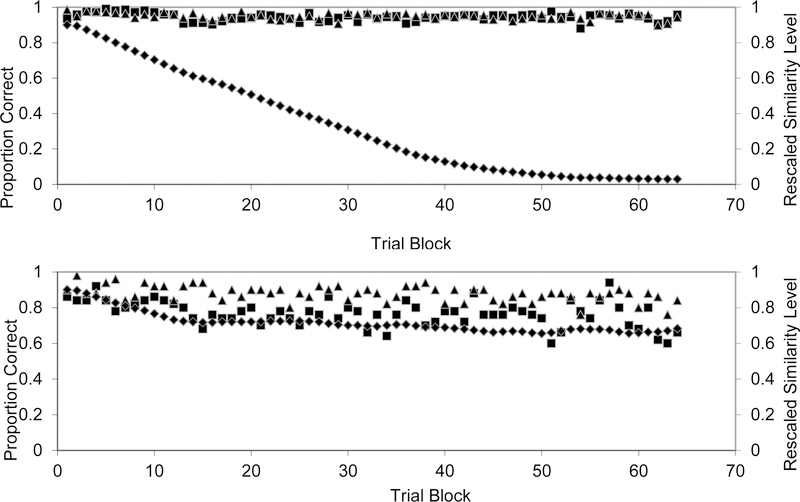
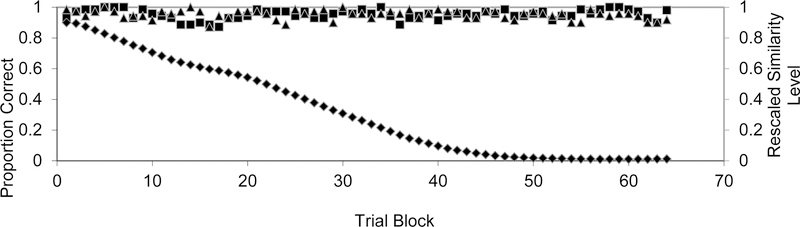
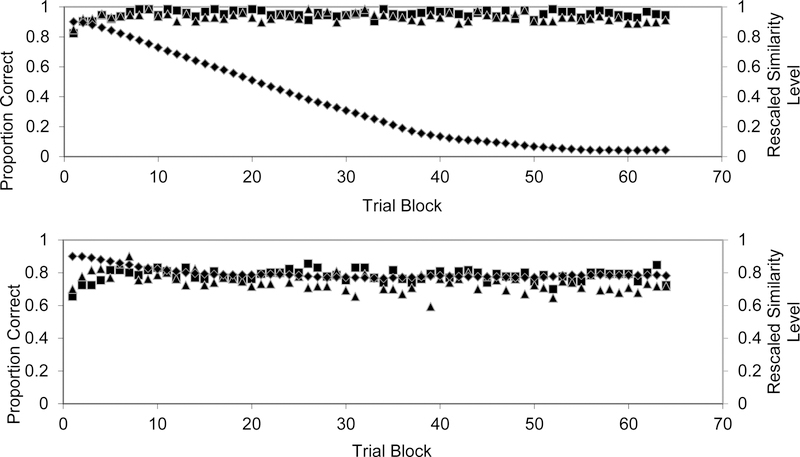
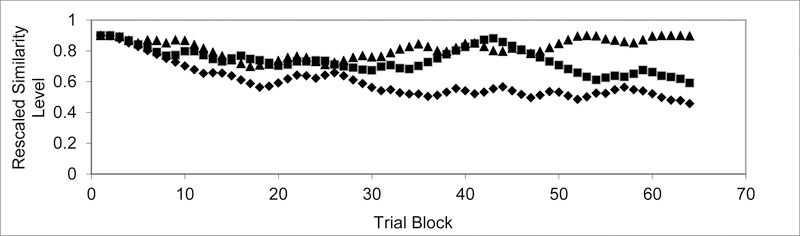
Cognitive, comparative, and developmental psychologists have long been interested in humans' and animals' ability to respond to abstract relations, as this ability may underlie important capacities like analogical reasoning. Cross-species research has used relational matching-to-sample (RMTS) tasks in which participants try to find stimulus pairs that "match" because they both express the same abstract relation (same or different). Researchers seek to understand the cognitive processes that underlie successful matching performance. In the present RMTS paradigm, the abstract-relational cue was made redundant with a first-order perceptual cue. Then the perceptual cue faded, requiring participants to transition from a perceptual to a conceptual approach by realizing the task's abstract-relational affordance. We studied participants' ability to make this transition with and without a working-memory load. The concurrent load caused participants to fail to break the perceptual-conceptual barrier unless the load was abandoned. We conclude that finding the conceptual solution depends on reconstruing the task using cognitive processes that are especially reliant on working memory. Our data provide the closest existing look at this cognitive reorganization. They raise important theoretical issues for cross-species comparisons of relational cognition, especially regarding animals' limitations in this domain.

Keywords: Analogies; Comparative cognition; Explicit cognition; Relational judgments; Same–different.


Conflict of interest statement

The authors declare no conflicts of interest.

Figures

Figure 1.
Figure 1.
The monkey Hank’s performance by 250-trial block in Smith et al.’s (2013) RMTS task. Top: The level of perceptual support given to Hank. These levels are defined in the text. The black and white symbols denote different fostering conditions Smith et al. tried to help Hank’s RMTS performance. The gray symbols indicate the trial blocks during which trials were interspersed that offered Hank no perceptual support and demanded a conceptual or relational strategy from him. Bottom: Hank’s proportion correct for all trials in each trial block, depicted as already described. Adapted from “Fading perceptual resemblance: A path for rhesus macaques (Macaca mulatta) to conceptual matching?” by J. D. Smith, T. M. Flemming, J. Boomer, M. J. Beran, & B. Church, 2013, Cognition, 129, 598–614. Copyright Elsevier Ltd. 2013. Reprinted with permission.
Figure 2.
Figure 2.
Humans’ performance by 10-trial block in the RMTS task of Smith et al. (2013). Top: The average level of perceptual support they experienced at each trial block. The definition of these levels of perceptual support is given in the text. Bottom: Humans’ proportion correct for trials in each trial block. Adapted from “Fading perceptual resemblance: A path for rhesus macaques (Macaca mulatta) to conceptual matching?” by J. D. Smith, T. M. Flemming, J. Boomer, M. J. Beran, & B. Church, 2013, Cognition, 129, 598–614. Copyright Elsevier Ltd. 2013. Reprinted with permission.
Figure 3.
Figure 3.
Examples of trials from the relational match-to-sample (RMTS) task. The left column shows same trials, with the level of perceptual support set at 90, 42, and 18. These similarity levels are defined in the text. The right column shows different trials set at the same levels of perceptual support. For clarity, the same and different choice options, respectively, are always shown to the left and right on the bottom of each black screen. These positional assignments were varied randomly for each trial type in the actual RMTS task.
Figure 4.
Figure 4.
Top. The performance of Control participants in the relational-matching task by 5-trial block. Diamonds show the progression of decreasing first-order perceptual similarity between the sample and the correct choice alternative. This was measured, as described in the text, as the extent to which the vertices of two complex polygons were different in coordinate space. Squares show participants’ proportion correct in the matching task. Triangles show their proportion correct on the number-memory task that alternated with the matching task. Bottom. The performance of Concurrent participants in the relational-matching task, depicted in the same way. In this case, the matching and memory tasks were interleaved in a way that caused the matching task cognitive interference.
Figure 5.
Figure 5.
Top. The performance of a sub-group of Control participants in the relational-matching task, depicted as described in the caption to Figure 4. Bottom. The performance of another sub-group of Control participants, depicted in the same way.
Figure 6.
Figure 6.
The performance of 14 strong Control participants in the relational-matching task, depicted as described in the caption to Figure 4. Even they experience a distinctive period of cognitive reorganization, during the time in which they abandon the perceptual cue and adopt a relational strategy instead. The drop in matching performance (Squares) and the shoulder in decreasing similarity levels (Diamonds) reflect this reorganization.
Figure 7.
Figure 7.
Top. The performance of a sub-group of Concurrent participants in the relational-matching task, depicted as described in the caption to Figure 4. Bottom. The performance of another sub-group of Concurrent participants, depicted in the same way.
Figure 8.
Figure 8.
Three selected profiles of similarity level changing by trial block through the experimental session. Participants, by turns, hit their perceptual-conceptual barrier and stalled there (diamond symbols), or hit their barrier and retreated from there (triangle symbols), or tried to break through their perceptual-conceptual barrier twice (square symbols).
Figure 9.
Figure 9.
Top. The performance of Control participants in the relational-matching task (black squares) and the number-memory task (gray triangles) across the 20 blocks as the perceptual cue rapidly faded. Bottom. The performance of Concurrent participants depicted in the same way.
Figure 10.
Figure 10.
Top. The performance of Control participants in the relational-matching task (black squares) and the number-memory task (gray triangles), aligned by participants’ worst block of matching performance (position 0). Bottom. The performance of Concurrent participants depicted in the same way.
Figure 11.
Figure 11.
Top. The observed performance (black symbols) of Human H01 in the relational-matching task of Fagot et al. (2001). The proportion of same responses is plotted against the level of visual entropy in the stimulus sample for the trial (a measure of the extent to which the 16 clipart icons in the 16-item array were visually variable). The best-fitting predictions of Fagot et al.’s formal model are also shown (gray symbols). Bottom. The observed performance of Baboon B03 in the equivalent relational-matching task, depicted in the same way. Adapted from “Discriminating the relation between relations: The role of entropy in abstract conceptualization by baboons (Papio papio) and humans (Homo sapiens)” by J. Fagot, E. A. Wasserman., & M. E. Young, 2001, Journal of Experimental Psychology: Animal Behavior Processes, 27, 316–328. Reprinted with permission.
Figure 12.
Figure 12.
Top. The observed performance (black symbols) of humans in the same-different task of Experiment 1B in Smith, Redford, Hass et al. (2008). The proportion of Same responses is plotted against stimulus disparity (a measure of the extent to which the vertices of two complex polygons are different in coordinate space). The best-fitting predictions of a standard signal-detection formal model are also shown (gray symbols). Bottom. The observed performance of Monkey Lou in the equivalent same-different task, depicted in the same way. From “The comparative psychology of same-different judgments by humans (Homo sapiens) and monkeys (Macaca mulatta),” by J. D. Smith, J. S. Redford, S. M. Haas, M. V. C. Coutinho, & J. J. Couchman, 2008, Journal of Experimental Psychology: Animal Behavior Processes, 34, 365–370. Reprinted with permission.

Similar articles

Cited by

References

    1. Ashby FG, Alfonso-Reese LA, Turken AU & Waldron EM (1998). A neuropsychological theory of multiple systems in category learning. Psychological Review, 105, 442–481. 10.1037/0033-295X.105.3.442 - DOI - PubMed
    1. Ashby FG & Ell SW (2001). The neurobiology of human category learning. Trends in Cognitive Sciences, 5, 204–210. 10.1016/S1364-6613(00)01624-7 - DOI - PubMed
    1. Brooks DI, & Wasserman EA (2008). Same/different discrimination learning with trial-unique stimuli. Psychonomic Bulletin & Review, 15, 644–650. 10.3758/PBR.15.3.644 - DOI - PubMed
    1. Brown RG, & Marsden CD (1988). Internal versus external cures and the control of attention in Parkinson’s disease. Brain, 111, 323–345. 10.1093/brain/111.2.323 - DOI - PubMed
    1. Carter DE, & Werner TJ (1978). Complex learning and information processing by pigeons: A critical analysis. Journal of the Experimental Analysis of Behavior, 29, 565–601. 10.3758/LB.37.2.204 - DOI - PMC - PubMed

Publication types

LinkOut - more resources