

Digital Pain Drawings Can Improve Doctors' Understanding of Acute Pain Patients: Survey and Pain Drawing Analysis
- PMID: 30632970
- PMCID: PMC6329897
- DOI: 10.2196/11412
Digital Pain Drawings Can Improve Doctors' Understanding of Acute Pain Patients: Survey and Pain Drawing Analysis
Erratum in
-
Figure Correction: Digital Pain Drawings Can Improve Doctors' Understanding of Acute Pain Patients: Survey and Pain Drawing Analysis.JMIR Mhealth Uhealth. 2019 Sep 27;7(9):e16017. doi: 10.2196/16017. JMIR Mhealth Uhealth. 2019. PMID: 31573932 Free PMC article.
Abstract
Background: Pain drawings (PDs) are an important tool to evaluate, communicate, and objectify pain. In the past few years, there has been a shift toward tablet-based acquisition of PDs, and several studies have been conducted to test the usefulness, reliability, and repeatability of electronic PDs. However, to our knowledge, no study has investigated the potential role of electronic PDs in the clinical assessment and treatment of inpatients in acute pain situations.
Objective: The aim of this study was to evaluate whether knowledge of the patients' electronic PD has the potential to improve the doctors' understanding of their patients and to influence their clinical decision making. Furthermore, we sought to identify differences between electronic PDs of patients and their treating pain specialists in an acute pain situation and to find those specific characteristics derived from the PDs that had the largest impact on doctors' understanding.
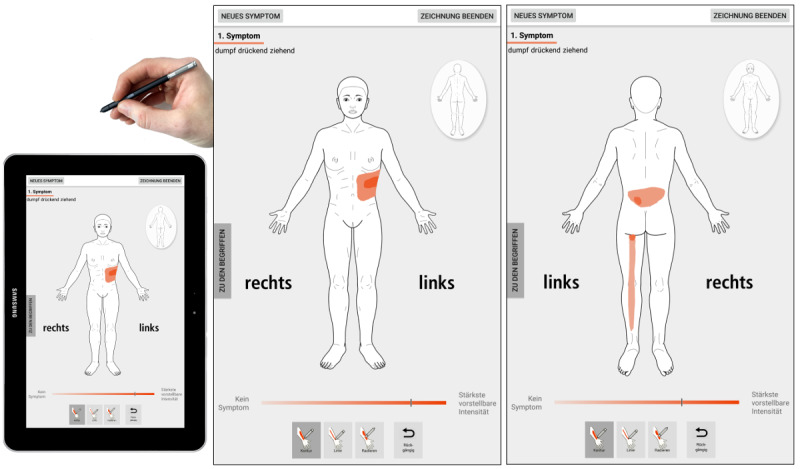
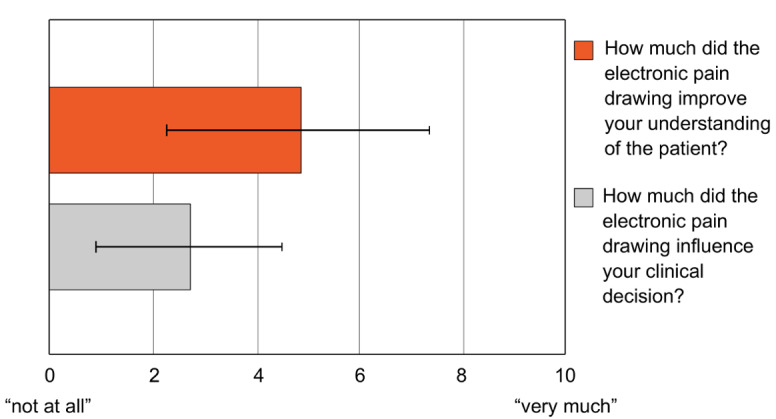
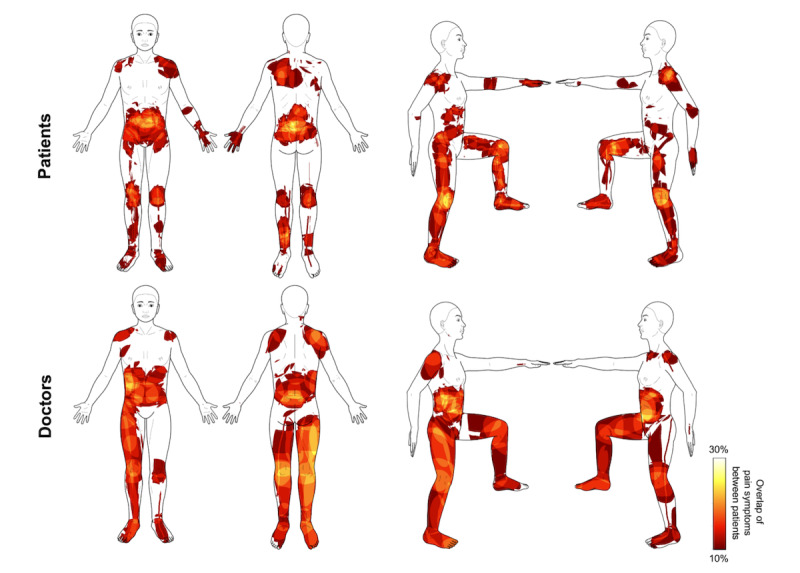
Methods: We obtained electronic PDs from 47 inpatients in acute pain situations before their consultation with a pain specialist on a tablet personal computer with a stylus. Before looking at their patients' drawings, these specialists drew their own conception of the patients' pain after anamnesis and physical examination. Patients' drawings were then revealed to the doctors, and they were asked to evaluate how much the additional information improved their understanding of the case and how much it influenced their clinical decision on an 11-point Likert scale (0="not at all" and 10="very much"). Similarities and differences of patients' and doctors' PDs were assessed by visual inspection and by calculating Jaccard index and intraclass correlation coefficient (ICC) of the pain area and the number of pain clusters. Exploratory analyses were conducted by means of correlation tables to identify specific factors that influenced doctors' understanding.
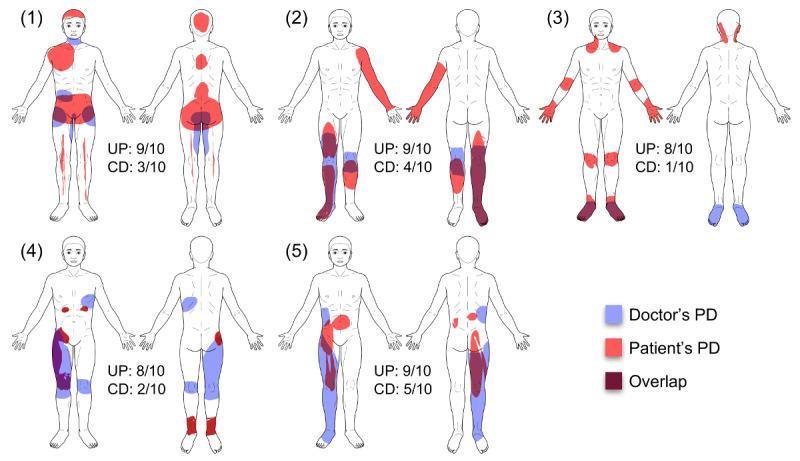
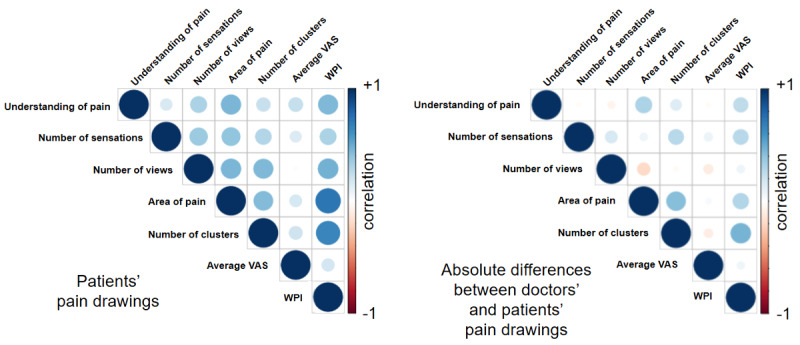
Results: Patients' PDs significantly improved the doctors' understanding (mean score 4.81, SD 2.60, P<.001) and to a lesser extent their clinical decision (mean 2.68, SD 1.18, P<.001). Electronic PDs of patients and doctors showed fair to good similarity for pain extent (r=.454, P=.001) and widespreadness (P=.447, r=.002) were important factors helping doctors to understand their patients.
Conclusions: In a clinical setting, electronic PDs can improve doctors' understanding of patients in acute pain situations. The ability of electronic PDs to visualize differences between doctors' and patients' conception of pain has the potential to improve doctor-patient communication.
Keywords: acute pain; app; eHealth; manikins; pain drawing; symptom drawing; tablet computers.
©Nour Shaballout, Anas Aloumar, Till-Ansgar Neubert, Martin Dusch, Florian Beissner. Originally published in JMIR Mhealth and Uhealth (http://mhealth.jmir.org), 10.01.2019.
Conflict of interest statement
Conflicts of Interest: None declared.
Figures
References
-
- Giordano J, Abramson K, Boswell MV. Pain assessment: subjectivity, objectivity, and the use of neurotechnology. Pain Physician. 2010;13(4):305–15. http://www.painphysicianjournal.com/linkout?issn=1533-3159&vol=13&page=305 - PubMed
-
- Palmer H. Pain charts; a description of a technique whereby functional pain may be diagnosed from organic pain. N Z Med J. 1949 Apr;48(264):187–213. - PubMed
-
- Serif T, Ghinea G. Recording of time-varying back-pain data: a wireless solution. IEEE Trans Inf Technol Biomed. 2005 Sep;9(3):447–58. - PubMed
Publication types
MeSH terms
LinkOut - more resources
Full Text Sources
Medical
Miscellaneous
