. 2019 Jan 10;176(1-2):98-112.e14.
doi: 10.1016/j.cell.2018.11.046.

Circulating Tumor Cell Clustering Shapes DNA Methylation to Enable Metastasis Seeding

Affiliations

Circulating Tumor Cell Clustering Shapes DNA Methylation to Enable Metastasis Seeding

Sofia Gkountela et al. Cell. .

Abstract

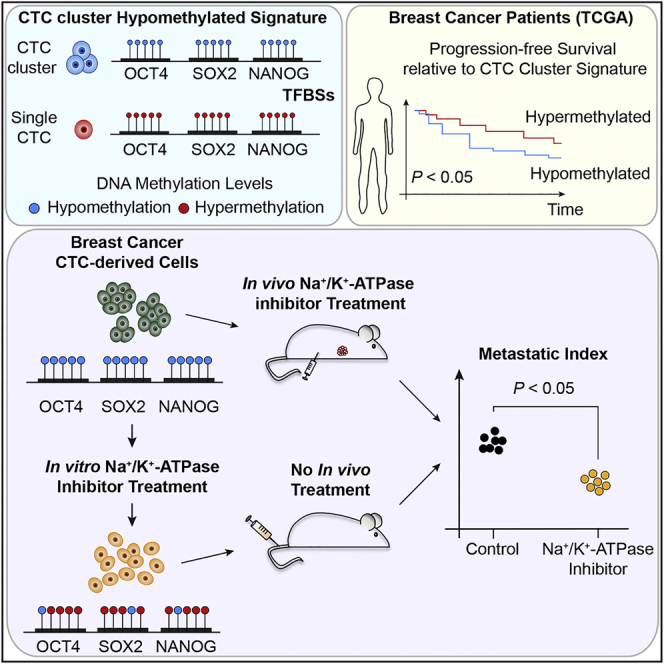
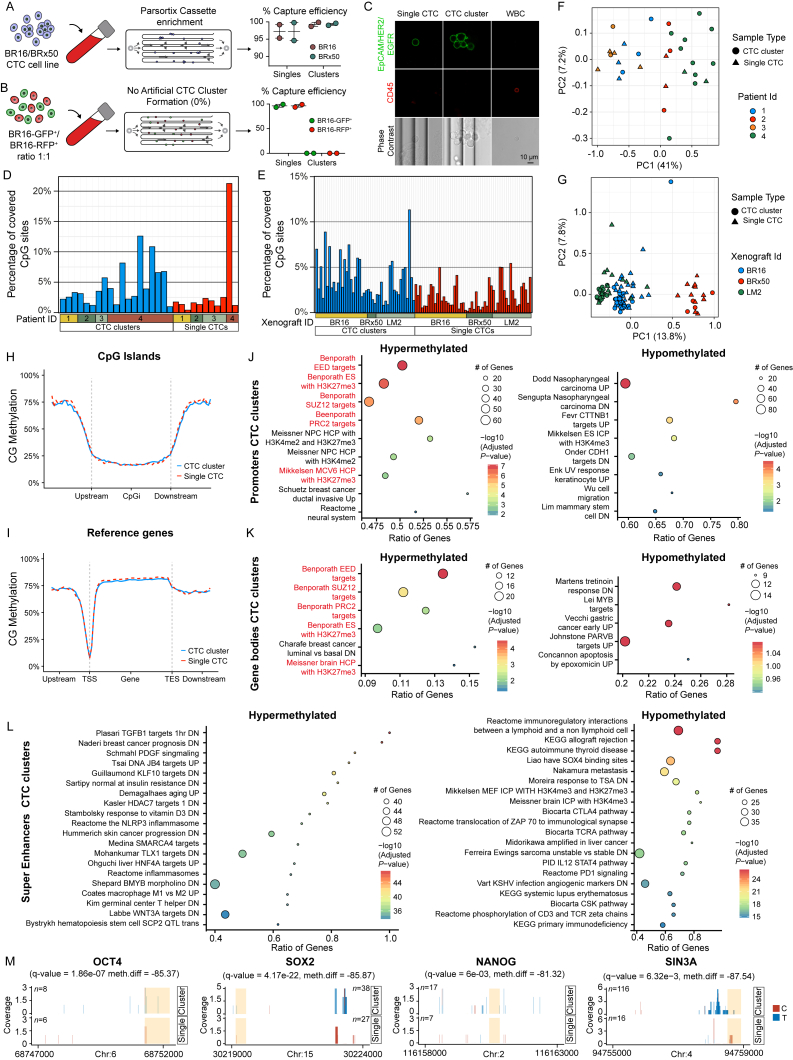
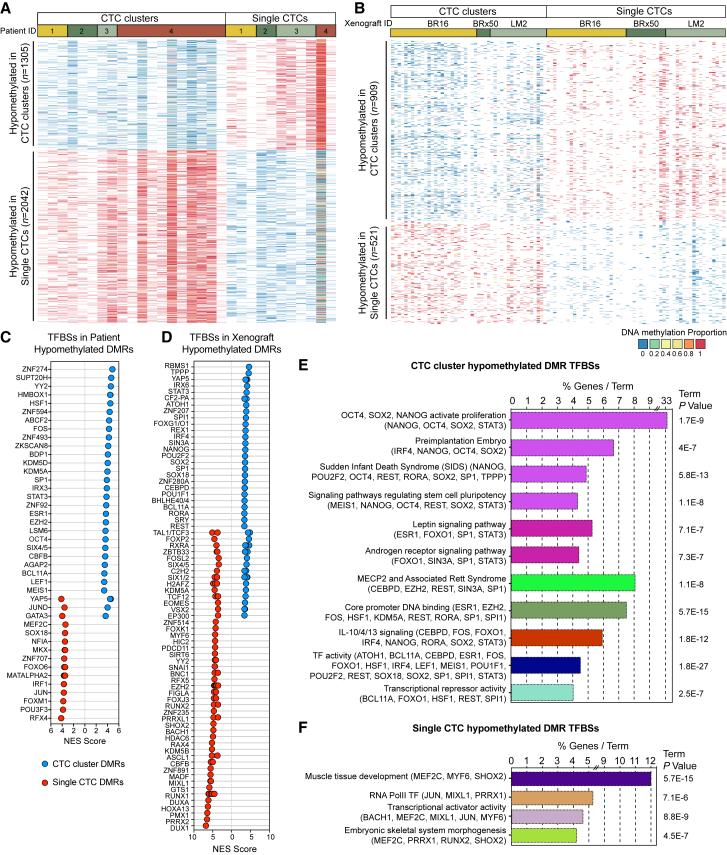
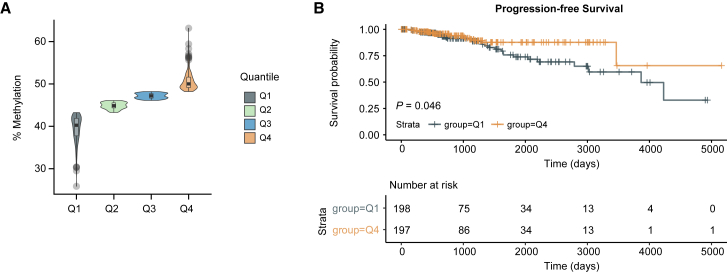
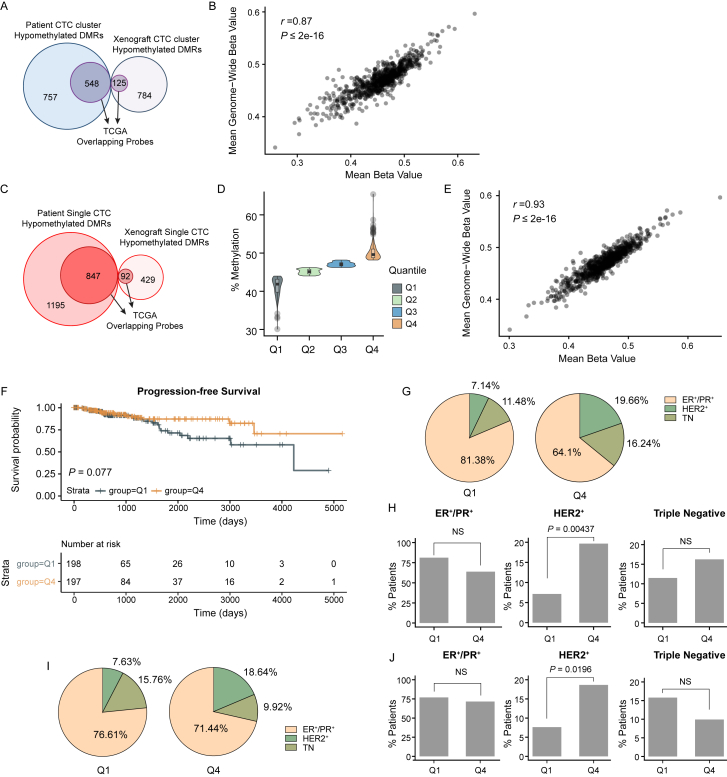
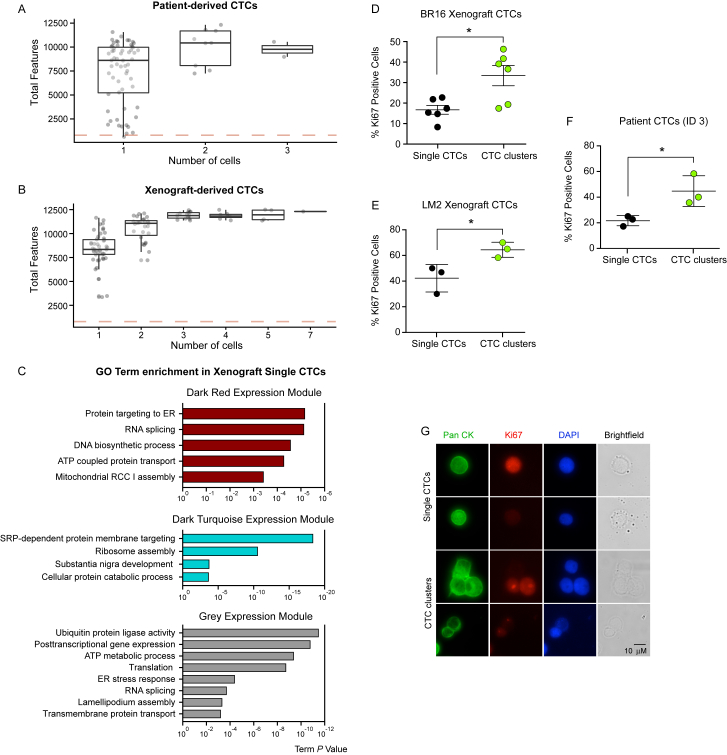
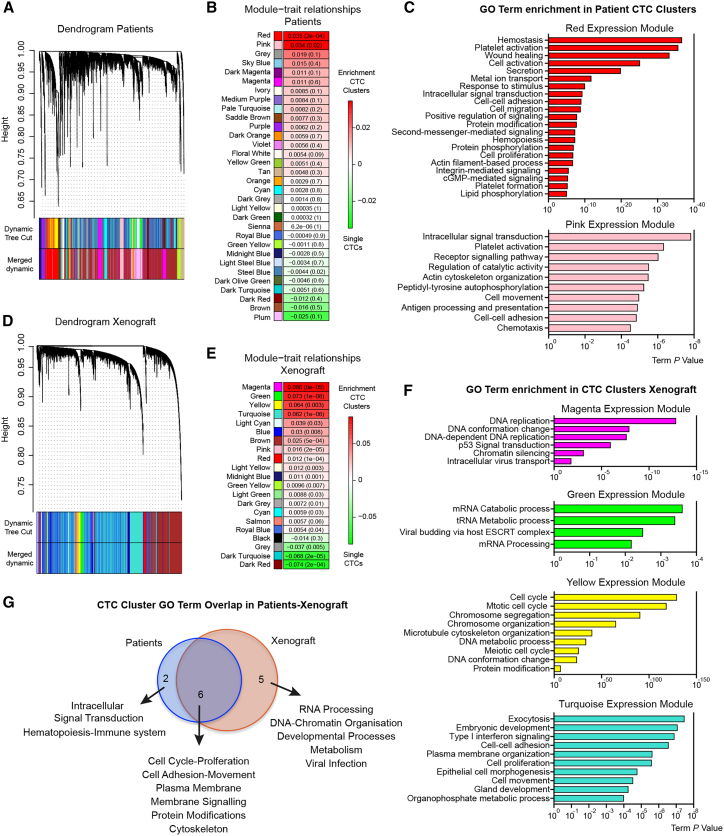
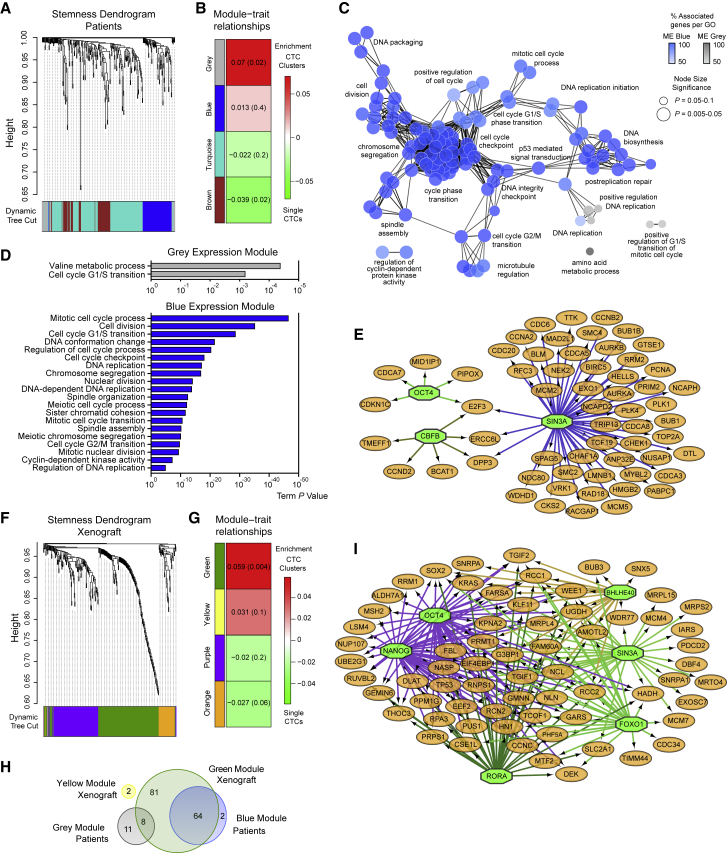
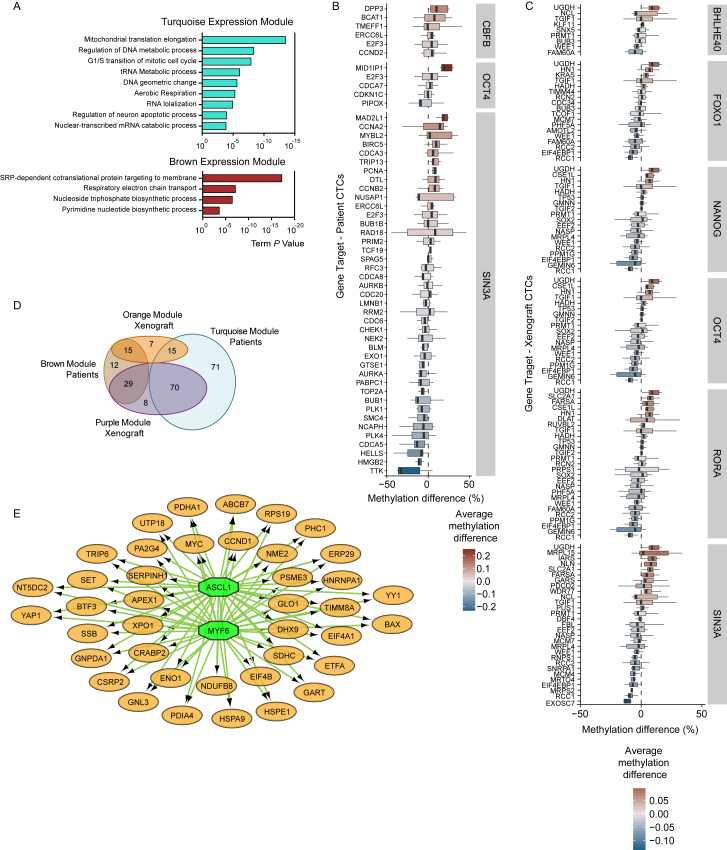
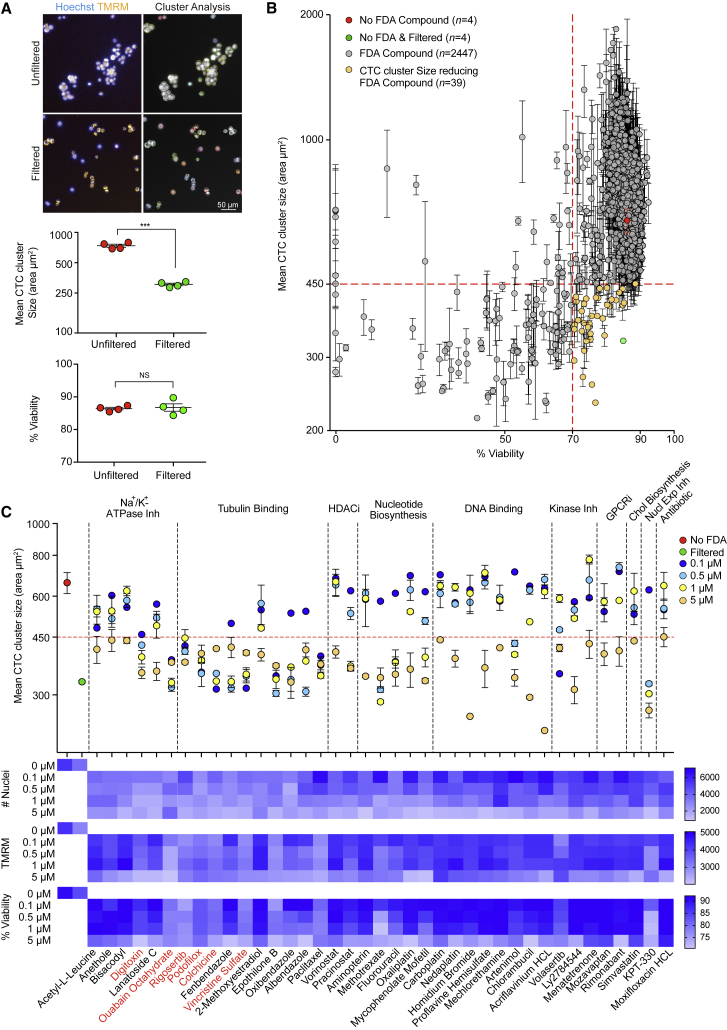
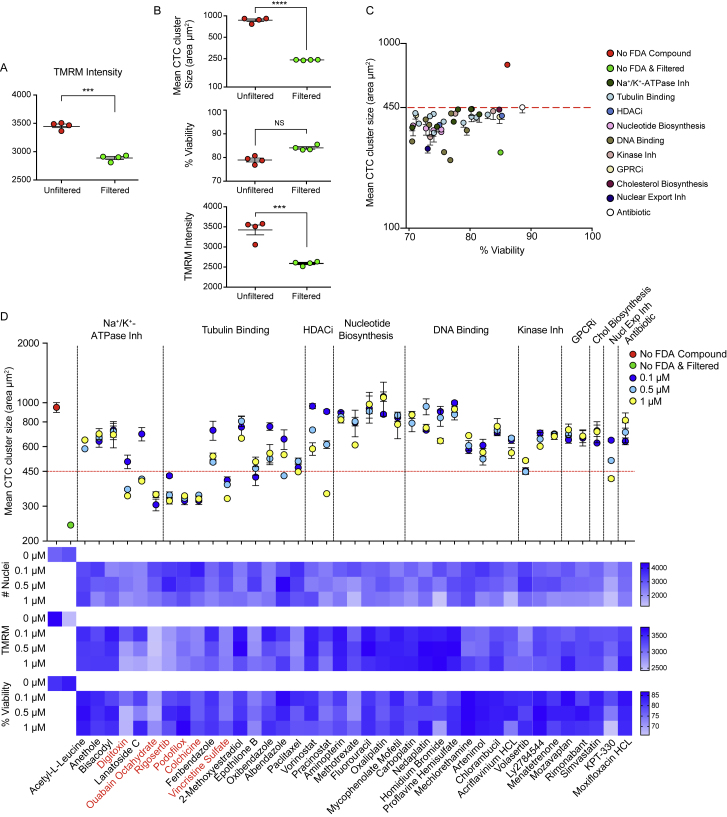
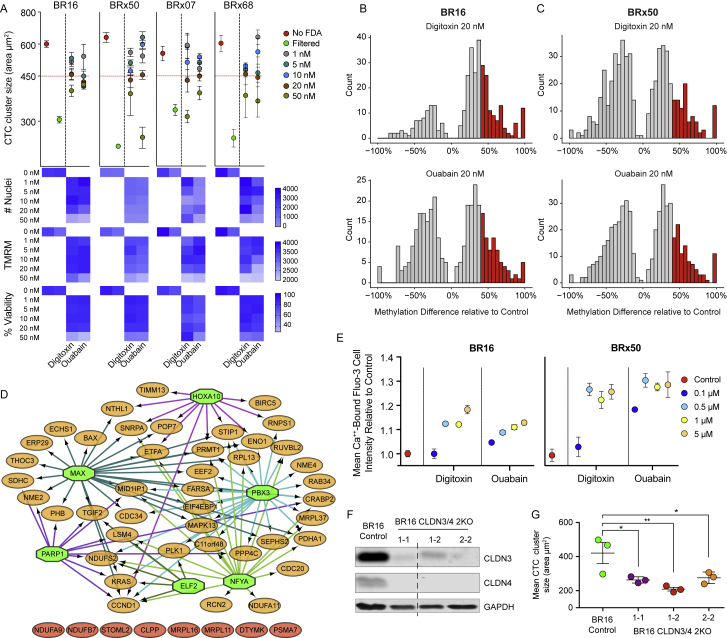
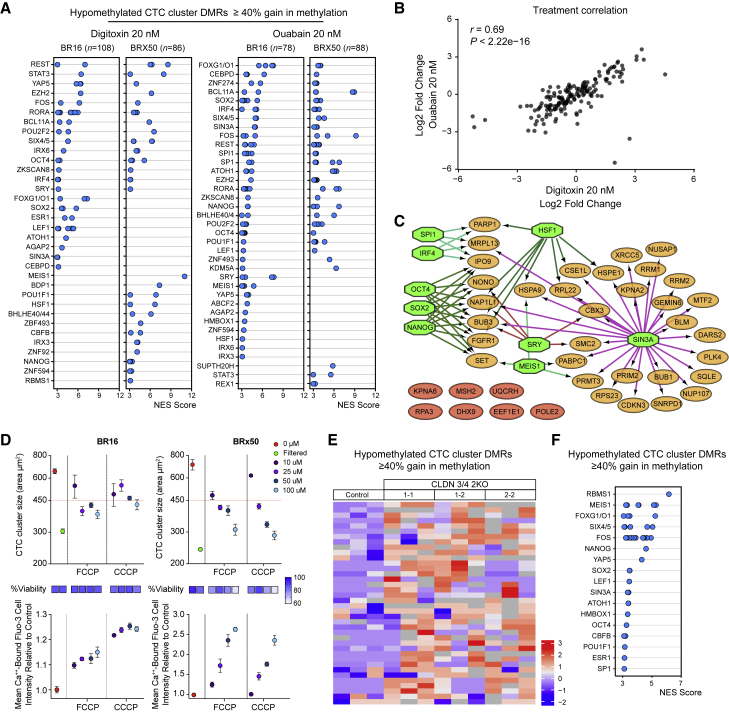
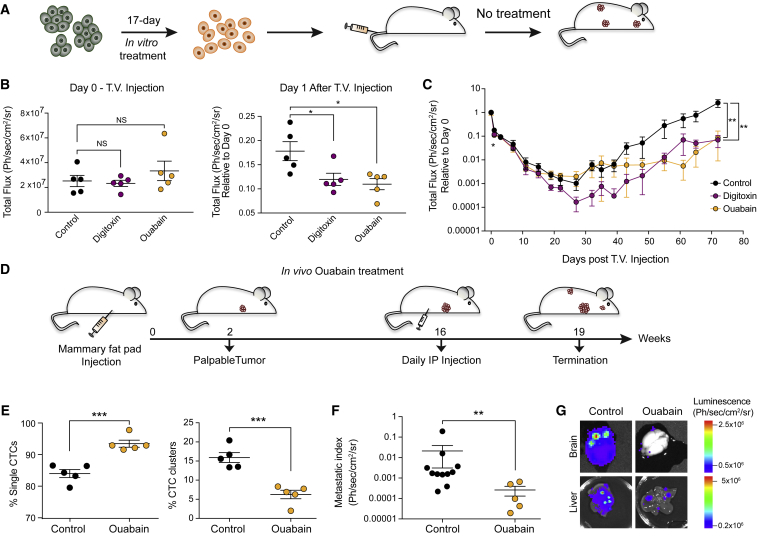
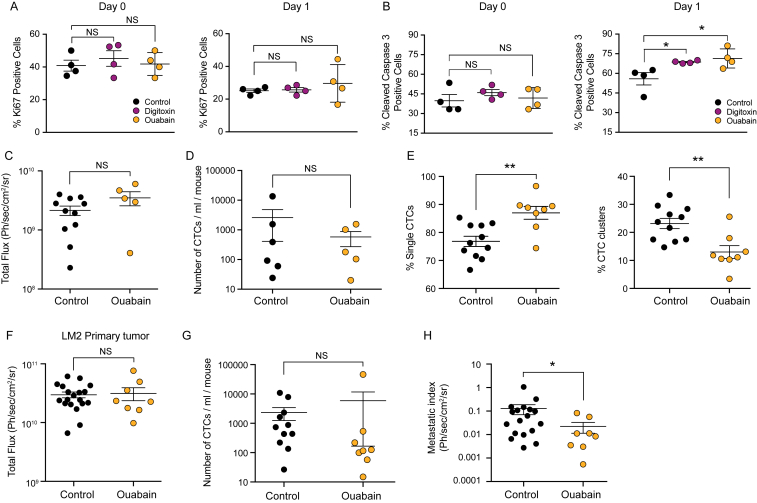
The ability of circulating tumor cells (CTCs) to form clusters has been linked to increased metastatic potential. Yet biological features and vulnerabilities of CTC clusters remain largely unknown. Here, we profile the DNA methylation landscape of single CTCs and CTC clusters from breast cancer patients and mouse models on a genome-wide scale. We find that binding sites for stemness- and proliferation-associated transcription factors are specifically hypomethylated in CTC clusters, including binding sites for OCT4, NANOG, SOX2, and SIN3A, paralleling embryonic stem cell biology. Among 2,486 FDA-approved compounds, we identify Na+/K+ ATPase inhibitors that enable the dissociation of CTC clusters into single cells, leading to DNA methylation remodeling at critical sites and metastasis suppression. Thus, our results link CTC clustering to specific changes in DNA methylation that promote stemness and metastasis and point to cluster-targeting compounds to suppress the spread of cancer.

Keywords: RNA sequencing; bisulfite sequencing; circulating tumor cell clusters; circulating tumor cells; drug screen; proliferation-associated transcription factors; single cell sequencing; stemness-associated transcription factors.


Figures

None
Graphical abstract
Figure S1
Figure S1
Whole-Genome Bisulfite Sequencing of Single CTCs and CTC Clusters, Related to Figure 1 (A) CTC capture efficiency from blood spiked with BR16 or BRx50 single CTCs and CTC clusters, using the Parsortix device (n = 2 per cell line with 500 single CTCs and 150 CTC clusters). Error bars represent SEM. (B) 250 single BR16-GFP+ and 250 single BR16-RFP+ cells are spiked in blood and CTCs are enriched using the Parsortix device. Captured CTCs are of single color, revealing no artificial cluster formation during processing (n = 2). Error bars represent SEM. (C) Representative pictures of single CTCs and CTC clusters from breast cancer patients, enriched with the Parsortix microfluidic device and stained for EpCAM, HER2 and EGFR (green). White blood cells (WBCs) are counterstained with CD45 (red). (D and E) Bar graph showing the percent of CpG sites that are covered in individual CTC clusters and single CTCs from patients (D) and xenografts (E). (F and G) Principal component analysis of patient-derived (F) and xenograft-derived (G) single CTCs and CTC clusters, based on all features with p ≤ 0.05. (H and I) Metaplots showing the percentage (%) of CpG methylation at CpG islands (H) and reference genes (I) in CTC clusters (blue line) and single CTCs (dotted red line). TSS: Transcription Start Site; TES: Transcription End Site. (J–L) Hypergeometric gene set enrichment analysis of promoters (J), gene bodies (K) and super-enhancers (L) displaying ≥ 20% methylation difference (p value ≤ 0.01) in xenograft-derived CTC clusters compared to single CTCs. Gene sets with adjusted p value ≤ 0.05 are shown for promoters (J) and gene bodies (K). For super-enhancers (L), the top-20 significant gene sets with adjusted p value ≤ 0.05 are shown. Gene sets related to PRC2 activity are highlighted in red. (M) Histogram showing mapped reads in patient CTCs corresponding to a methylated cytosine (C) (red) or a thymine (T) (blue; corresponding to a bisulfite-converted, unmethylated cytosine) in representative regions that include binding sites for OCT4, SOX2, NANOG and SIN3A (shaded-orange box). n = number of CpGs covered.
Figure 1
Figure 1
Whole-Genome Bisulfite Sequencing Analysis of CTCs from Breast Cancer Patients and Xenografts (A) Heatmap showing methylation variable regions with ≥ 80% methylation difference between patient-derived CTC clusters and single CTCs (false discovery rate [FDR] < 0.05). (B) Heatmap showing methylation variable regions with ≥ 70% methylation difference between xenograft-derived CTC clusters and single CTCs (FDR < 0.05). (C and D) Normalized enrichment score (NES) representing enrichment (NES ≥ 3.4) of transcription factor binding sites (TFBSs) in CTC cluster hypomethylated regions (blue) and single CTC hypomethylated regions (red) of patients (C) or xenografts (D), identified using i-cisTarget. (E and F) Integrated gene ontology (GO) and pathway enrichment analysis of TFBSs identified using i-cisTarget in hypomethylated regions of both patient- and xenograft-derived CTC clusters (E) or single CTCs (F). The bars represent the percentage of genes detected per GO and pathway term with p ≤ 0.05. See also Figure S1 and Tables S1 and S2.
Figure 2
Figure 2
CTC Cluster Hypomethylated Regions Are Associated with a Poor Prognosis in Breast Cancer Patients (A) Percentage of DNA methylation (mean beta values) of overlapping probes identified in the TCGA breast cancer patient dataset. Patients are grouped in four quantiles Q1-Q4, depending on the mean DNA methylation percentage of CTC cluster hypomethylated regions. (B) Kaplan-Meier curve showing progression-free survival of breast cancer patients with overlapping probes in quantiles Q1 versus Q4 (top). The number of patients that progressed at each time point is shown (bottom). See also Figure S2.
Figure S2
Figure S2
TCGA Progression-free Survival Analysis of Breast Cancer Patients, Related to Figure 2 (A) Overlap of patient- and xenograft-derived CTC cluster hypomethylated regions with TCGA probes in breast cancer patients. (B) Correlation plot of methylation levels across CTC cluster hypomethylated regions that are overlapping with TCGA probes and genome-wide methylation levels detected in the same samples. (C) Overlap of patient- and xenograft-derived single CTC hypomethylated regions with TCGA probes in breast cancer patients. (D) Percent of DNA methylation (mean beta values) of overlapping single CTC hypomethylated probes identified in the TCGA breast cancer patient dataset. Patients are grouped in four quantiles Q1-Q4, depending on the mean DNA methylation percentage of single CTC hypomethylated regions. (E) Correlation plot of methylation levels across single CTC hypomethylated regions that are overlapping with TCGA probes and genome-wide methylation levels detected in the same samples. (F) Kaplan-Meier curve showing progression-free survival of breast cancer patients with single CTC hypomethylated overlapping probes in quantiles Q1 versus Q4 (top panel). The number of patients that progressed at each time point of the progression-free survival analysis is shown (bottom panel). (G) Pie chart showing the percent of ER+/PR+, HER2+ and Triple Negative (TN) breast cancer patients with CTC cluster hypomethylated overlapping probes in quantiles Q1 versus Q4. (H) Bar graphs showing the percent of ER+/PR+, HER2+ and Triple Negative breast cancer patients in Q1 and Q4 quantiles for CTC cluster hypomethylated overlapping probes. ns, not significant. p = by Student’s t test. (I) Pie chart showing the percent of ER+/PR+, HER2+ and Triple Negative (TN) breast cancer patients with single CTC hypomethylated overlapping probes in quantiles Q1 versus Q4. (J) Bar graphs showing the percent of ER+/PR+, HER2+ and Triple Negative breast cancer patients in Q1 and Q4 quantiles for single CTC hypomethylated overlapping probes. ns, not significant. p = by Student’s t test.
Figure S3
Figure S3
RNA Sequencing of Patient- and Xenograft-Derived Single CTCs and CTC Clusters, Related to Figure 3 (A and B) The plots show the number of detected features by number of cells in patient-derived (A) and xenograft-derived (B) CTCs processed with RNA sequencing. (C) Gene Ontology (GO) enrichment analysis of genes in the Dark Red, Dark Turquoise and Grey expression modules, significantly enriched in xenograft-derived single CTCs. (D–F) Dot plots showing the percent of Ki67-positive single CTCs and Ki67-positive CTCs within CTC clusters, detected in BR16 xenograft-derived CTCs (D), LM2 xenograft-derived CTCs (E), and patient 3-derived CTCs (F). p < 0.05 by Student’s t test. Error bars represent SEM. ID = Internal ID. (G) Representative pictures of BR16 xenograft-derived single CTCs and CTC clusters, stained with Pan Cytokeratin (PanCK) (green), Ki67 (red) and DAPI (blue).
Figure 3
Figure 3
RNA Sequencing Analysis of Single CTCs and CTC Clusters from Breast Cancer Patients and Xenografts (A) Weighted gene co-expression network analysis (WGCNA) in patient-derived single CTCs and CTC clusters, showing a hierarchical clustering tree of co-expression modules. Each module corresponds to a branch, which is labeled by a distinct color shown underneath. (B) WGCNA identifies 32 modules with highly correlated gene expression patterns in patient-derived single CTCs and CTC clusters. Correlations between each module and CTC clusters or single CTCs are indicated by the intensity of red or green color, respectively. p value for each module is shown in brackets. (C) GO term analysis of transcripts enriched in the red and pink expression modules of patient-derived CTC clusters. (D) WGCNA in xenograft-derived single CTCs and CTC clusters, showing a hierarchical clustering tree of co-expression modules. Each module corresponds to a branch, labeled by a distinct color shown underneath. (E) WGCNA identifies 21 modules with highly correlated gene expression patterns in xenograft-derived single CTCs and CTC clusters. Correlations between each module and CTC clusters or single CTCs are indicated by the intensity of red or green color, respectively. p value for each module is shown in brackets. (F) GO term analysis of transcripts enriched in the magenta, green, yellow, and turquoise expression modules of xenograft-derived CTC clusters. (G) Venn diagram showing the overlap of GO terms enriched in CTC clusters from patients and xenografts. See also Figure S3 and Tables S3 and S4.
Figure 4
Figure 4
Stemness-Related Gene Expression Analysis of Single CTCs and CTC Clusters from Breast Cancer Patients and Xenografts (A) WGCNA of 302 stemness-related transcripts in patient-derived single CTCs and CTC clusters, showing a hierarchical clustering tree of co-expression modules. Each module corresponds to a branch, which is labeled by a distinct color shown underneath. (B) WGCNA identifies four modules with highly correlated gene expression patterns in patient-derived single CTCs and CTC clusters. Correlations between each module and CTC clusters or single CTCs are indicated by the intensity of red or green color, respectively. p value for each module is shown in brackets. (C) GO network analysis of patient-derived transcripts identified in the CTC cluster-associated blue and gray modules using iRegulon. The node size indicates significance (p < 0.05), and color intensity corresponds to the percentage of genes that are associated to each GO category. Indicative GO categories are shown. (D) GO term analysis of transcripts enriched in the blue and gray modules of patient-derived CTC clusters. (E) Patient-derived CTC cluster-associated blue and gray module gene regulatory network analysis showing putative transcription factor dependence on SIN3A, OCT4, and CBFB (green octagons). (F) WGCNA of 302 stemness-related transcripts in xenograft-derived single CTCs and CTC clusters, showing a hierarchical clustering tree of co-expression modules. Each module corresponds to a branch, labeled by a distinct color shown underneath. (G) WGCNA identifies four modules with highly correlated gene expression patterns in xenograft-derived single CTCs and CTC clusters. Correlations between each module and CTC clusters or single CTCs are indicated by the intensity of red or green color, respectively. p value for each module is shown in brackets. (H) Venn diagram showing the overlap of CTC cluster-enriched transcripts between patients (blue and gray modules) and xenograft (yellow and green modules). (I) Xenograft-derived CTC cluster-associated green and yellow module gene regulatory network analysis showing putative transcription factor dependence on SIN3A, OCT4, NANOG, BHLHE40, RORA, and FOXO1 (green octagons) and on SOX2 (orange circle). See also Figure S4 and Tables S4 and S5.
Figure S4
Figure S4
Stemness-Related Gene Expression Analysis of Single CTCs and CTC Clusters, Related to Figure 4 (A) GO term analysis of transcripts identified in patient-derived single CTC-associated turquoise and brown modules. (B and C) Whisker plots showing the average methylation difference in CTC clusters relative to single CTCs, detected on the 5kb region upstream of the transcription start site of each target gene, in patient- (A) and xenograft-derived (B) CTCs. Hypomethylated genes in CTC clusters are represented with blue color, hypomethylated genes in single CTCs are represented with red color. Transcription factors relative to target genes are shown within gray boxes. (D) Venn diagram showing the overlap between genes enriched in single CTCs of patient-derived (turquoise and brown) and xenograft-derived (orange and purple) expression modules. (E) Regulatory network analysis of the 129 stemness-related genes that are commonly enriched in single CTCs in patient-derived (turquoise and brown) and xenograft-derived (orange and purple) expression modules, showing TF dependence on MYF6 and ASCL1, which also display hypomethylated binding sites based on the DMR analysis (green octagons).
Figure 5
Figure 5
Screen for FDA-Approved Compounds that Dissociate CTC Clusters (A) Representative images of unfiltered and filtered BR16 CTC-derived cells stained with Hoechst (blue) and TMRM (orange) (left). Representative images of single and clustered CTCs outline based on nuclei proximity as determined using the Colombus Image Analysis System (right). The plots show the mean CTC cluster size (area in micrometers squared) and percentage (%) of viability of unfiltered versus filtered BR16 cells (n = 4; ∗∗∗p < 0.001 by Student’s t test; ns, not significant) (bottom). (B) Effect of a 2-day treatment of BR16 cells with 2,486 FDA-approved compounds at 5 μM concentration, plotted as mean CTC cluster size (area in micrometers squared) versus percentage (%) of viability (n = 2). Thirty-nine FDA-approved compounds (orange circles) result in significant decrease in mean CTC cluster size (p < 0.0001, F value = 7.71; DF = 38 using one-way ANOVA test; horizontal dashed red line, < 450 μm2) and > 70% detectable viability (vertical-dashed red line). BR16 cells that were untreated (red) or 40 μm filtered (green) are shown as controls. (C) The plot shows the mean CTC cluster size of BR16 cells treated with each of the 39 cluster-targeting compounds at four different concentrations. BR16 cells that were untreated (red) or 40 μm filtered (green) are shown as controls (top panel). The heatmap shows the number of nuclei, mean TMRM intensity, and percentage (%) of viability of BR16 cells treated with cluster-targeting compounds at the indicated concentrations (bottom). n = 2. Error bars represent SEM. See also Figure S5 and Table S6.
Figure S5
Figure S5
Screen for CTC Cluster-Targeting FDA-Approved Compounds, Related to Figure 5 (A) Average TMRM intensity of unfiltered and filtered BR16 CTC-derived cells. n = 4; Error bars represent S.E.M; ∗∗∗p < 0.001 by Student’s t test. (B) Assessment of mean CTC cluster size (area in μm2), percent (%) of viability and TMRM intensity of unfiltered and filtered BRx50 CTC-derived cells. n = 4; Error bars represent SEM; ∗∗∗p < 0.001 ∗∗∗∗p < 0.0001 by Student’s t test; ns, not significant. (C) Mean CTC cluster size and viability distribution of BR16 cells treated with cluster-targeting FDA-approved compounds at 5 μM concentration for 2 days (p < 0.0001). BR16 cells that were not treated with FDA-approved compounds (red) or that were filtered (green) are shown for comparison. p = by one-way ANOVA test. n = 2; Error bars represent SEM. (D) Mean CTC cluster size (area in μm2) of BRx50 cells treated with 3 different concentrations (0.1, 0.5 and 1 μM) of CTC cluster-targeting FDA-approved compounds (n = 2; Error bars represent SEM). BRx50 cells that were not treated with FDA-approved compounds (red) or that were filtered (green) are shown for comparison (top). Heatmaps showing the number of nuclei, the average TMRM intensity and the percent (%) of viability of BRx50 cells treated with CTC cluster-targeting FDA-approved compounds at the indicated concentrations (bottom). Compounds that consistently dissociate CTC clusters in both BR16 and Brx-50 cells are highlighted in red.
Figure S6
Figure S6
Treatment of CTC-Derived Cell Lines with Digitoxin and Ouabain, Related to Figure 6 (A) Mean CTC cluster size (area in μm2) of BR16, BRx50, BRx07 and BRx68 CTC-derived cells treated with five different concentrations (1, 5, 10, 20 and 50 nM) of digitoxin or ouabain (n = 4; Error bars represent SEM). Cells that were not treated with FDA-approved compounds (red) or that were filtered (green) are shown for comparison (top). Heatmaps showing the number of nuclei, the average TMRM intensity and the percent (%) of viability of CTC-derived cells treated with digitoxin or ouabain at the indicated concentrations (bottom). (B and C) The histograms show the number of CTC cluster hypomethylated regions that become differentially methylated upon treatment of BR16 (B) and BRx50 (C) cells with 20 nM dixitoxin or ouabain (q ≤ 0.05). Regions that gain >40% methylation are shown in red. (D) Regulatory network analysis of the genes (orange) that are commonly upregulated (log2 fold-change ≥ 0.5) in BR16 and BRx50 CTC-derived cell lines upon 17-day treatment with digitoxin or ouabain, showing TF dependence on PBX3, MAX, NFYA, ELF2, PARP1 and HOXA10. Upregulated genes that do not show dependence on the above TFs are shown below in red. (E) The plot shows the mean cell intensity of Ca2+-bound Fluo-3 after 30 min treatment of BR16 or BRx50 cells with 0.1, 0.5, 1 or 5 μM digitoxin or ouabain, respectively, relative to the untreated control (red) (n = 4; Error bars represent SEM). (F) Western blot for CLDN3, CLDN4 and GAPDH on BR16 cells with double knockout (2KO) of CLDN3 and CLDN4. The dashed line represents the point where irrelevant lanes were spliced out from the original scan. (G) Plot showing the reduction in mean cluster size (area in μm2) of the CLDN3/4 double KO BR16 cells, relative to control BR16 cells. p < 0.05; ∗∗p < 0.01 by Student’s t test. Error bars represent SEM.
Figure 6
Figure 6
Treatment with Na+/K+ ATPase Inhibitors and Tight Junction Dissociation Restores Methylation at Key Sites (A) i-cisTarget analysis of CTC clusters hypomethylated regions, showing ≥ 40% methylation increase upon in vitro treatment with 20 nM of digitoxin or ouabain. Shown are enriched TFBSs in each CTC-derived cell line (NES ≥ 3). (B) The plot shows expression changes in stemness-related transcripts that are enriched in patient- and xenograft-derived CTC clusters (n = 168) upon treatment of BR16 and BRx50 cells with 20 nM digitoxin or ouabain. Pearson’s correlation coefficient (r) and p values are shown. (C) Gene regulatory network analysis of downregulated genes upon treatment with 20 nM digitoxin or ouabain in both BR16 and BRx50 (log FC ≤ −0.5), showing putative dependence on OCT4, SOX2, NANOG, and SIN3A, among other TFs (green octagons). Downregulated genes that are not regulated by the TFs mentioned above are shown in red. (D) The plot shows the mean CTC cluster size of BR16 and BRx50 CTC-derived cells treated with FCCP or CCCP at different concentrations (n = 4). BR16 and BRx50 cells that were untreated (red) or 40 μm filtered (green) are shown as controls (top). The heatmap shows the percentage (%) of viability of treated cells at the indicated concentrations (middle). The plot shows the mean cell intensity of Ca2+-bound Fluo-3 after treatment with FCCP or CCCP, relative to the untreated control (red) (n = 4) (bottom). Error bars represent SEM. (E) Heatmap showing methylation variable regions among CTC cluster hypomethylated regions that gain ≥ 40% methylation upon CLDN3/4 double knockout in BR16 cells. (F) i-cisTarget analysis of CTC cluster hypomethylated regions, showing ≥ 40% methylation increase upon CLDN3/4 double knockout in BR16 cells. Shown are enriched TFBSs (NES ≥ 3). See also Figure S6 and Tables S2, S3, and S7.
Figure 7
Figure 7
Treatment with Na+/K+ ATPase Inhibitors Suppresses Spontaneous Metastasis Formation (A) Schematic representation of the experiment. (B) The plots show the total bioluminescence flux at day 0 (left) and day 1 (right) upon tail vein injection of BR16 cells pre-treated with 20 nM digitoxin or ouabain. n = 5 for controls and ouabain, n = 4 for digitoxin; p < 0.05 by Student’s t test. ns, not significant. Error bars represent SEM. (C) Metastasis growth curve over 72 days upon tail vein injection of BR16 cells pre-treated with 20 nM digitoxin or ouabain. n = 5; p < 0.05; ∗∗p < 0.01 by Student’s t test. Error bars represent SEM. (D) Schematic representation of the experiment. (E) The plots show the percentage (%) of spontaneously generated single CTCs and CTC clusters detected in the blood of BR16 xenografts treated with ouabain. n = 5; ∗∗∗p < 0.001 by Student’s t test. error bars represent SEM. (F) The plot shows the metastatic index of BR16 xenografts treated with ouabain. n = 11 for controls, n = 5 for ouabain; ∗∗p < 0.01 by Student’s t test. Error bars represent SEM. (G) Representative images of the bioluminescence signal measured in brain and in liver of control and ouabain-treated NSG mice. See also Figure S7.
Figure S7
Figure S7
Treatment with Digitoxin and Ouabain Reduces Metastasis Formation, Related to Figure 7 (A) The plots show the percent of Ki67-positive cancer cells detected in the lungs of NSG mice at Day 0 or Day 1 upon injection with BR16 CTC-derived cells, treated in vitro with digitoxin or ouabain. Cancer cells are identified through Pan Cytokeratin staining; n = 4 mice for each condition. Error bars represent SEM; ns, not significant. (B) The plots show the percent of Caspase 3-positive cancer cells detected in the lungs of NSG mice at Day 0 or Day 1 upon injection with BR16 CTC-derived cells, treated in vitro with digitoxin or ouabain. Cancer cells are identified through Pan Cytokeratin staining; n = 4 mice for each condition. p < 0.05 by Student’s t test; Error bars represent SEM; ns, not significant. (C) The plot shows the total bioluminescence flux emitted from the primary tumor of BR16 xenografts treated with vehicle (control) or ouabain. Error bars represent SEM; ns, not significant. (D) The plot shows the total number of CTCs, including both single CTCs and CTC clusters, detected per mL of blood in BR16 xenografts treated with vehicle (control) or ouabain. n = 6 for controls and n = 5 ouabain; Error bars represent SEM; ns, not significant. (E) The plots show the percent (%) of spontaneously generated single CTCs and CTC clusters detected in the blood of LM2 xenografts treated with vehicle (control) or ouabain. n = 11 for controls, n = 8 for ouabain; ∗∗p < 0.01. (F) The plot shows the total bioluminescence flux emitted from the primary tumor of LM2 xenografts treated with vehicle (control) or ouabain. Error bars represent SEM; ns, not significant. (G) The plot shows the total number of CTCs, including both single CTCs and CTC clusters, detected per mL of blood in LM2 xenografts treated with vehicle (control) or ouabain. n = 11 for controls and n = 8 ouabain; Error bars represent SEM; ns, not significant. (H) The plot shows the metastatic index of LM2 xenografts treated with vehicle (control) or ouabain. n = 18 for controls, n = 8 for oubain. p < 0.01 by Student’s t test; Error bars represent SEM.

References

    1. Aceto N., Bardia A., Miyamoto D.T., Donaldson M.C., Wittner B.S., Spencer J.A., Yu M., Pely A., Engstrom A., Zhu H. Circulating tumor cell clusters are oligoclonal precursors of breast cancer metastasis. Cell. 2014;158:1110–1122. - PMC - PubMed
    1. Aceto N., Toner M., Maheswaran S., Haber D.A. En route to metastasis: circulating tumor cell clusters and epithelial-to-mesenchymal transition. Trends Cancer. 2015;1:44–52. - PubMed
    1. Akalin A., Kormaksson M., Li S., Garrett-Bakelman F.E., Figueroa M.E., Melnick A., Mason C.E. methylKit: a comprehensive R package for the analysis of genome-wide DNA methylation profiles. Genome Biol. 2012;13:R87. - PMC - PubMed
    1. Akalin A., Franke V., Vlahoviček K., Mason C.E., Schübeler D. Genomation: a toolkit to summarize, annotate and visualize genomic intervals. Bioinformatics. 2015;31:1127–1129. - PubMed
    1. Alix-Panabières C., Pantel K. Circulating tumor cells: liquid biopsy of cancer. Clin. Chem. 2013;59:110–118. - PubMed

Publication types

MeSH terms

Substances