

Daily Nutritional Supplementation with Vitamin D₃ and Phenylbutyrate to Treatment-Naïve HIV Patients Tested in a Randomized Placebo-Controlled Trial
- PMID: 30634590
- PMCID: PMC6356462
- DOI: 10.3390/nu11010133
Daily Nutritional Supplementation with Vitamin D₃ and Phenylbutyrate to Treatment-Naïve HIV Patients Tested in a Randomized Placebo-Controlled Trial
Abstract
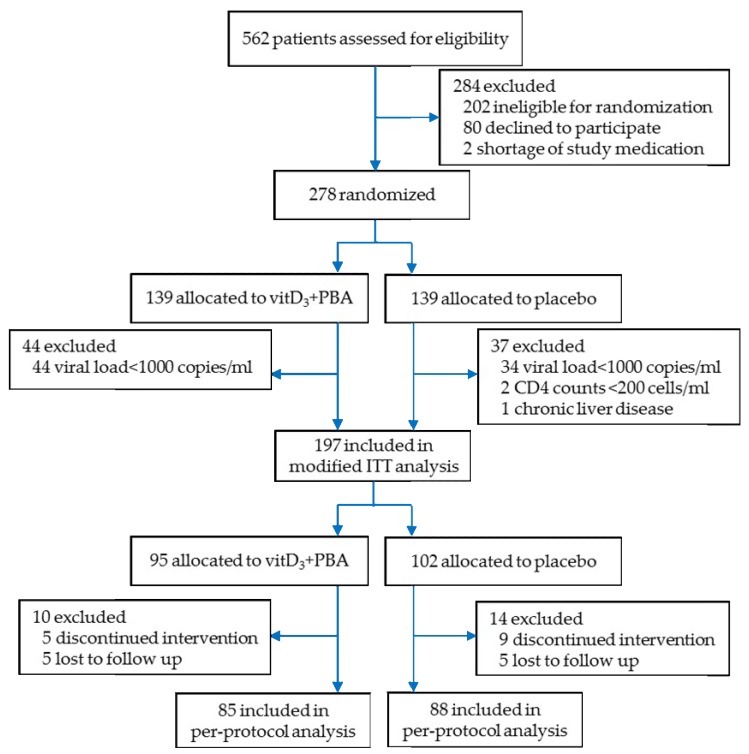
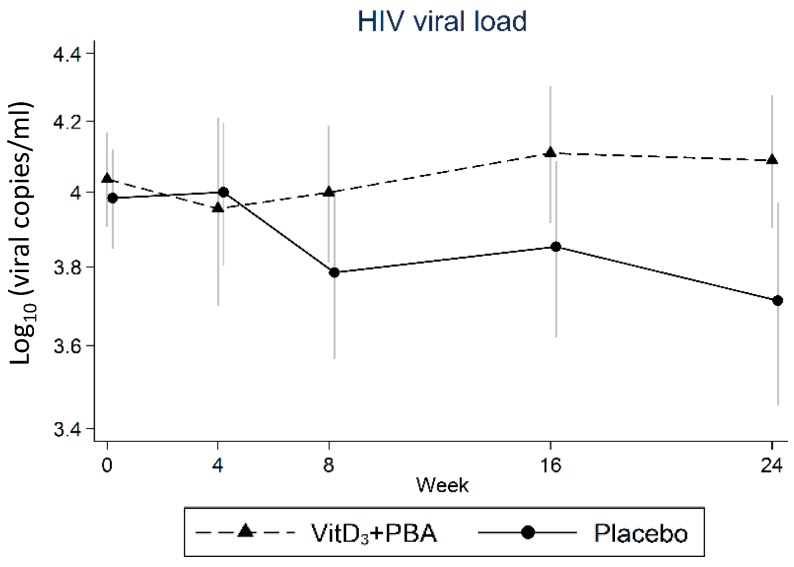
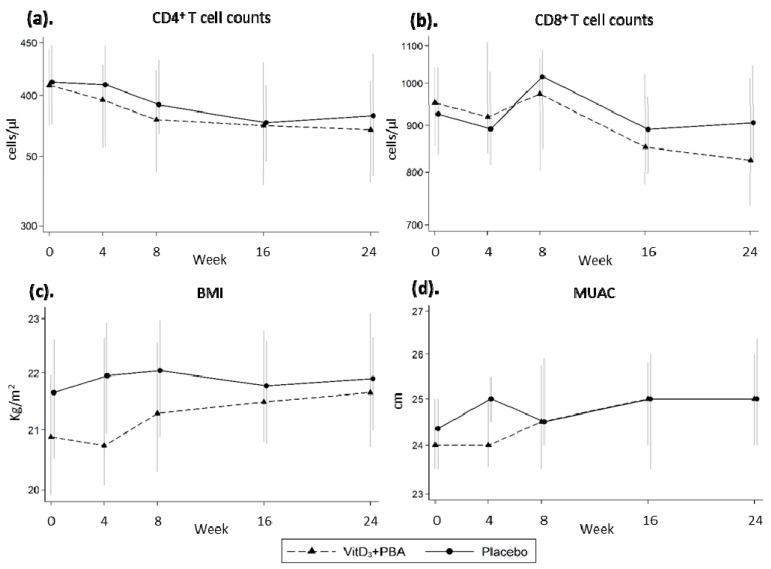
Poor nutritional status is common among human immunodeficiency virus (HIV)-infected patients including vitamin D (vitD₃) deficiency. We conducted a double-blinded, randomized, and placebo-controlled trial in Addis Ababa, Ethiopia, to investigate if daily nutritional supplementation with vitD₃ (5000 IU) and phenylbutyrate (PBA, 2 × 500 mg) could mediate beneficial effects in treatment-naïve HIV patients. Primary endpoint: the change in plasma HIV-1 comparing week 0 to 16 using modified intention-to-treat (mITT, n = 197) and per-protocol (n = 173) analyses. Secondary endpoints: longitudinal HIV viral load, T cell counts, body mass index (BMI), middle-upper-arm circumference (MUAC), and 25(OH)D₃ levels in plasma. Baseline characteristics were detectable viral loads (median 7897 copies/mL), low CD4⁺ (median 410 cells/µL), and elevated CD8⁺ (median 930 cells/µL) T cell counts. Most subjects were vitD₃ deficient at enrolment, but a gradual and significant improvement of vitD₃ status was demonstrated in the vitD₃ + PBA group compared with placebo (p < 0.0001) from week 0 to 16 (median 37.5 versus 115.5 nmol/L). No significant changes in HIV viral load, CD4⁺ or CD8⁺ T cell counts, BMI or MUAC could be detected. Clinical adverse events were similar in both groups. Daily vitD₃ + PBA for 16 weeks was well-tolerated and effectively improved vitD₃ status but did not reduce viral load, restore peripheral T cell counts or improve BMI or MUAC in HIV patients with slow progressive disease. Clinicaltrials.gov NCT01702974.
Keywords: HIV infection; clinical trial; immunity; nutrition; supplementation; vitamin D.
Conflict of interest statement
The authors declare no conflict of interest. The funders had no role in the design of the study; in the collection, analyses, or interpretation of data; in the writing of the manuscript, or in the decision to publish the results.
Figures

Similar articles
-
Vitamin D and Phenylbutyrate Supplementation Does Not Modulate Gut Derived Immune Activation in HIV-1.Nutrients. 2019 Jul 21;11(7):1675. doi: 10.3390/nu11071675. Nutrients. 2019. PMID: 31330899 Free PMC article. Clinical Trial.
-
Effect of high-dose cholecalciferol (vitamin D3) on bone and body composition in children and young adults with HIV infection: a randomized, double-blind, placebo-controlled trial.Osteoporos Int. 2017 Jan;28(1):201-209. doi: 10.1007/s00198-016-3826-x. Epub 2016 Nov 11. Osteoporos Int. 2017. PMID: 27837268 Clinical Trial.
-
A randomized double-blind placebo-controlled trial of vitamin D supplementation in juvenile-onset systemic lupus erythematosus: positive effect on trabecular microarchitecture using HR-pQCT.Osteoporos Int. 2018 Mar;29(3):587-594. doi: 10.1007/s00198-017-4316-5. Epub 2017 Nov 19. Osteoporos Int. 2018. PMID: 29152675 Clinical Trial.
-
Vitamin D in Human Immunodeficiency Virus Infection: Influence on Immunity and Disease.Front Immunol. 2018 Mar 12;9:458. doi: 10.3389/fimmu.2018.00458. eCollection 2018. Front Immunol. 2018. PMID: 29593721 Free PMC article. Review.
-
The Potential Protective Role of Vitamin D Supplementation on HIV-1 Infection.Front Immunol. 2019 Sep 25;10:2291. doi: 10.3389/fimmu.2019.02291. eCollection 2019. Front Immunol. 2019. PMID: 31611877 Free PMC article. Review.
Cited by
-
The health outcomes of vitamin D supplementation in Africa: a systematic review and meta-analysis.BMC Nutr. 2025 Jul 4;11(1):121. doi: 10.1186/s40795-025-01046-w. BMC Nutr. 2025. PMID: 40616195 Free PMC article.
-
Vitamin D and Phenylbutyrate Supplementation Does Not Modulate Gut Derived Immune Activation in HIV-1.Nutrients. 2019 Jul 21;11(7):1675. doi: 10.3390/nu11071675. Nutrients. 2019. PMID: 31330899 Free PMC article. Clinical Trial.
-
Adjunct Therapy for CD4+ T-Cell Recovery, Inflammation and Immune Activation in People Living With HIV: A Systematic Review and Meta-Analysis.Front Immunol. 2021 Feb 17;12:632119. doi: 10.3389/fimmu.2021.632119. eCollection 2021. Front Immunol. 2021. PMID: 33679779 Free PMC article.
-
Circulating 25-hydroxycholecalciferol and calcium levels, and alkaline phosphatase activity among people living with and without human immunodeficiency virus and injecting drugs in kenya.BMC Infect Dis. 2024 Jul 17;24(1):703. doi: 10.1186/s12879-024-09610-8. BMC Infect Dis. 2024. PMID: 39020290 Free PMC article.
-
Incomplete immune reconstitution in HIV/AIDS patients on antiretroviral therapy: Challenges of immunological non-responders.J Leukoc Biol. 2020 Apr;107(4):597-612. doi: 10.1002/JLB.4MR1019-189R. Epub 2020 Jan 22. J Leukoc Biol. 2020. PMID: 31965635 Free PMC article. Review.
References
Publication types
MeSH terms
Substances
Associated data
Grants and funding
LinkOut - more resources
Full Text Sources
Medical
Research Materials
