. 2019 Jan 10;20(2):251.
doi: 10.3390/ijms20020251.

Genome-Wide Characterization and Identification of Trihelix Transcription Factor and Expression Profiling in Response to Abiotic Stresses in Rice (Oryza sativa L.)

Affiliations

Genome-Wide Characterization and Identification of Trihelix Transcription Factor and Expression Profiling in Response to Abiotic Stresses in Rice (Oryza sativa L.)

Jiaming Li et al. Int J Mol Sci. .

Abstract

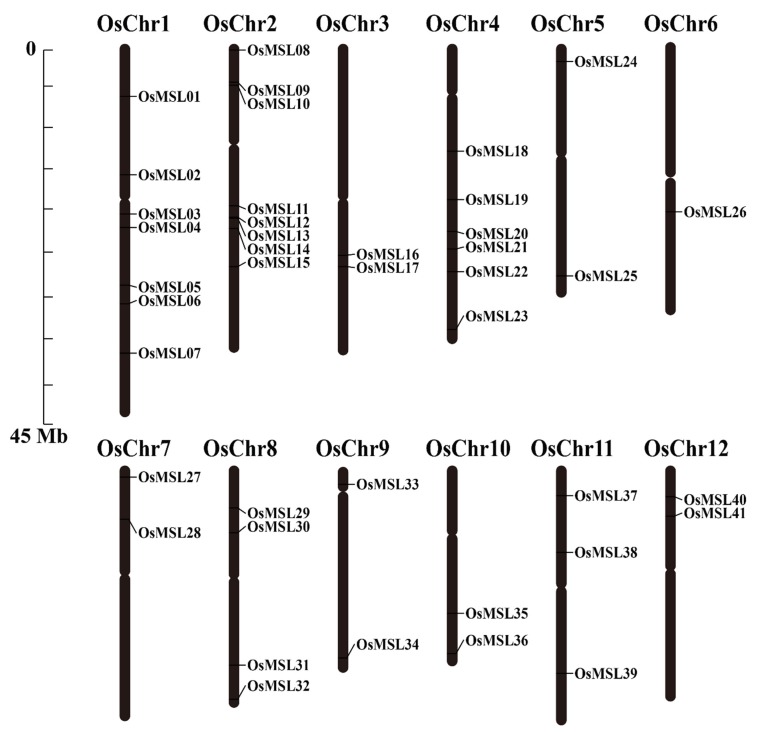
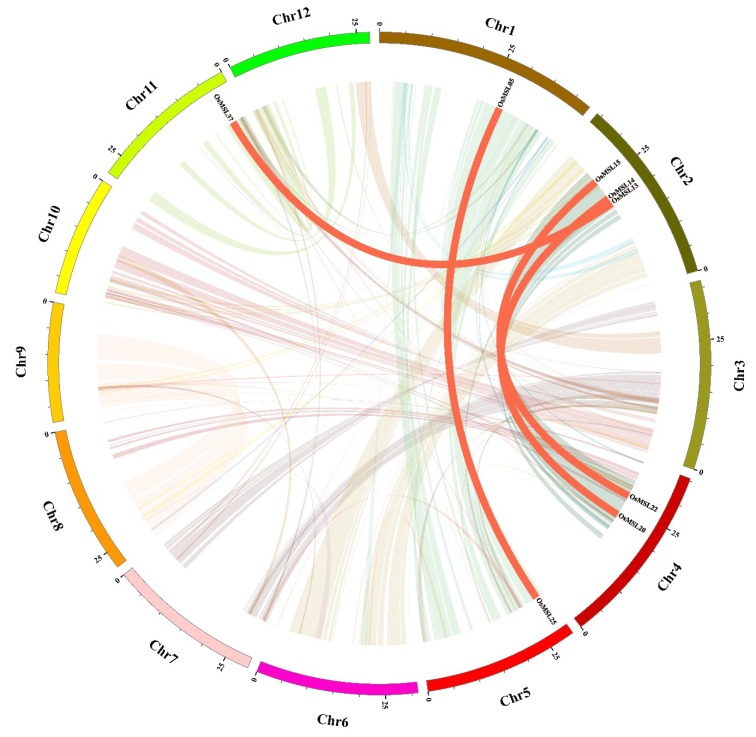
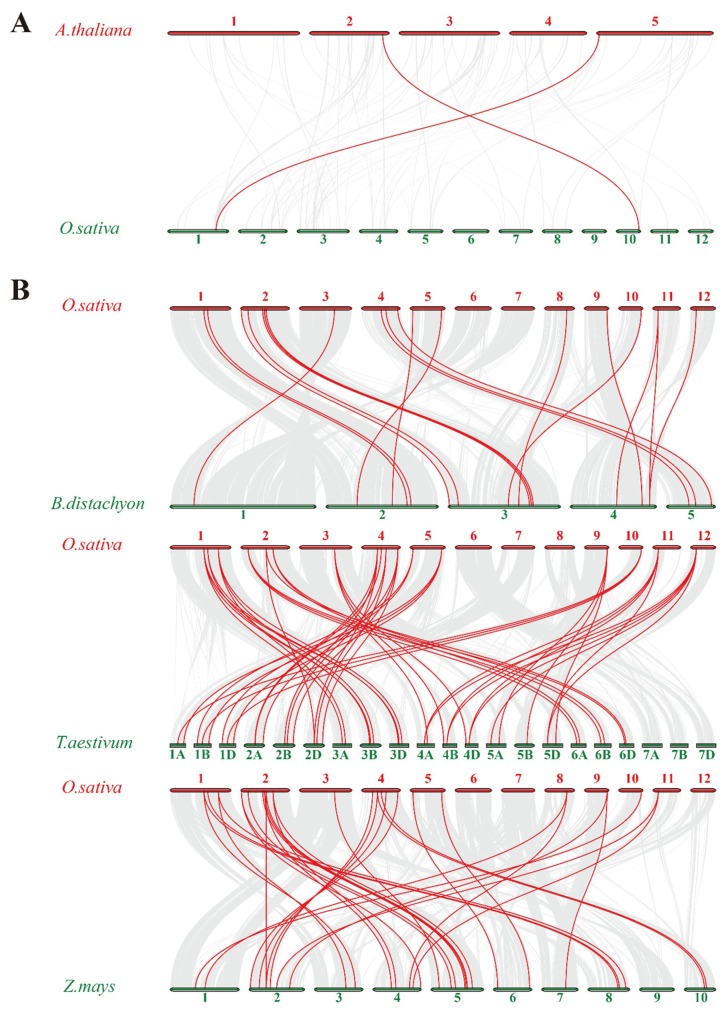
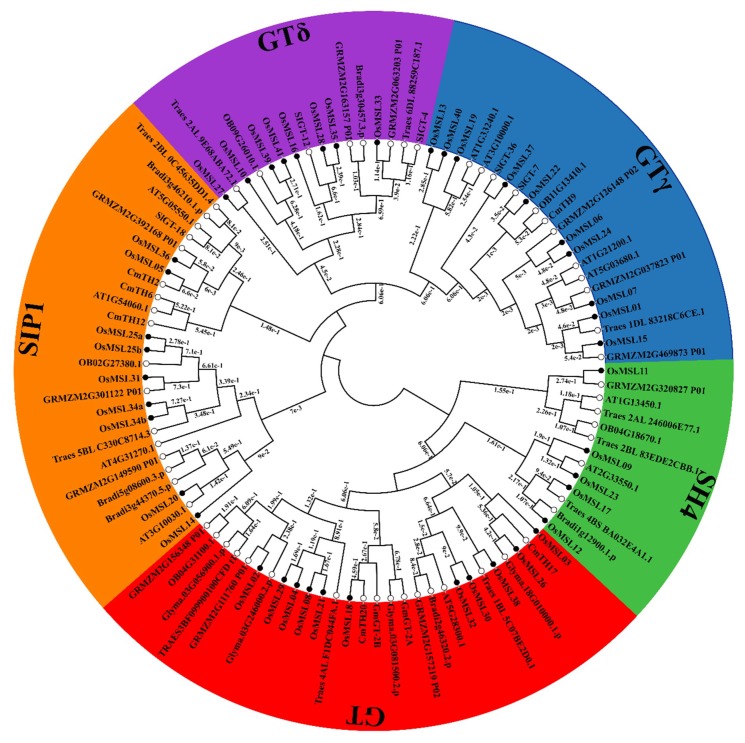
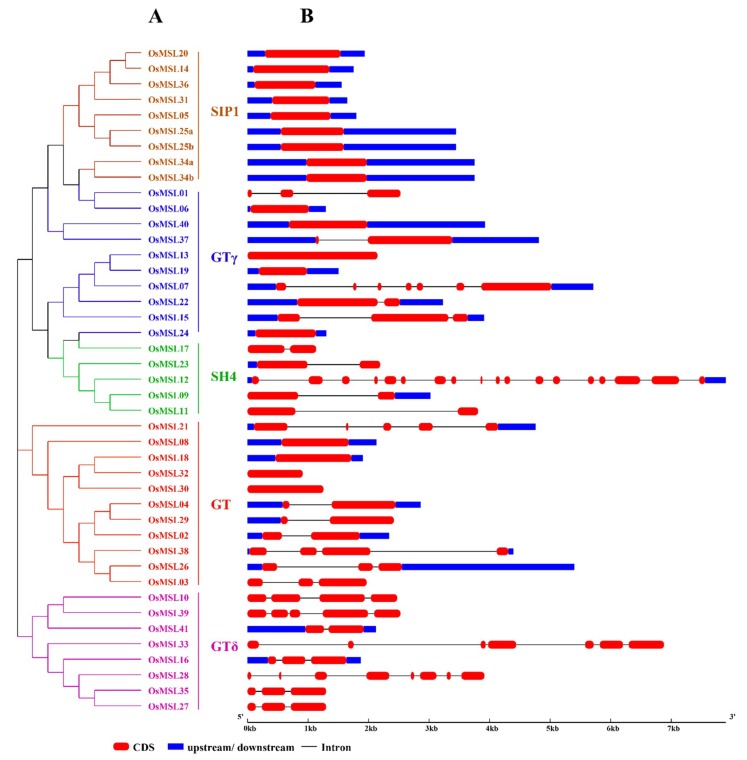
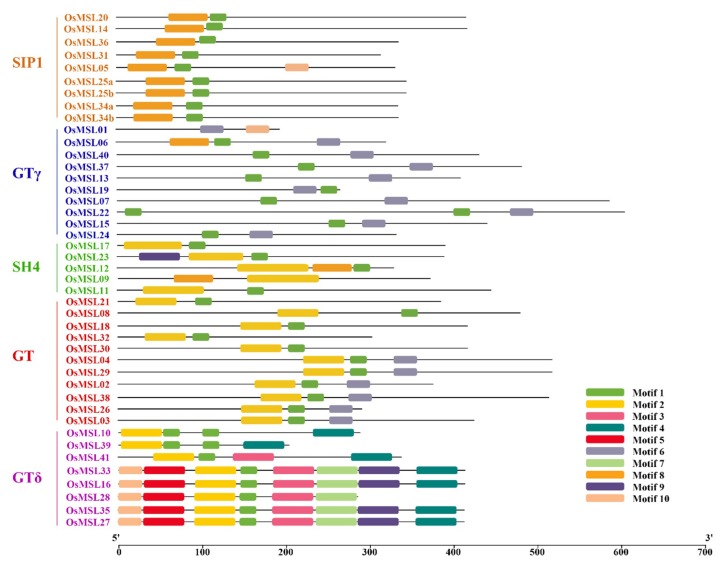
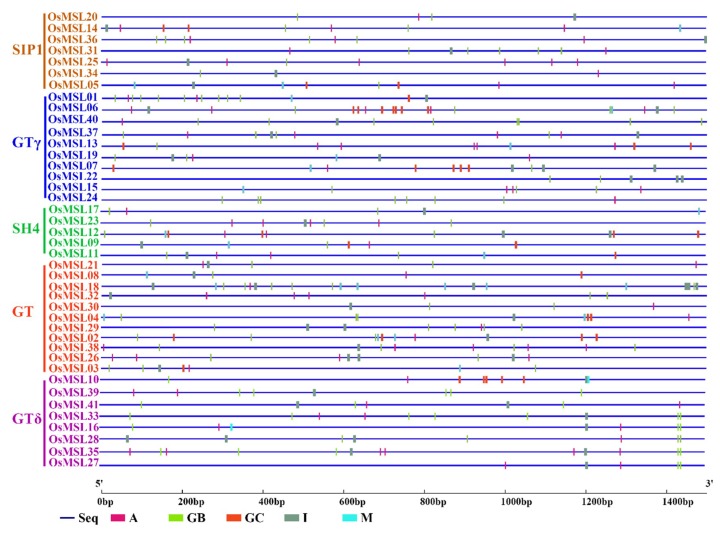
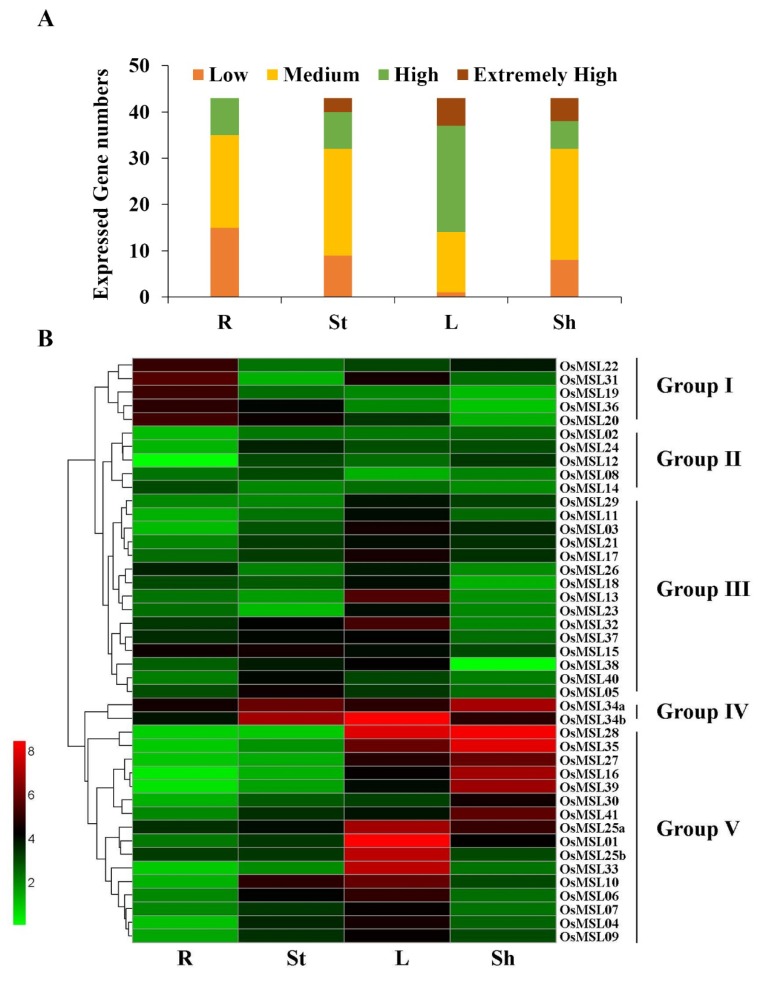
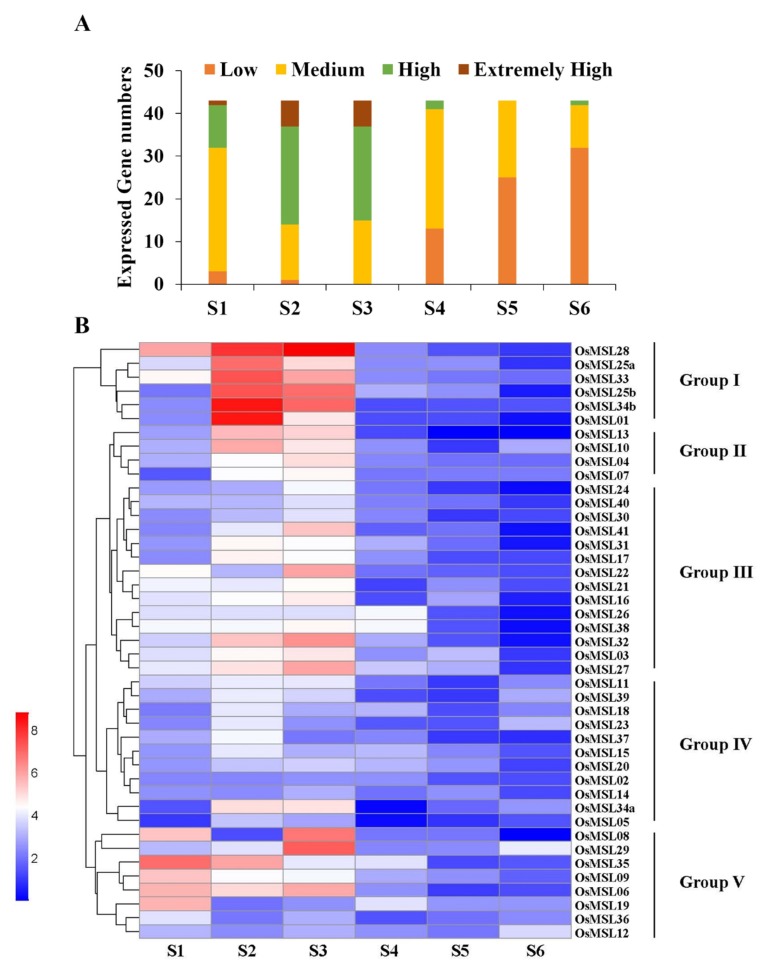
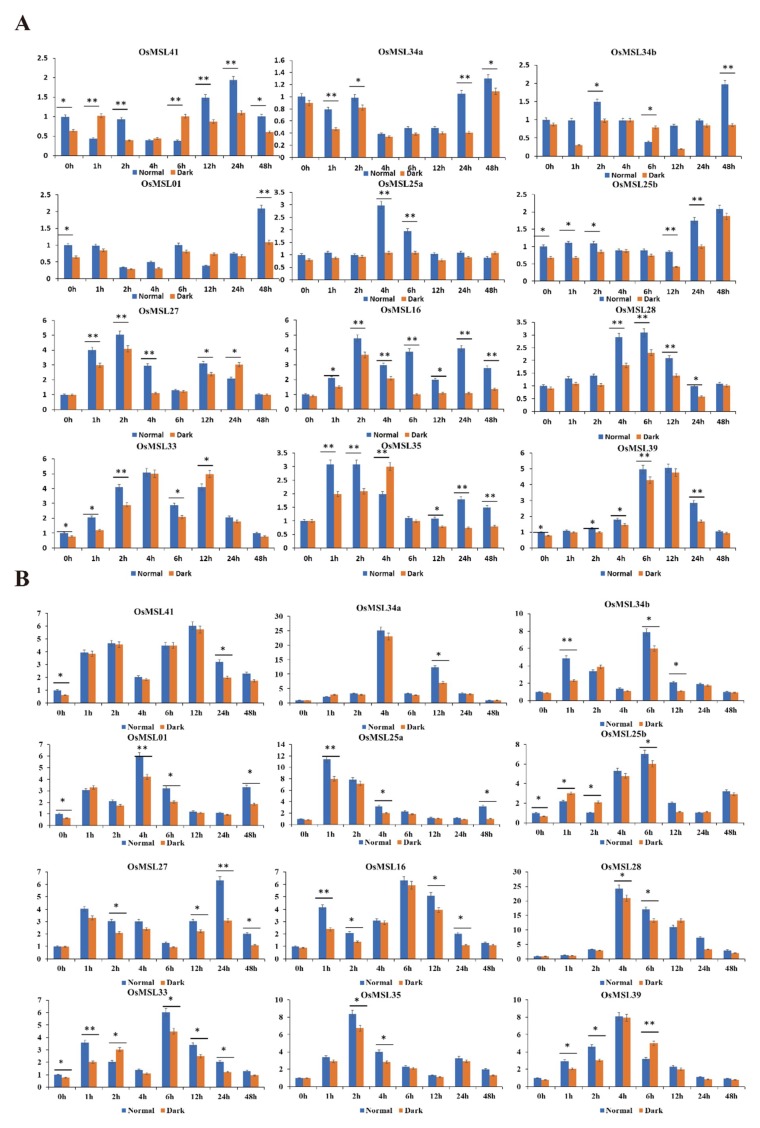
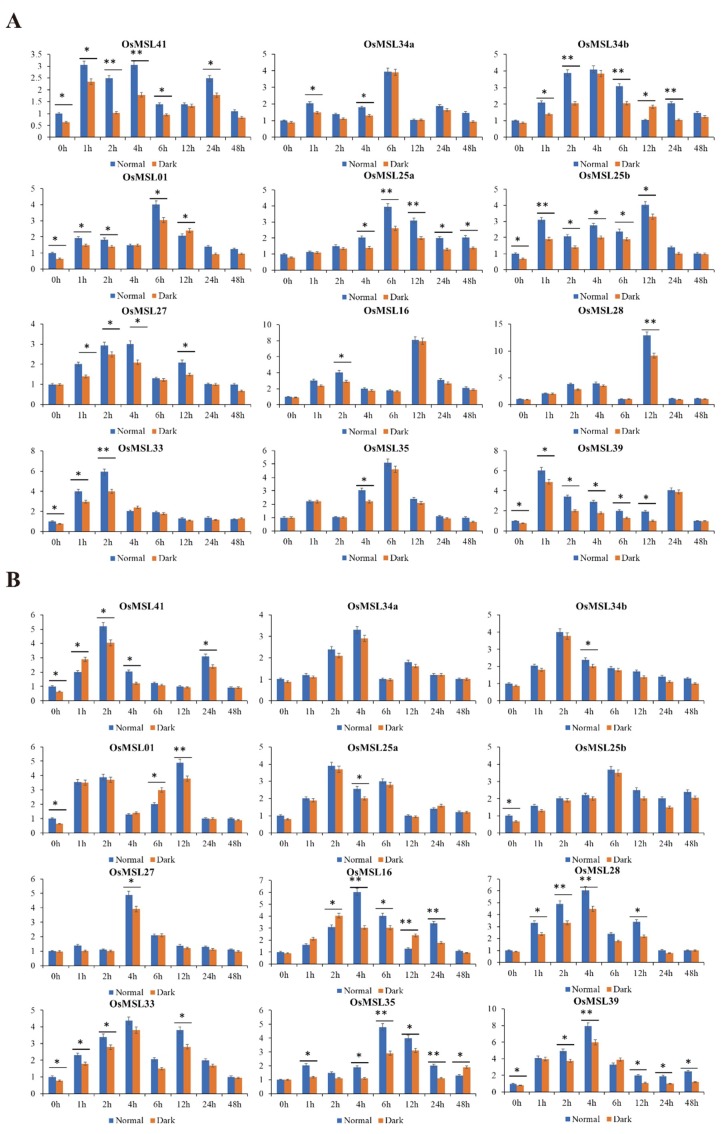
Trihelix transcription factors play a role in plant growth, development and various stress responses. Here, we identified 41 trihelix family genes in the rice genome. These OsMSLs (Myb/SANT-LIKE) were located on twelve chromosomes. Synteny analysis indicated only six duplicated gene pairs in the rice trihelix family. Phylogenetic analysis of these OsMSLs and the trihelix genes from other species divided them into five clusters. OsMSLs from different groups significantly diverged in terms of gene structure and conserved functional domains. However, all OsMSLs contained the same five cis-elements. Some of these were responsive to light and dehydration stress. All OsMSLs expressed in four tissues and six developmental stages of rice but with different expression patterns. Quantitative real-time PCR analysis revealed that the OsMSLs responded to abiotic stresses including drought and high salt stress and stress signal molecule including ABA (abscisic acid), hydrogen peroxide. OsMSL39 were simultaneously expressed under all treatments, while OsMSL28 showed high expression under hydrogen peroxide, drought, and high salt treatments. Moreover, OsMSL16/27/33 displayed significant expression under ABA and drought treatments. Nevertheless, their responses were regulated by light. The expression levels of the 12 chosen OsMSLs differed between light and dark conditions. In conclusion, our results helped elucidate the biological functions of rice trihelix genes and provided a theoretical basis for further characterizing their biological roles in responding to abiotic stresses.

Keywords: light; phylogenetic analysis; rice; stress response; trihelix transcription factor.


Conflict of interest statement

The authors declare no conflict of interest.

Figures

Figure 1
Figure 1
Chromosomal locations of rice trihelix genes. Black bars represent the chromosomes. Chromosome numbers are shown at the tops of the bar. Trihelix genes are labeled at the right of the chromosomes. Scale bar on the left indicates the chromosome lengths (Mb).
Figure 2
Figure 2
Schematic representations of segmental duplications of rice trihelix genes. Different color lines indicate all synteny blocks in rice genome between each chromosome, and the thick red lines indicate duplicated trihelix gene pairs. The chromosome number is indicated at the bottom of each chromosome. Scale bar marked on the chromosome indicating chromosome lengths (Mb).
Figure 3
Figure 3
Synteny analysis of trihelix genes between rice and (A) dicotyledonous plant Arabidopsi thaliana, (B) monocotyledonous plant Brachypodium distachyon, wheat and maize. Gray lines in the background indicate the collinear blocks within rice and other plant genomes, while the red lines highlight the syntenic trihelix gene pairs. The species names with the prefixes ‘A. thaliana’, ‘B. distachyon’, ‘T. aestivum’, ‘Z. mays’ and ‘O. sativa’ indicate Arabidopsi thaliana, Brachypodium distachyon, Triticum aestivum, Zea mays and Oryza sativa, respectively. Red or green bars represent the chromosomes. The chromosome number is labeled at the top or bottom of each chromosome.
Figure 4
Figure 4
Phylogenetic relationships among 105 trihelix proteins in rice, Arabidopsis, soybean, maize, tomato, wheat, chrysanthemum, wild rice and Brachypodium distachyon. The maximum likelihood tree was created using MEGA v. 7.0 (bootstrap value = 1000) and the bootstrap value of each branch is displayed. Forty-three OsMSL proteins are marked with black circles and other species are marked with white circles. The phylogenetic tree was clustered into SIP1, GTγ, GT, SH4, and GTδ.
Figure 5
Figure 5
Phylogenetic analysis and gene structure of the rice trihelix family. (A) Phylogenetic analysis of the rice trihelix family. The phylogenetic tree was constructed based on the full-length amino acid sequences of the rice trihelix proteins by using MEGA v. 7.0 with the maximum-likelihood method. Bootstrap = 1,000. SIP1, GTγ, GT, SH4, and GTδ are marked with different colors. (B) Gene structures of the rice trihelix family. These were analyzed by the Gene Structure Display Server (GSDS v. 2.0). Exons, introns, and untranslated regions are marked by round red rectangles, black lines, and blue rectangles, respectively. The scale bar at the bottom estimates the lengths of the exons, introns, and untranslated regions.
Figure 6
Figure 6
Motif composition of rice trihelix proteins. Motif analysis was performed using the MEME program as described in the methods section. The trihelix proteins are listed on the left. Boxes of different colors represent the various motifs. Their location in each sequence is marked. Motif sequences are shown in Figure S2. The scale bar at the bottom indicates the lengths of the trihelix protein sequences.
Figure 7
Figure 7
Predicted cis-elements in the promoter regions of the rice trihelix genes. All promoter sequences (−1500 bp) were analyzed. The trihelix genes are shown on the left side of the figure. The scale bar at the bottom indicates the length of promoter sequence. Green bar (GB): GATABOX element; purple bar (A): ACGTATERD1 element; red bar (GC): GT1CONSENSUS element; gray bar (I): INRNTPSADB element; blue bar (M): GT1GMSCAM4 element.
Figure 8
Figure 8
Expression of the rice trihelix gene family in various tissues (R: Root; St: Stem; L: Leaf; Sh: Sheath). (A) Numbers of expressed genes in each tissue. Expression data of the rice trihelix gene family were retrieved from the Expression Atlas database. Extremely high: Expression value > 6, high: 6 ≥ expression value > 4, medium: 4 ≥ expression value > 2, low: 2 ≥ expression value > 0; (B) Expression patterns of the trihelix genes in various rice tissues. Heatmaps were created in HemI v.1.0 and based on the expression data. Expression levels are depicted by different colors on the scale. Green and red represent low and high expression levels, respectively.
Figure 9
Figure 9
Expression of the rice trihelix gene family at different developmental stages (S1: 7 days after sowing; S2: 20 days after sowing; S3: 40 days after sowing; S4: 80 days after sowing; S5: 100 days after sowing; S6: 140 days after sowing). (A) Numbers of expressed genes in various developmental stages. Expression data of the rice trihelix gene family genes were retrieved from the Expression Atlas database. Extremely high: Expression value > 6, high: 6 ≥ expression value > 4, medium: 4 ≥ expression value > 2, low: 2 ≥ expression value > 0; (B) Expression patterns of trihelix genes in various rice developmental stages. Heatmaps were created in HemI v.1.0 and based on the expression data. Expression levels are depicted by different colors on the scale. Blue and red represent low and high expression levels, respectively.
Figure 10
Figure 10
Expression profiles of 12 selected OsMSLs in response to (A) ABA (abscisic acid), (B) hydrogen peroxide treatments. Data were normalized to the β-actin gene. Vertical bars indicate standard deviations. Asterisks indicate corresponding genes significantly upregulated or downregulated compared with the control. (* p < 0.05; ** p < 0.01; Student’s t-test).
Figure 11
Figure 11
Expression profiles of 12 selected OsMSLs in response to (A) drought, (B) high salt stress, treatments. Data were normalized to the β-actin gene. Vertical bars indicate standard deviations. Asterisks indicate corresponding genes significantly upregulated or downregulated compared with the control. (* p < 0.05; ** p < 0.01; Student’s t-test).

Similar articles

Cited by

References

    1. Lindemose S., O’Shea C., Jensen M.K., Skriver K. Structure, Function and Networks of Transcription Factors Involved in Abiotic Stress Responses. Int. J. Mol. Sci. 2013;14:5842–5878. doi: 10.3390/ijms14035842. - DOI - PMC - PubMed
    1. Jin J.P., Tian F., Yang D.C., Meng Y.Q., Kong L., Luo J.C., Gao G. PlantTFDB 4.0: Toward a central hub for transcription factors and regulatory interactions in plants. Nucleic. Acids Res. 2017;45:D1040–D1045. doi: 10.1093/nar/gkw982. - DOI - PMC - PubMed
    1. Riechmann J.L., Heard J., Martin G., Reuber L., Jiang C., Keddie J., Adam L., Pineda O., Ratcliffe O.J., Samaha R.R. Arabidopsis transcription factors: Genome-wide comparative analysis among eukaryotes. Science. 2000;290:2105. doi: 10.1126/science.290.5499.2105. - DOI - PubMed
    1. Green P.J., Kay S.A., Chua N.H. Sequence-specific interactions of a pea nuclear factor with light-responsive elements upstream of the rbcS-3A gene. EMBO J. 1987;6:2543–2549. doi: 10.1002/j.1460-2075.1987.tb02542.x. - DOI - PMC - PubMed
    1. Nagano Y. Several Features of the GT-Factor Trihelix Domain Resemble Those of the Myb DNA-Binding Domain. Plant Physiol. 2000;124:491–493. doi: 10.1104/pp.124.2.491. - DOI - PMC - PubMed

Substances

LinkOut - more resources