

Trends in neonicotinoid pesticide residues in food and water in the United States, 1999-2015
- PMID: 30634980
- PMCID: PMC6330495
- DOI: 10.1186/s12940-018-0441-7
Trends in neonicotinoid pesticide residues in food and water in the United States, 1999-2015
Abstract
Background: Neonicotinoids are a class of systemic insecticides widely used on food crops globally. These pesticides may be found in "off-target" food items and persist in the environment. Despite the potential for extensive human exposure, there are limited studies regarding the prevalence of neonicotinoid residues in foods sold and consumed in the United States.
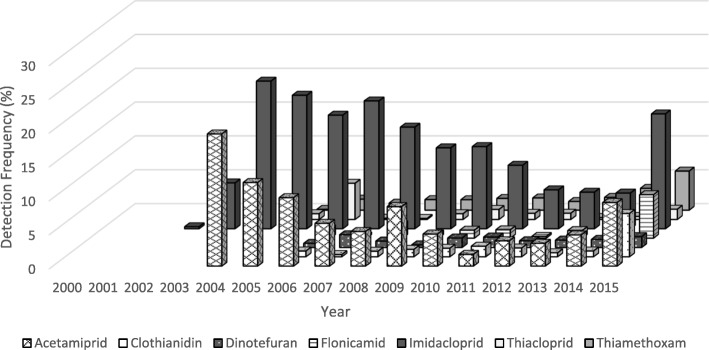
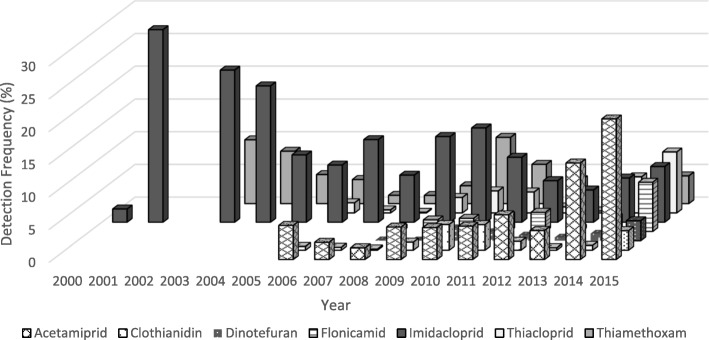
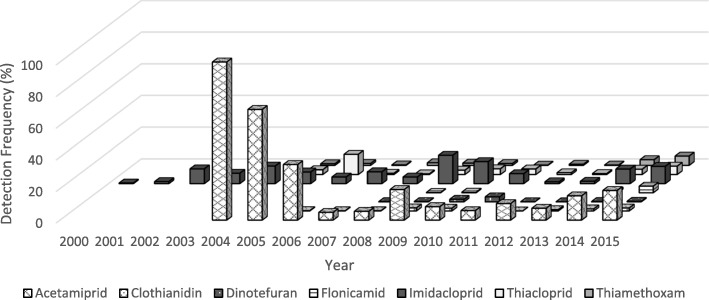
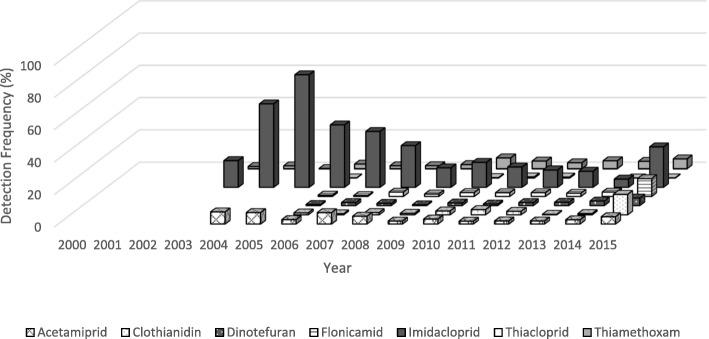
Methods: Residue data for seven neonicotinoid pesticides collected between 1999 and 2015 by the US Department of Agriculture's Pesticide Data Program (PDP) were collated and summarized by year across various food commodities, including fruit, vegetable, meat, dairy, grain, honey, and baby food, as well as water to qualitatively describe and examine trends in contamination frequency and residue concentrations.
Results: The highest detection frequencies (DFs) for neonicotinoids by year on all commodities were generally below 20%. Average DFs over the entire study period, 1999-2015, for domestic and imported commodities were similar at 4.5%. For all the samples (both domestic and imported) imidacloprid was the neonicotinoid with the highest overall detection frequency at 12.0%. However, higher DFs were observed for specific food commodity-neonicotinoid combinations such as: cherries (45.9%), apples (29.5%), pears (24.1%) and strawberries (21.3%) for acetamiprid; and cauliflower (57.5%), celery (20.9%), cherries (26.3%), cilantro (30.6%), grapes (28.9%), collard greens (24.9%), kale (31.4%), lettuce (45.6%), potatoes (31.2%) and spinach (38.7%) for imidacloprid. Neonicotinoids were also detected in organic commodities, (DF < 6%). Individual commodities with at least 5% of samples testing positive for two or more neonicotinoids included apples, celery, and cherries. Generally, neonicotinoid residues on food commodities did not exceed US Environmental Protection Agency tolerance levels. Increases in detection trends for both finished and untreated water samples for imidacloprid were observed from 2004 to 2011.
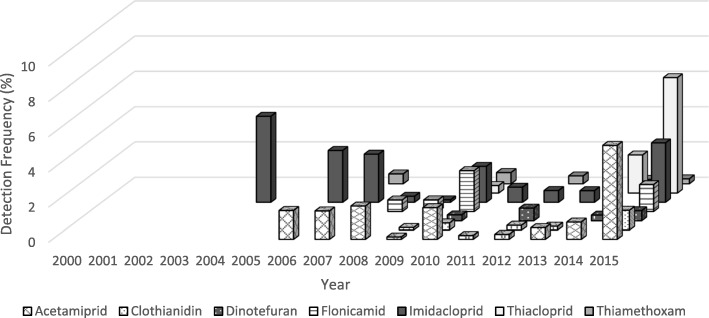
Conclusions: Analysis of PDP data indicates that low levels of neonicotinoids are present in commonly-consumed fruits and vegetables sold in the US. Trends in detection frequencies suggest an increase in use of acetamiprid, clothianidin and thiamethoxam as replacements for imidacloprid. Given these findings, more extensive surveillance of the food and water supply is warranted, as well as biomonitoring studies and assessment of cumulative daily intake in high risk groups, including pregnant women and infants.
Keywords: Food; Insecticides; Neonicotinoids; Water.
Conflict of interest statement
Authors’ information
Not applicable.
Ethics approval and consent to participate
Not applicable.
Consent for publication
Not applicable.
Competing interests
The authors declare that they have no competing interests.
Publisher’s Note
Springer Nature remains neutral with regard to jurisdictional claims in published maps and institutional affiliations.
Figures
References
-
- Kleinschmit J, Lilliston B. Unknown Benefits, Hidden Costs Neonicotinoid Seed Coatings, Crop Yields and Pollinators. Minneapolis: Institute for Agriculture and Trade Policy; 2015.
MeSH terms
Substances
LinkOut - more resources
Full Text Sources
Medical
Miscellaneous
