. 2019 Jan 11;17(1):23.
doi: 10.1186/s12967-018-1766-2.

Single cell sequencing reveals gene expression signatures associated with bone marrow stromal cell subpopulations and time in culture

Affiliations

Single cell sequencing reveals gene expression signatures associated with bone marrow stromal cell subpopulations and time in culture

Shutong Liu et al. J Transl Med. .

Abstract

Background: Bone marrow stromal cells (BMSCs) are a heterogeneous population that participates in wound healing, immune modulation and tissue regeneration. Next generation sequencing was used to analyze transcripts from single BMSCs in order to better characterize BMSC subpopulations.

Methods: Cryopreserved passage 2 BMSCs from one healthy subject were cultured through passage 10. The transcriptomes of bulk BMSCs from designated passages were analyzed with microarrays and RNA sequencing (RNA-Seq). For some passages, single BMSCs were separated using microfluidics and their transcriptomes were analyzed by RNA-Seq.

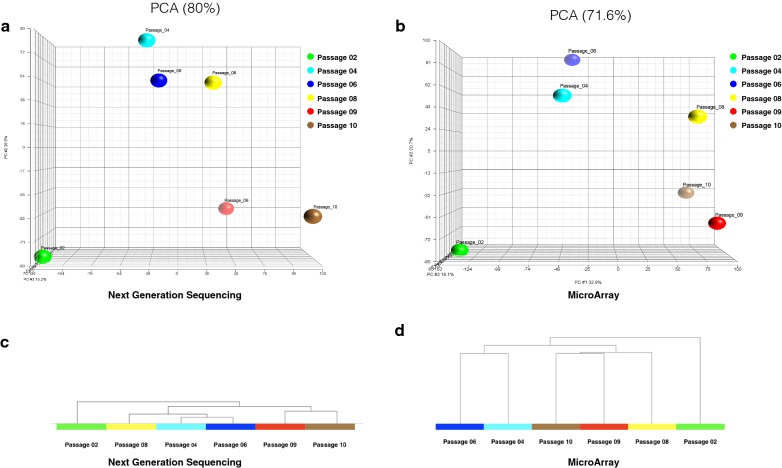
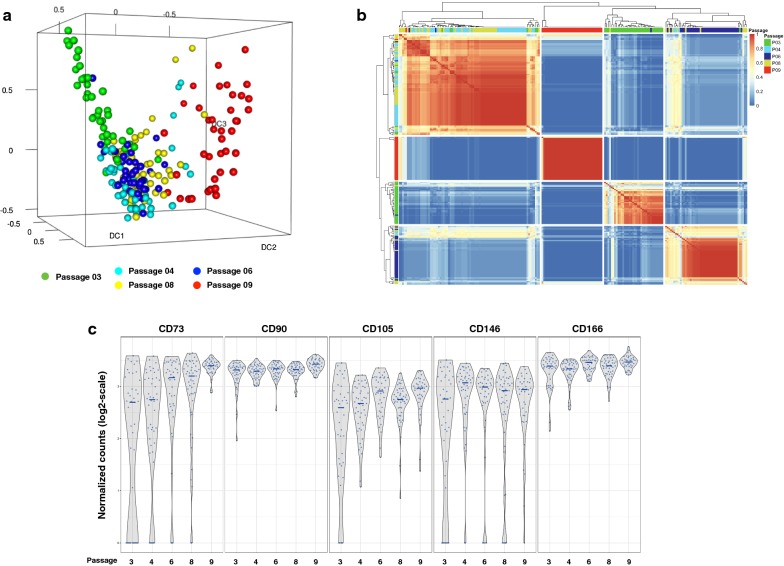
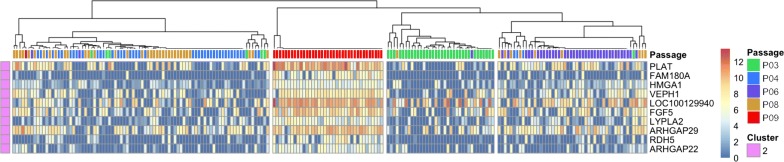
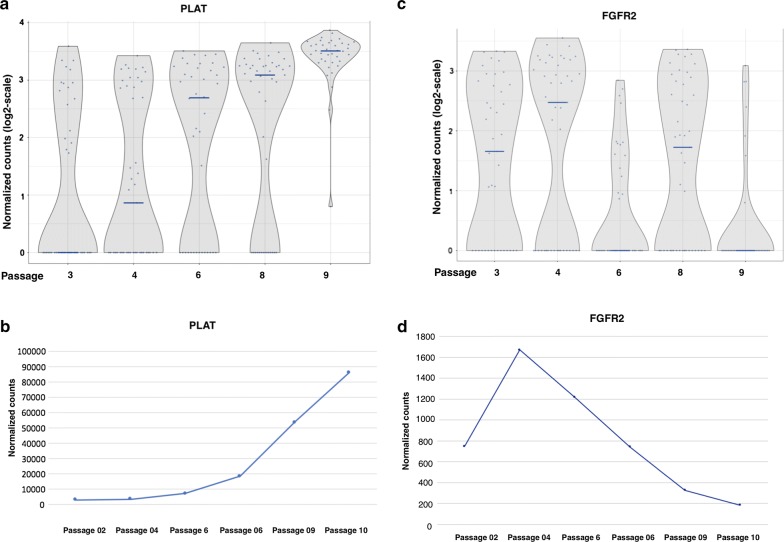
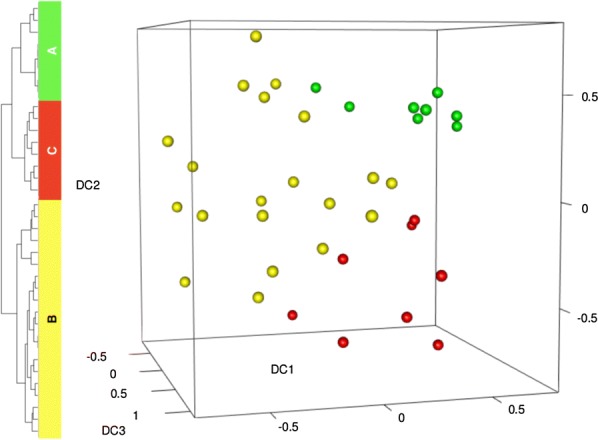
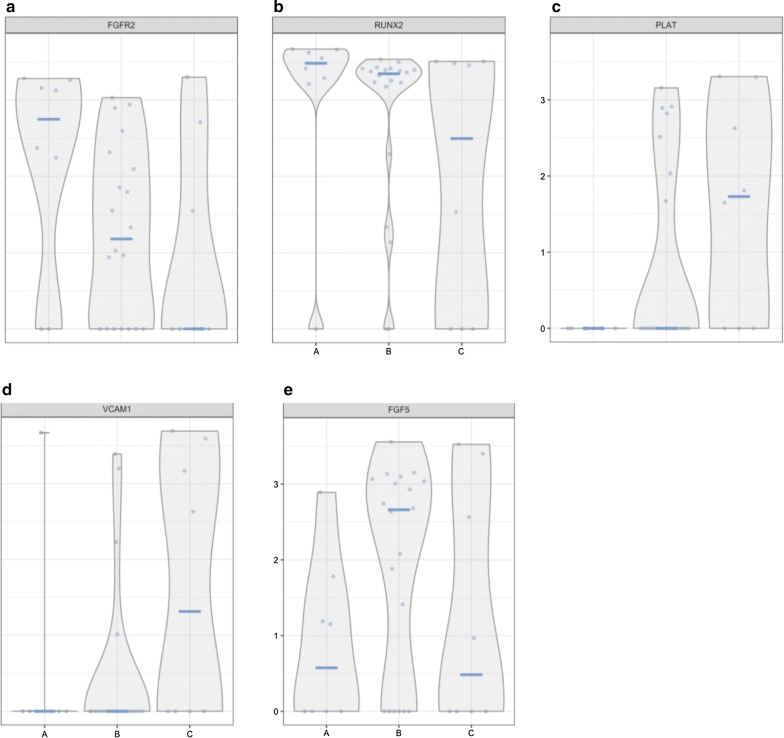
Results: Transcriptome analysis by microarray and RNA-Seq of unseparated BMSCs from passages 2, 4, 6, 8, 9 and 10 yielded similar results; both data sets grouped passages 4 and 6 and passages 9 and 10 together and genes differentially expressed among these early and late passage BMSCs were similar. 3D Diffusion map visualization of single BMSCs from passages 3, 4, 6, 8 and 9 clustered passages 3 and 9 into two distinct groups, but there was considerable overlap for passages 4, 6 and 8 cells. Markers for early passage, FGFR2, and late passage BMSCs, PLAT, were able to identify three subpopulations within passage 3 BMSCs; one that expressed high levels of FGFR2 and low levels of PLAT; one that expressed low levels of FGFR2 and high levels of PLAT and one that expressed intermediate levels of FGFR2 and low levels of PLAT.

Conclusions: Single BMSCs can be separated by microfluidics and their transcriptome analyzed by next generation sequencing. Single cell analysis of early passage BMSCs identified a subpopulation of cells expressing high levels of FGFR2 that might include skeletal stem cells.

Keywords: Bone marrow stromal cells; FGFR2; Next generation sequencing; PLAT; Single cell next generation sequencing.


Figures

Fig. 1
Fig. 1
Transcriptome analysis of serial passages of unseparated BMSCs using microarrays and next generation sequencing. PCA analysis of gene expression data from passages 2, 4, 6, 8, 9 and 10 BMSCs obtained by RNA-Seq are shown in a and by microarray analysis in b. Similarity matrix analysis of BMSC transcriptomes obtained by RNA sequencing is shown in c. Hierarchical clustering analysis of BMSC transcriptomes obtained using gene expression microarrays is shown in d
Fig. 2
Fig. 2
Expression of stromal cell marker genes by BMSCs as measured by RNA-Sequencing. The transcriptome of BMSCs from passages 2, 4, 6, 9 and 10 was analyzed by RNA-Seq. The expression of stromal cell markers CD73, CD90, CD105, CD146 and CD166 are shown in a and the expression of hematopoietic cell markers in CD45, CD34, CD14 and CD11b in b. The expression of four genes differentially expressed among early and late passage cells is shown in c. Among the genes whose expression was greatest in early passage BMSC, the fold difference was greatest for CRISPLD2, and VCAM1 is a functionally important gene. Among the genes whose expression was greatest in late passage BMSCs, the fold difference was greatest for ESM1, and CXCL8 is a functionally important gene
Fig. 3
Fig. 3
Ingenuity Pathway Analysis (IPA) of 532 genes differently expressed among early and late passage BMSCs. Unseparated BMSCs were analyzed by RNA sequencing. The transcriptome of early passage BMSCs, passages 4 and 6, was compared with the transcriptome of late passage BMSCs, passages 9 and 10, and 523 genes were found to be differentially expressed (adjusted p value < 0.01, log2 fold change > 1). The 532 genes were subjected to IPA analysis
Fig. 4
Fig. 4
Single cell transcriptome analysis of passages 3, 4, 6, 8 and 9 BMSCs. BMSCs from each passage were separated using a microfluidics platform and were analyzed using RNA-Sequencing. The results were analyzed using 3D Diffusion map visualization (a) and similarity matrix (b). The expression of stromal cell markers CD73, CD90, CD105, CD146 and CD166 on single cells are shown in c. Passage 3 cells are shown in green, passage 4 cells in light blue, passage 6 cells in dark blue, passage 8 cells in yellow, and passage 9 cells in red
Fig. 5
Fig. 5
Hierarchical clustering analysis of the expression of 10 genes predictive of single BMSC time in culture. The binary classification algorithm, based on the mean gene expression for each cluster, was used for gene expression rankings to generate marker predictions which were assessed with receiver operating characteristic (ROC) curves and Wilcoxon signed rank test for p-values. The resulting 10 genes that meet marker gene definitions of area under the ROC curve (AUROC) > 0.85 and p-value < 0.01 are shown. The expressions of these 10 genes among single BMSCs from passages 3, 4, 6, 8 and 9 were analyzed by hierarchical clustering analysis
Fig. 6
Fig. 6
The expression of PLAT and FGFR2 by single BMSCs RNA-seq from passages 3, 4, 6, 8 and 9. The expression of a gene more highly expressed in late passage BMSCs, PLAT, was assessed by single cell RNA-Sequencing (a) and RNA sequencing of unseparated BMSCs (b). The expression of FGFR2, which is more highly expressed in early passage BMSCs, was assessed by single cell RNA sequencing (c) and sequencing of unseparated BMSCs (d). Single cell PLAT expression by each cell was plotted as individual data points and the mean expression level for each passage is shown by a horizontal line
Fig. 7
Fig. 7
Single cell expression of RUX2, ITGB8 and VCAM1 by BMSCs from passages 3, 4, 6, 8 and 9. The expressions by single BMSCs of three genes whose expression was greater in early passage BMSCs, RUNX2 (a), ITGB8 (b) and VCAM1 (c), are shown
Fig. 8
Fig. 8
Identification of BMSC subpopulations within passage 3 cells. BMSCs from passage 3 were analyzed by single cell RNA sequencing. The transcriptome of 36 cells was analyzed by 3D Diffusion map visualization, and 3 BMSC subpopulations were identified. Cells in subpopulation A are show in green, subpopulation B in yellow, and subpopulation C in red
Fig. 9
Fig. 9
Expression of markers of early and late passage BMSCs by passage 3 subpopulations. The single BMSCs in subpopulations A, B and C of passage 3 BMSCs were analyzed for the expression of early passage BMSC markers, FGFR2 (a) and RUNX2 (b), and late passage markers, PLAT (c) and VCAM1 (d). The subpopulations were also analyzed for the expression of the FGFR2 related gene, FGF5 (e)

Similar articles

Cited by

References

    1. Prockop DJ. Marrow stromal cells as stem cells for nonhematopoietic tissues. Science. 1997;276:71–74. doi: 10.1126/science.276.5309.71. - DOI - PubMed
    1. Pittenger MF, Mackay AM, Beck SC, et al. Multilineage potential of adult human mesenchymal stem cells. Science. 1999;284:143–147. doi: 10.1126/science.284.5411.143. - DOI - PubMed
    1. Jiang Y, Jahagirdar BN, Reinhardt RL, et al. Pluripotency of mesenchymal stem cells derived from adult marrow. Nature. 2002;418:41–49. doi: 10.1038/nature00870. - DOI - PubMed
    1. Joyce N, Annett G, Wirthlin L, et al. Mesenchymal stem cells for the treatment of neurodegenerative disease. Regen Med. 2010;5:933–946. doi: 10.2217/rme.10.72. - DOI - PMC - PubMed
    1. Yan P, Xia C, Duan C, et al. Biological characteristics of foam cell formation in smooth muscle cells derived from bone marrow stem cells. Int J Biol Sci. 2011;7:937–946. doi: 10.7150/ijbs.7.937. - DOI - PMC - PubMed

Publication types