. 2019 Jan 11;9(1):3.
doi: 10.1186/s13395-018-0188-4.

Metabolic derangements of skeletal muscle from a murine model of glioma cachexia

Affiliations

Metabolic derangements of skeletal muscle from a murine model of glioma cachexia

Pengfei Cui et al. Skelet Muscle. .

Abstract

Background: Cachexia is a complex metabolic disorder and muscle atrophy syndrome, impacting 80% patients with advanced cancers. Malignant glioma is considered to be one of the deadliest human cancers, accounting for about 60% of all primary brain tumors. However, cachexia symptoms induced by glioma have received little attention. This work aims to explore skeletal muscle atrophy in orthotopic glioma murine models.

Methods: BALB/c nude mice were orthotopicly implanted with normal glial (HEB) and glioma (WHO II CHG5 and WHO IV U87) cells. Cachexia symptoms of mice were depicted by phenotypic, histopathologic, physiological, and biochemical analyses. Muscle atrophy-related proteins were examined by western blot, and the involved signaling pathways were analyzed. NMR-based metabolomic analysis was applied to profile metabolic derangements in the skeletal muscle, including multivariate statistical analysis, characteristic metabolite identification, and metabolic pathway analysis.

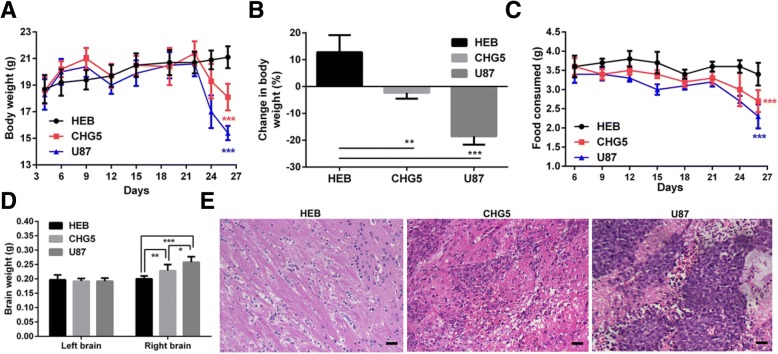
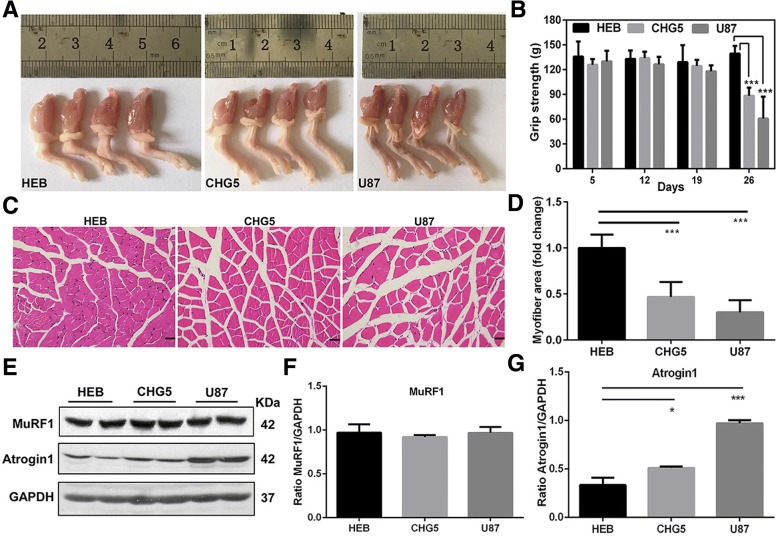
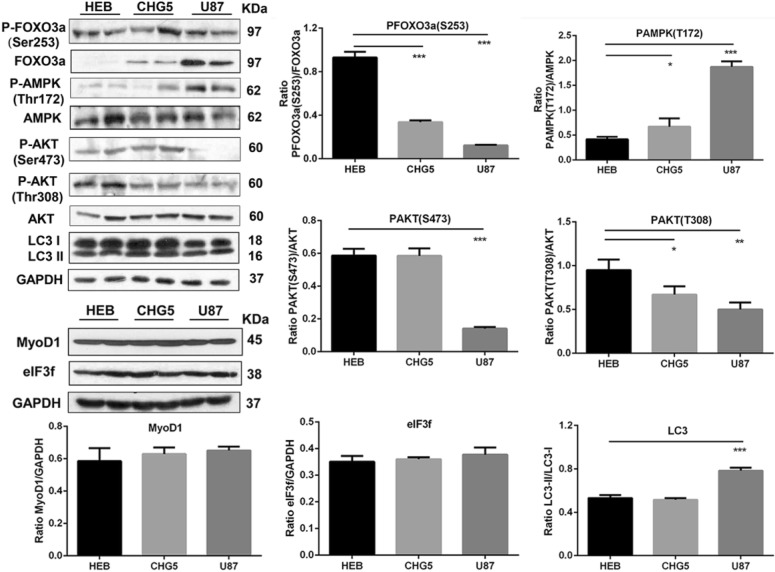
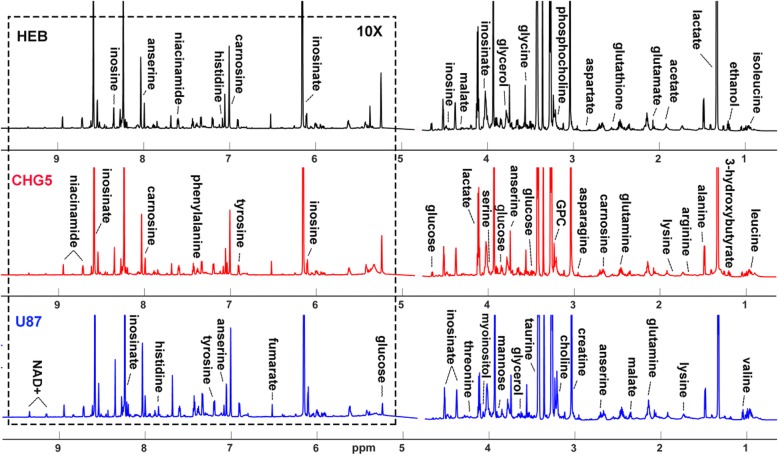
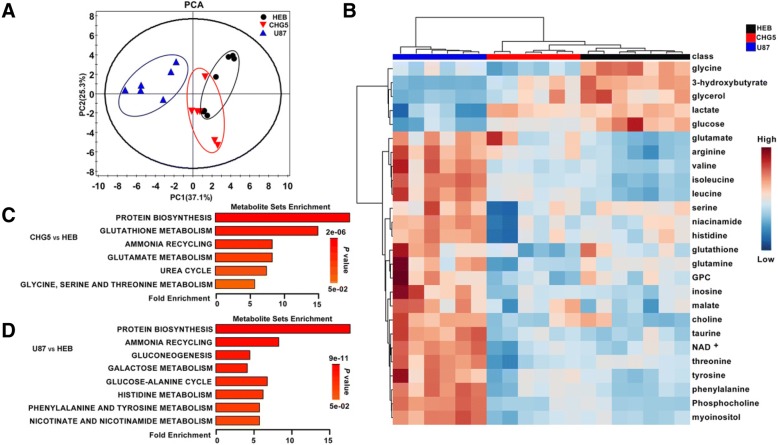
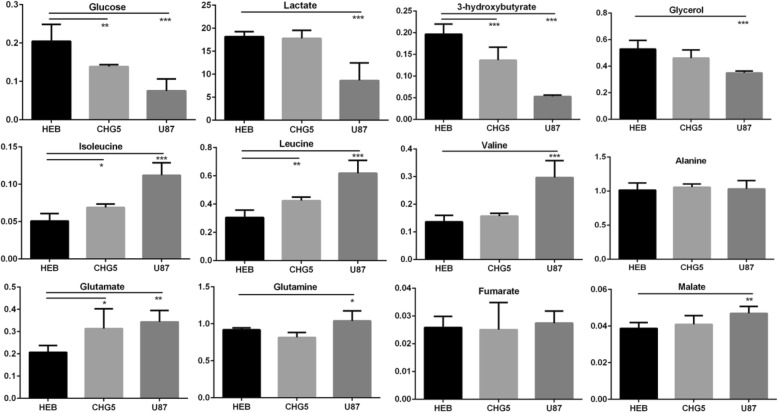
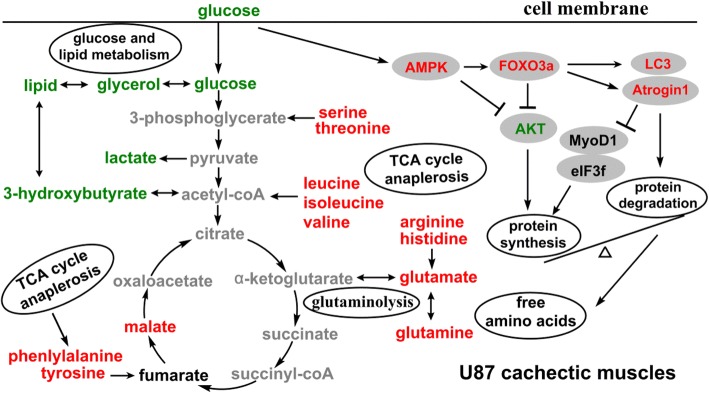
Results: Compared with controls, mice implanted with glioma cells exhibit typical cachexia symptoms, indicating a high correlation with the malignant grades of glioma. U87 mice develop cachexia much earlier and more severe than CHG5 mice. The glioma-bearing mice showed significantly decreased skeletal muscle mass and strength, which were associated with suppressed AKT, activated AMPK, FOXO, Atrogin1, and LC3. Interestingly, expressions of MuRF1, MyoD1, and eIF3f were not significantly changed. Consistently, metabolomic analyses elucidate pronounced metabolic derangements in cachectic gastrocnemius relative to controls. Glucose, glycerol, and 3-hydroxybutyrate were remarkably downregulated, whereas glutamate, arginine, leucine, and isoleucine were upregulated in cachectic gastrocnemius. Furthermore, U87 mice showed more characteristic metabolites and more disturbed metabolic pathways including glucose and lipid metabolism, protein catabolism, anabolism, and citric acid cycle anaplerotic.

Conclusions: This study demonstrates for the first time that the orthotopic glioma murine model developed here exhibits high fidelity of cachexia manifestations in two malignant grades of glioma. Signaling pathway analysis in combination with metabolomic analysis provides significant insights into the complex pathophysiology of glioma cachexia and expands understanding of the molecular mechanisms underlying muscle atrophy.

Keywords: Animal model; Glioma cachexia; Malignant grades; Metabolic derangements; Muscle atrophy; Skeletal muscle metabolism.


Conflict of interest statement

Ethics approval and consent to participate

All animal studies were performed according to protocols approved by Xiamen University Institutional Animal Care and Use Committee.

Consent for publication

Not applicable.

Competing interests

The authors declare that they have no competing interests.

Publisher’s Note

Springer Nature remains neutral with regard to jurisdictional claims in published maps and institutional affiliations.

Figures

Fig. 1
Fig. 1
Orthotopic glioma murine model exhibiting evident body weight loss and glioma formation. The model was established by implanting three human cell lines into the right lateral ventricles of the mice. HEB, CHG5, and U87 represent normal glial, low-grade glioma, and high-grade glioma cells, respectively. Mice inoculated with HEB cells served as the control group. a Body weights of the mice over the course of the study. b Body weight changes in glioma-bearing mice at day 26 of the study period, relative to their initial weights. c Average daily food consumption per mouse over the course of the study period. d Weights of left and right brains of the mice at day 26 of the study period. e Representative micrographs of HE histology of right brains in glioma-bearing mice, relative to controls. Scale bars, 100 μm. Values that were significantly different from the control group were evaluated using one-way ANOVA. Data are presented as mean ± SD (*P < 0 .05; **P < 0.01; ***P < 0.001)
Fig. 2
Fig. 2
Atrophy and expression of E3 ubiquitin ligases in the gastrocnemius muscle in glioma-bearing mice at the time point after implantation. a Macroscopic observation of gastrocnemius muscles in cachectic mice (CHG5 and U87) relative to tumor-free mice (HEB). b Grip strengths of forelimbs monitored every 7 days. c Representative micrographs of HE histology of gastrocnemius muscles. Scale bars, 20 μm. d Quantification of the myofiber cross-sectional areas in glioma-bearing mice relative to HEB mice. eg Expressions of two E3 ubiquitin ligases MuRF1 (f) and Atrogin1 (g) measured by western blot. Values that were significantly different from the control group were evaluated using one-way ANOVA. Data are presented as mean ± SD (*P < 0 .05; **P < 0.01; ***P < 0.001)
Fig. 3
Fig. 3
Expressions of skeletal muscle wasting-related proteins in gastrocnemius muscles of mice. Western blot analyses for proteins including FOXO3a, AMPK, AKT, LC3, MyoD1, and eIF3f. Values significantly different from the control group were evaluated using one-way ANOVA. Data are presented as mean ± SD (*P < 0.05; **P < 0.01; ***P < 0.001 vs. the control group)
Fig. 4
Fig. 4
Average 1D 1H NOESY spectra of aqueous extracts derived from gastrocnemius muscles of mice. The spectra were recorded on a Bruker Advance III 850 MHz NMR spectrometer at 25 °C. The regions of water resonance were removed from the spectra
Fig. 5
Fig. 5
Metabolomic analysis reveals pronounced metabolic disorders in gastrocnemius muscles of glioma-bearing mice compared to controls. a PCA scores plot demonstrating distinct metabolic differences among the three groups of mice. The x-axis represents the first PC accounting for 37.1% of the total variation. The y-axis denotes the second PC accounting for 25.3% of the total variation. Ovals are showed in the panel to highlight metabolic distinctions. b Clustered heatmap plot of relative metabolite levels showing metabolic derangements in glioma cachectic mice relative to controls. One-way ANOVA analysis followed by Tukey’s multiple comparison test was used to perform multiple comparisons of metabolite levels among the three groups of mice (n = 6–7; P < 0.05). c, d Metabolite set enrichment analyses (MSEA) for identifying significantly altered metabolic pathways (P < 0.05) of CHG5 vs. HEB (c) and U87 vs. HEB (d)
Fig. 6
Fig. 6
Relative metabolite levels measured from 1D 1H NMR spectra of aqueous extracts derived from gastrocnemius muscles of three groups of mice. Values significantly different from the control group were evaluated using one-way ANOVA (n = 6–7). Data are presented as means ± SD (*P < 0.05; **P < 0.01; ***P < 0.001 vs. the control group)
Fig. 7
Fig. 7
Overview of significantly altered signaling pathways and metabolic pathways involved in cachectic gastrocnemius of U87 mice relative to normal controls. Downregulated metabolites and proteins are colored green, whereas upregulated metabolites and proteins are colored red. Decreased metabolites as main energy sources include glucose, glycerol and 3-hydroxybutyrate, and amino acids largely released from AMPK-FOXO-Atrogin1/LC3-mediated proteolysis are mostly involved in glucose and lipid metabolism, and TCA cycle anaplerosis, including BCAAs, glutamine, glutamate, phenylalanine, tyrosine, histidine, arginine, serine, threonine, and TCA cycle intermediate malate. Furthermore, AKT-mediated protein synthesis is suppressed in U87 gastrocnemius

References

    1. Fearon K, Strasser F, Anker SD, Bosaeus I, Bruera E, Fainsinger RL, Jatoi A, Loprinzi C, MacDonald N, Mantovani G, et al. Definition and classification of cancer cachexia: an international consensus. Lancet Oncol. 2011;12(5):489–495. doi: 10.1016/S1470-2045(10)70218-7. - DOI - PubMed
    1. Argiles JM, Busquets S, Stemmler B, Lopez-Soriano FJ. Cancer cachexia: understanding the molecular basis. Nat Rev Cancer. 2014;14(11):754–762. doi: 10.1038/nrc3829. - DOI - PubMed
    1. Tisdale MJ. Mechanisms of cancer cachexia. Physiol Rev. 2009;89(2):381–410. doi: 10.1152/physrev.00016.2008. - DOI - PubMed
    1. Lok C. The last illness. Nature. 2015;528(7581):182–183. doi: 10.1038/528182a. - DOI - PubMed
    1. Evans WJ, Morley JE, Argiles J, Bales C, Baracos V, Guttridge D, Jatoi A, Kalantar-Zadeh K, Lochs H, Mantovani G, et al. Cachexia: a new definition. Clin Nutr. 2008;27(6):793–799. doi: 10.1016/j.clnu.2008.06.013. - DOI - PubMed

Publication types