. 2019 Jan 15;50(1):181-194.e6.
doi: 10.1016/j.immuni.2018.11.014. Epub 2019 Jan 8.

Checkpoint Blockade Immunotherapy Induces Dynamic Changes in PD-1-CD8+ Tumor-Infiltrating T Cells

Affiliations

Checkpoint Blockade Immunotherapy Induces Dynamic Changes in PD-1-CD8+ Tumor-Infiltrating T Cells

Sema Kurtulus et al. Immunity. .

Abstract

An improved understanding of the anti-tumor CD8+ T cell response after checkpoint blockade would enable more informed and effective therapeutic strategies. Here we examined the dynamics of the effector response of CD8+ tumor-infiltrating lymphocytes (TILs) after checkpoint blockade therapy. Bulk and single-cell RNA profiles of CD8+ TILs after combined Tim-3+PD-1 blockade in preclinical models revealed significant changes in the transcriptional profile of PD-1- TILs. These cells could be divided into subsets bearing characterstics of naive-, effector-, and memory-precursor-like cells. Effector- and memory-precursor-like TILs contained tumor-antigen-specific cells, exhibited proliferative and effector capacity, and expanded in response to different checkpoint blockade therapies across different tumor models. The memory-precursor-like subset shared features with CD8+ T cells associated with response to checkpoint blockade in patients and was compromised in the absence of Tcf7. Expression of Tcf7/Tcf1 was requisite for the efficacy of diverse immunotherapies, highlighting the importance of this transcriptional regulator in the development of effective CD8+ T cell responses upon immunotherapy.

Keywords: CD8(+) T cell; PD-1; Tim-3; cancer; checkpoint blockade; dysfunction; exhaustion; immunotherapy; memory; single-cell.


Conflict of interest statement

Declaration of interests

A.C.A. is a member of the SAB for Potenza Therapeutics and Tizona Therapeutics, which have interests in cancer immunotherapy. V.K.K. has an ownership interest and is a member of the SAB for Potenza Therapeutics and Tizona Therapeutics. A.C.A.’s and V.K.K.’s interests were reviewed and managed by the Brigham and Women’s Hospital and Partners Healthcare in accordance with their conflict of interest policies. A.R. is a SAB member for Thermo Fisher and Syros Pharmaceuticals and Driver Group. A provisional patent application was filed including work in this manuscript.

Figures
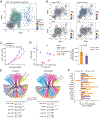
Figure 1.
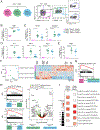
Figure 1.. Transcriptional changes in CD8+ TIL populations upon checkpoint blockade
A) tSNE plot showing projection of the CD8+ T cell dysfunction signature (Methods) and B) expression of Tim-3, Lag-3, TIGIT, PD-1 in single-cell CD8+ TILs data (Singer et al., 2016). C-F) C57BL/6 mice were implanted subcutaneously with MC38-OVA and treated with either rat IgG2a (blue) or anti-Tim-3 (RMT3–23) and anti-PD-1 (RMP1–14) (red) on days 4, 7, and 10. C) Mean tumor size is shown. ****p<0.0001, linear regression. D) Principle component analysis (PCA) of Tim-3+PD-1+ and Tim-3PD-1 CD8+ TILs in mice treated with isotype (blue) vs. Tim-3+PD-1 blockade (red). CD8+ TILs were isolated two days after the last treatment and gene expression analyzed by RNA sequencing. Bar graph shows the mean delta Euclidean distance between the isotype and Tim-3+PD-1 blockade treated groups for Tim-3PD-1 and Tim-3+PD-1+ CD8+ TILs (p=0.0002, t-test). E) Wheel graphs showing enrichment of effector signatures (Hervas-Stubbs et al., 2010; Kaech et al., 2002; Kalia et al., 2010; Sarkar et al., 2008) in up (Left) and down (Right) genes in Tim-3+PD-1+ (purple) and Tim-3PD-1 CD8+ (orange) TILs after Tim-3+PD-1 blockade, (p=0.008, paired t-test). P values for enrichment of each signature are indicated, hypergeometric test. F) Bar graph showing fold changes in selected effector T cell genes in Tim-3+PD-1+ and Tim-3PD-1 CD8+ TILs after Tim-3+PD-1 blockade.
Figure 2.
Figure 2.. PD-1 CD8+ TILs contain tumor-antigen-specific precursors that proliferate in response to checkpoint blockade
A) Number of PD1 and PD1+ CD8+ TILs in Tim3+PD1 blockade- or isotype-treated mice over time. **p<0.01, Mann Whitney U test. B) Frequency of Ki67+ cells within PD1 and PD1+ CD8+TILs from Tim3+PD1 blockade- or isotype-treated mice over time. **p<0.01, Mann Whitney U test. C) Frequency of OVA-specific PD1CD8+ TILs in tumors from Tim3+PD1 blockade- or isotype-treated mice. *p<0.05, Mann Whitney U test. D) Schematic of the experiment (left), representative flow cytometry (middle) and frequencies of PD1 and Tim3-expressing cells in adoptively transferred mice (right). **p<0.01, Mann Whitney U test.
Figure 3.
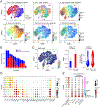
Figure 3.. Identification of PD-1CD8+ TIL subsets that change upon checkpoint blockade
tSNE plots showing (A) projection of the differentially expressed genes in Tim-3PD-1 CD8+ TILs (Tim-3+PD-1 blockade vs isotype) and (B) projection of an effector CD8+ T cell signature (Kaech et al., 2002) onto the single-cell RNA profiles of Tim-3PD1 CD8+ TILs (Singer et al., 2016). Single-cells expressing Tim-3 (Havcr2) or PD-1 (Pdcd1) were excluded from the analysis (grey). C) Heatmap showing the differentially expressed genes between Group 1 cells (enriched in Tim-3+PD-1 blockade treated mice) and Group 2 cells (enriched in isotype treated mice).
Figure 4.
Figure 4.. Functional and transcriptional characterization of PD-1CD8+ TIL subsets
A) Schematic representation and representative flow cytometry data showing identification of CD62LhiSlamf7CX3CR1, CD62LSlamf7hiCX3CR1 and CD62LSlamf7hiCX3CR1+ subsets within PD-1CD8+ TILs. B) Frequency of Ki67+ cells among the indicated PD-1CD8+ TIL populations. C) Frequency of Granzyme B+ (left) or CD107a+ (right) cells among the indicated PD-1CD8+ TILs populations. For CD107a staining, cells were stimulated with 5 μg/ml OVA257–264. D) Frequency of IL-2, TNF-α, and IFN-γ-producing cells among the indicated PD-1CD8+ TILs populations after stimulation with 5 μg/ml OVA257–264. E) Frequency of OVA-specific cells within the indicated subsets of PD-1CD8+ TILs populations. All the p values indicated are calculated by One-way ANOVA, Tukey’s multiple comparison test. *p<0.05, **p<0.01, ***p<0.001, ****p<0.0001. F) PCA (left) and heatmap (right) of CD62LhiSlamf7, CD62LSlamf7hiCX3CR1, and CD62LSlamf7hiCX3CR1+ populations within PD-1CD8+ TILs isolated from MC38-OVA tumors. G) Gene-set enrichment analysis (GSEA) plots showing enrichment for a naïve CD8+ T cell signature (Kaech et al., 2002) in CD62LhiSlamf7 cells, FDR-adjusted P value =0.011, Kolmogorov-Smirnov. H) GSEA plots (left) and Volcano plot (right) showing enrichment for CD127lo effector and CD127hi memory-precursor CD8+ T cell signatures (Joshi et al., 2007) in CD62LSlamf7hiCX3CR1 and CD62LSlamf7hiCX3CR1+, respectively. FDR- adjusted P value =0.027, Kolmogorov-Smirnov. I) GSEA plot showing enrichment of memory and effector CD8+ T cell signatures (Methods) in CD62LSlamf7hi CX3CR1 vs CX3CR1+ subsets. Color scale indicates the expression score in the indicated subset and the square size indicates the 1-FDR. See also Figure S1.
Figure 5.
Figure 5.. PD-1 CD8+ TILs in different therapeutic contexts and their relevance in human cancer
A) Frequency of the indicated PD1CD8+ TILs subsets in tumors from Tim3+PD1 blockade- or isotype-treated MC38OVA-bearing mice over time. **p<0.01, Mann Whitney U test. B) Frequency of Ki67+ cells and (C) OVA-specific cells within the indicated PD1 CD8+TILs subsets from Tim3+PD1 blockade- or isotype-treated MC38OVA-bearing mice. *p<0.05, Mann Whitney U test. D) Frequency of the indicated PD1CD8+ TILs subsets from CTLA-4+PD-L1 blockade- or isotype-treated MC38OVA-bearing mice. ***p<0.001, *p<0.05, Mann Whitney U test. E) Frequency of the indicated PD-1 CD8+ TILs subsets from CTLA-4+PD-1 blockade- or isotype-treated B16F10- bearing mice (right panel). *p<0.05, Mann-Whitney U test. Data are from two independent experiments. See also Figure S2.
Figure 6-
Figure 6-. Single-cell analysis reveals shared transcriptional programs after checkpoint blockade in murine and human cancer
A) I) tSNE plot of single-cell RNA profiles of PD-1CD8+ TILs from isotype (blue) and Tim-3+PD-1 blockade (red) -treated mice. II) Unsupervised clustering of the single-cell RNA profiles of PD-1CD8+ TILs. (Methods). III) projection of an effector CD8+ T cell signature (Kaech et al., 2002), IV) the CD62LhiSlamf7 naïve-like signature, V) the Slamf7hiCX3CR1 memory-precursor-like signature, and VI) the Slamf7hiCX3CR1+ effector-like signature onto the PD-1CD8+ TILs single-cell data. The contour marks the region of highly scored cells by taking into account only those cells that have a signature score above the 10th percentile. B) Bar graphs showing the number of cells present in each cluster from isotype (blue) or anti-Tim-3+PD-1 (red) -treated groups, *p-values <0.001, Fisher’s exact test. C) tSNE plot showing the expression of Ki67 among PD-1 CD8+ single-cells. Bar plot shows expression of Ki67 and violin plot shows expression of a proliferation signature (Tirosh et al., 2016) in isotype versus Tim-3+PD-1 blockade treated cells from cluster 10. D) Dot plot showing expression of the indicated genes in selected clusters. Color scale indicates the expression score of each gene in the indicated cluster. Circle size indicates the percentage of cells that expresses the gene within the indicated cluster. E) Projection of several human signatures (Methods) onto single-cell clusters (6A, panel II). The color scale shows the average expression signature score of all the cells that compose the cluster. Circle size indicates the percentage of the cells in each cluster that expresses a signature above the median. Dark borders indicate clusters that were either significantly concentrated or depleted of high scoring cells (FDR-adjusted P value <0.05, t-test). Naïve-like, effector-like, and memory-precursor-like clusters are indicated by the colored bars. See also Figures S3 and S4.
Figure 7.
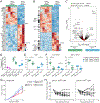
Figure 7.. Tcf7 is required for effective anti-tumor responses after immunotherapy
A) Heatmap of differentially expressed transcription factors between Slamf7hiCX3CR1 and Slamf7hiCX3CR1+ PD-1CD8+ TILs. B) Heatmap of differentially expressed genes between Slamf7hiCX3CR1 and Slamf7hi CX3CR1+ PD-1CD8+ TILs. Tick marks indicate the genes that are bound by Tcf7 according to Tcf7 CHIP-Seq data (Steinke et al., 2014) (Methods). C) Volcano plot showing enrichment for differentially expressed genes in Tcf7-deficient TCR transgenic memory CD8+ T cells (Zhou et al., 2010) in Slamf7hiCX3CR1 and Slamf7hiCX3CR1+ PD-1CD8+ TILs. D-F) E8i-CreTcf7fl/fl and E8i-Cre+ Tcf7fl/fl mice were implanted with MC38-OVA and TILs analyzed 10–12 days post implantation. D) Frequency of the indicated subsets within PD-1 CD8+ TILs in E8i-CreTcf7fl/fl and E8i-Cre+Tcf7fl/fl mice. *p<0.05, Mann-Whitney U test. E) Frequency of OVA-specific cells in the indicated subsets of PD-1 CD8+ TILs in E8i-CreTcf7fl/fl and E8i-Cre+Tcf7fl/fl mice. *p<0.05, Mann-Whitney U test. F) Frequency of IL-2-, TNF-α-, and IFN-γ-producing cells in the indicated subsets of PD-1 CD8+ TILs from E8i-Cre−Tcf7fl/fl and E8i-Cre+Tcf7fl/fl after ex vivo stimulation with 5 ug/ml OVA257–264 peptide. *p<0.05, Mann-Whitney U test. G) E8i-CreTcf7fl/fl and E8i-Cre+Tcf7fl/fl mice were implanted with MC38-OVA and treated with isotype or Tim-3+PD-1 blockade. Mean tumor growth is shown. Data are pooled from three independent experiments. *p<0.05, ****p<0.0001, linear regression. H) E8i-CreTcf7fl/fl and E8i-Cre+Tcf7fl/fl mice were implanted with MC38-OVA and treated with PBS or TLR9 agonist (IMO-2125). % change in tumor burden is shown. Data are from three independent experiments. p=0.0361, Fisher’s exact test. See also Figures S5 and S6.

Comment in

References

    1. Agarwal P, Raghavan A, Nandiwada SL, Curtsinger JM, Bohjanen PR, Mueller DL, and Mescher MF (2009). Gene regulation and chromatin remodeling by IL-12 and type I IFN in programming for CD8 T cell effector function and memory. Journal of immunology 183, 1695–1704. - PMC - PubMed
    1. Ahn E, Youngblood B, Lee J, Lee J, Sarkar S, and Ahmed R (2016). Demethylation of the PD-1 Promoter Is Imprinted during the Effector Phase of CD8 T Cell Exhaustion. Journal of virology 90, 8934–8946. - PMC - PubMed
    1. Anders S, and Huber W (2010). Differential expression analysis for sequence count data. Genome biology 11, R106. - PMC - PubMed
    1. Baitsch L, Baumgaertner P, Devevre E, Raghav SK, Legat A, Barba L, Wieckowski S, Bouzourene H, Deplancke B, Romero P, et al. (2011). Exhaustion of tumor-specific CD8(+) T cells in metastases from melanoma patients. The Journal of clinical investigation 121, 2350–2360. - PMC - PubMed
    1. Blondel VD, Guillaume J, Lambiotte R, and Lefebvre E (2008). Fast unfolding of communities in large networks. Journal of Statistical Mechanics: Theory and Experiment 2008, P10008.

Publication types

MeSH terms

Substances